Genotyping‐by‐sequencing informs conservation of Andean palms sources of non‐timber forest products
Nicolás Peñafiel Loaiza, Abigail H. Chafe, Mónica Moraes R, Nora H. Oleas, Julissa Roncal

TL;DR
This study uses DNA sequencing to guide conservation of endangered Andean palms, revealing their genetic structure and suggesting strategies for protecting them.
Contribution
The study provides the first genomic insights into Parajubaea palms, challenging taxonomic assumptions and proposing conservation strategies.
Findings
Genetic data reject the taxonomic separation of two Bolivian Parajubaea species.
Three genetic clusters shaped by geography suggest three management units for conservation.
Low genetic diversity but no inbreeding was observed in these narrow endemic palms.
Abstract
Conservation and sustainable management of lineages providing non‐timber forest products are imperative under the current global biodiversity loss. Most non‐timber forest species, however, lack genomic studies that characterize their intraspecific variation and evolutionary history, which inform species' conservation practices. Contrary to many lineages in the Andean biodiversity hotspot that exhibit high diversification, the genus Parajubaea (Arecaceae) has only three species despite the genus' origin 22 million years ago. Two of the three palm species, P. torallyi and P. sunkha, are non‐timber forest species endemic to the Andes of Bolivia and are listed as IUCN endangered. The third species, P. cocoides, is a vulnerable species with unknown wild populations. We investigated the evolutionary relationships of Parajubaea species and the genetic diversity and structure of wild Bolivian…
Genes, proteins, chemicals, diseases, species, mutations and cell lines named across the full text — each resolved to its canonical identifier and authoritative record.
Click any figure to enlarge with its caption.
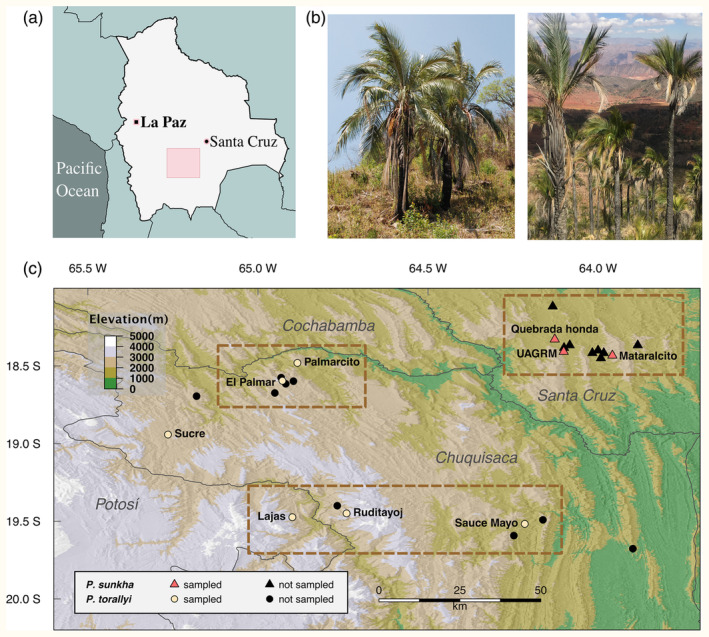 FIGURE 1
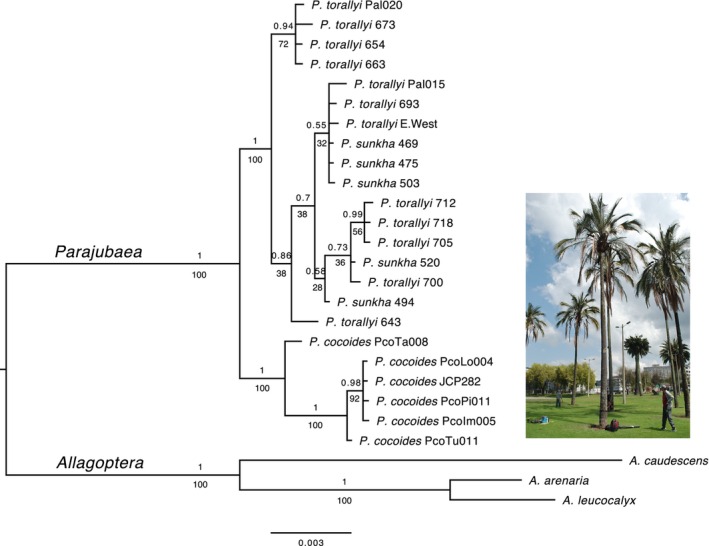 FIGURE 2
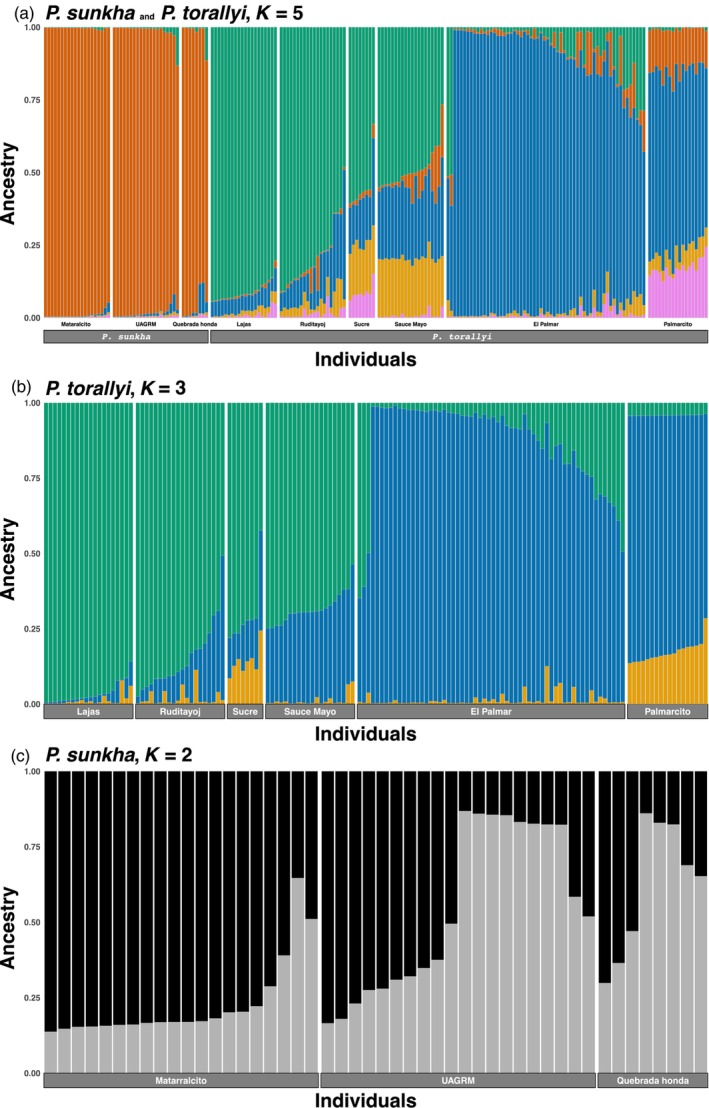 FIGURE 3
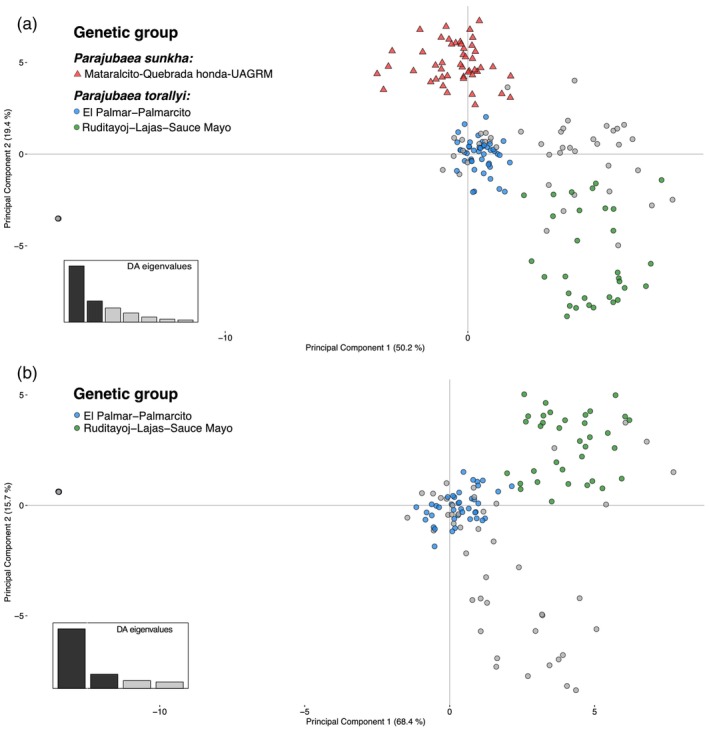 FIGURE 4
| Species | Technique | # markers | Main result | Reference |
|---|---|---|---|---|
|
| Genotyping‐by‐sequencing | 929 neutral SNPs | Moderate genetic diversity (He = 0.201 to 0.265). Low to high genetic differentiation between populations ( | Costa et al. ( |
|
| Inter‐simple sequence repeats | 7 primers 101 loci | Moderate genetic diversity mean Nei's | dos Santos et al. ( |
| Genus | Genotyping‐by‐sequencing | 3227 neutral SNPs | Contributed to species delimitation, recognized four species. Unknown sister of the incipiently domesticated | Díaz et al. ( |
|
| Genotyping‐by‐sequencing | 3259 neutral SNPs | Two genetic groups. Three geographic barriers to gene flow. Low genomic diversity (He = 0.005 to 0.081). None to high levels of inbreeding ( | Díaz et al. ( |
|
| Microsatellites | 6 | Moderate genetic diversity (Ho = 0.31 to 0.48). Evidence of inbreeding (Ho < He). Moderate to high population differentiation ( | Lanes et al. ( |
|
| Single locus amplified fragment sequencing | 130,414 SNPs | Moderate genetic diversity (He = 0.29 to 0.33). Evidence of inbreeding (Ho < He). | Xia et al. ( |
|
| Genotyping‐by‐sequencing | 10,835 SNPs | Moderate to high genomic diversity (He = 0.019 to 0.872). High population differentiation ( | Rajesh et al. ( |
|
| Genotyping‐by‐sequencing | 6017 bi‐allelic SNPs | Low genotypic richness ( | Sharif et al. ( |
|
| Microsatellites | 24 | Moderate to high levels of polymorphism (He = 0.2 to 0.86). Slight heterozygote deficit ( | Arnau et al. ( |
| Genus | Genotyping‐by‐sequencing | 28,800 nuclear SNPs | Well‐resolved phylogeny of | Hamon et al. ( |
|
| Whole genome sequencing | 15,367,960 SNPs |
| Huang et al. ( |
| Species/genetic group | № of individuals | № of private alleles | Nucleotide diversity π (SE) | Observed heterozygosity | Expected heterozygosity | Inbreeding coefficient |
|---|---|---|---|---|---|---|
|
| ||||||
| Sunkha | 48 | 143 | 0.14577 (0.00485) | 0.17513 (0.00749) | 0.13707 (0.00456) | −0.03974 (0.17885) |
|
| ||||||
| El Palmar/Palmarcito | 78 | 438 | 0.16396 (0.00443) | 0.16455 (0.00652) | 0.15724 (0.00424) | 0.05313 (0.19145) |
| Ruditayoj/Lajas/Sauce Mayo | 60 | 768 | 0.20353 (0.00402) | 0.19101 (0.00614) | 0.19395 (0.00383) | 0.09445 (0.18472) |
| Sunkha | El Palmar/Palmarcito | Ruditayoj/Lajas/Sauce Mayo | |
|---|---|---|---|
| Sunkha | — | 0.0812 | 0.0856 |
| El Palmar/Palmarcito | — | 0.0761 |
| Source of variation | %var |
|
| SD |
|
|
|---|---|---|---|---|---|---|
| Within individuals | 0.865 | F_it | 0.135 | 0.022 | – | — |
| Among individuals within genetic clusters | −0.00 | F_is | −0.00 | 0.021 | 0.554 | — |
| Among genetic clusters | 0.135 | F_st | 0.135 | 0.010 | 0.001 | 0.164 |
- —International Union for Conservation of Nature (IUCN)
- —The International Palm Society
- —Universidad Indoamérica
- —Natural Sciences and Engineering Research Council of Canada 10.13039/501100000038
- —Memorial University of Newfoundland 10.13039/501100005616
Peer Reviews
No public reviews on file for this paper yet. If you reviewed it on a platform where reviews are public (OpenReview, ICLR, NeurIPS, ICML), you can paste yours below so the community can read it here.
Videos
No videos yet. Explain this paper in a talk, walkthrough, or lecture? Add one.
Taxonomy
TopicsGenetic diversity and population structure · Genomics and Phylogenetic Studies · Plant and Fungal Interactions Research
INTRODUCTION
1
Worldwide, non‐timber forest products contribute significantly to the livelihood of millions of people from both rural and urban communities (Hurley & Emery, 2018; Wahlén, 2017). Non‐timber forest products help to fulfill basic subsistence and consumption needs ranging from energy, nutrition and medicine to construction. Furthermore, they provide regular cash representing from 10% to 60% of the total household income in African, Asian and American communities (Godoy et al., 2002; Heubach et al., 2011; Shackelton & Pandey, 2014). Given the current global biodiversity loss, many economically important species are threatened with extinction, therefore, conservation and sustainable use of non‐timber forest species are imperative. The need to protect these resources should go beyond the traditional conservation practices that focus on species‐level approaches and should include methods that investigate intraspecific diversity (Coates et al., 2018).
Many species in the palm family (Arecaceae) are considered a ‘biocultural keystone’ since they provide ecological and cultural services (Shackleton et al., 2018). Palms are often regarded as ecological keystones because they produce highly nutritious fruit year‐round for fauna (Peres, 2000; Terborgh, 1986), and a cultural keystone because they are regarded together with grasses and legumes as one of the three most economically important plant families to humanity (Dransfield et al., 2008). Rural tropical societies depend on palms for a wide diversity of needs (Macía et al., 2011; Moraes et al., 2015; Paniagua‐Zambrana et al., 2007), making many palm species important sources of non‐timber forest products. In South America, palms are mostly harvested from their natural habitat and in many cases in an unsustainable way (38 out of the 97 species surveyed by Bernal et al., 2011).
Earlier evolutionary and population genetic studies of biocultural keystone palms have successfully guided conservation actions through the creation of protected areas, collection of seeds for ex situ conservation and recommendations for translocations or introductions (e.g. Asmussen‐Lange et al., 2011; González‐Pérez et al., 2004; Namoff et al., 2011; Sanín et al., 2017; Shapcott et al., 2007). Many studies, however, have not used next‐generation sequencing to discover single‐nucleotide polymorphisms (SNPs), which have become desirable molecular markers due to their abundance, wide genomic coverage, access to neutral regions and loci under selection, low error rates, and in many cases do not need a reference genome (Boutet et al., 2016; Helyar et al., 2011). Only recently, SNPs have been used in palms to reveal intraspecific diversity (Table 1). For example, the discovery of 929 neutral SNPs in wild populations of Copernicia prunifera (carnaúba palm) helped to propose the establishment of large in situ conservation areas for capturing the moderate genetic diversity found in this species (Costa et al., 2022). Furthermore, an excess instead of a deficit in heterozygosity, suggesting no inbreeding, was found compared to an earlier study using inter‐simple sequence repeats as markers (dos Santos et al., 2021; Table 1).
Single nucleotide polymorphisms have also contributed to the taxonomic controversy around species boundaries in palm genera like Acrocomia, Brahea, Washingtonia and Geonoma (Díaz et al., 2021; Klimova et al., 2018; Olivares et al., 2024). In other plant families (e.g. Rubiaceae: Coffea), SNPs achieved a higher genetic resolution than with other molecular markers like the internal transcribed spacer and intergenic plastid markers (Hamon et al., 2017; Huang et al., 2020; Table 1). SNPs unmasked a higher genetic diversity in Coffea arabica compared to the other two most commonly cultivated coffee species (C. canephora and C. excelsa) and uncovered a strong genetic divergence among these three species (Huang et al., 2020).
Parajubaea Burret is a palm genus (subtribe Attaleinae, tribe Cocoseae, subfamily Arecoideae) endemic to the Andes (Dransfield et al., 2008), growing at elevations from 1700 to 3400 m above sea level (Moraes, 1996). It is evolutionarily unique because it diverged from its sister genus Allagoptera Nees by vicariance of a widespread South American ancestor likely due to the formation of the aquatic Pebas system, approximately 22 million years ago (Meerow et al., 2015). This ancestral lineage originated in the Atlantic coastal forest of Brazil and spread west into the Andean region 29–22 million years ago (Meerow et al., 2015), a time when the central eastern Andes had not yet reached half of its current elevation (Boschman, 2021; Gregory‐Wodzicki, 2000). Lineages that arrived in the Andes from the Atlantic coastal forest are extremely rare (Antonelli et al., 2018), likely because of the long‐distance dispersal, or the barrier presented by the Cerrado and Chaco dry ecosystems. Unlike many Andean species‐rich clades, there are only three currently recognized species within Parajubaea (Dransfield et al., 2008). Whether this is a result of low speciation rates or due to extinction after diversification is unknown. Two of the three species, P. torallyi (Mart.) Burret and P. sunkha M. Moraes, are allopatric species endemic to Bolivia, and currently found in very few interandean dry valleys with semideciduous forests or xeric vegetation in the south‐central part of the country (Table S1, Figure 1; Moraes, 1996, 2020; Moraes et al., 2020). The third species, P. cocoides Burret, is known to exist only in cultivation, usually in plazas and courtyards of many Andean cities in Colombia, Ecuador and Peru (Moraes, 1996; Moraes & Henderson, 1990; but see Roca, 2010). The most recent dated phylogenetic analysis of the tribe Cocoseae (Meerow et al., 2015) sampled a single individual each from P. cocoides and P. torallyi but did not include P. sunkha. Thus, the phylogenetic relationship among the three species remains unknown. Furthermore, genetic data have shown that cultivated and domesticated plants originate from wild populations, and can be subject to a complex array of processes ranging from hybridization among wild species (Fan & Whitaker, 2024; Pérez‐Escobar et al., 2021), reduction of genetic diversity and introgression (Ding et al., 2022) and even the combination of introgressions, hybridizations and polyploidization (Song et al., 2023). DNA sequencing may therefore help to identify the genetic origin of P. cocoides as a cultigen.
(a) Map of Bolivia within the South American continent indicating main cities and the area of the map in C (pink rectangle). (b) Photos of P. sunkha (left) and P. torallyi (right) in the wild from Mataralcito and Ruditayoj collection sites, respectively. (c) Map showing the geographical distribution of all known wild and cultivated Parajubaea populations in Bolivia, and the collection sites for this study. Departments' names are shown in grey. Dashed‐line bordered rectangles represent the proposed management units; sites that were not sampled are included due to their proximity to the collection sites, but their genetic makeup is unknown. Map created with digital elevation data from the NASA Shuttle Radar Topographic Mission (SRTM) available at https://srtm.csi.cgiar.org/. The coordinate system used was EPSG:4326 and WGS84 datum.
Parajubaea is the source of many non‐timber forest products. The fruit and seeds are edible and are consumed at a local commercial scale in Bolivia (Moraes, 1996; Vargas, 1994). Parajubaea's petiole fiber is used for the manufacturing of mattresses, saddle pillows and ropes. Leaves are harvested for construction, and the crafting of fans and baskets, while palm hearts and young leaves are used for forage (Enssle et al., 2006; Moraes et al., 2017). However, fiber harvest can hinder the recruitment of new individuals because inflorescences and infructescences are commonly removed with this practice (Enssle et al., 2006). The two Bolivian species (P. sunkha and P. torallyi) are threatened by their unsustainable harvest, forest fragmentation, intensive land use conversion for local crops, limited regeneration in certain areas, their slow growth and the small geographic range of their populations (Enssle et al., 2006; Moraes et al., 2017; Thompson et al., 2009). Consequently, both species are listed as Endangered by the IUCN (Enssle, 2006; Enssle et al., 2006; Moraes, 2022).
In this study, we (1) infer the phylogenetic relationships among the three Parajubaea species to gain insight into their evolutionary origin, (2) estimate the genetic diversity and structure of wild Bolivian Parajubaea populations, (3) delineate management units for conservation, which are defined as local populations managed as distinct units because of their demographic independence (Hohenlohe et al., 2021) and (4) recommend strategies for long‐term in situ and ex situ conservation of the two wild non‐timber forest species. Parajubaea cocoides is a cultigen hypothesized to have originated from wild Bolivian Parajubaea given its morphological resemblance with P. torallyi and because no wild populations exist in the northern Andes (Moraes & Henderson, 1990). Thus, we expect P. cocoides to be nested within the Bolivian Parajubaea species in a phylogenetic analysis. We further hypothesize that wild Parajubaea populations in Bolivia will show low genetic diversity probably due to genetic drift in the usually small number of individuals in narrow endemic species, and the genetic structure will be shaped by geographic distance as demonstrated for other Neotropical palms due to distance limitations in gene flow (e.g. Melo et al., 2018; Roncal et al., 2015; Sanín et al., 2022).
MATERIALS AND METHODS
2
Sample collection and total DNA extraction
2.1
To investigate the phylogenetic relationship among the three Parajubaea species we sampled 12 individuals of P. torallyi, 5 of P. sunkha and 6 of P. cocoides (Table S2). One individual each from Allogoptera leucocalyx (Drude) Kuntze, A. caudescens (Mart.) Kuntze and A. arenaria (Gomes) Kuntze were sampled as the outgroup. We obtained DNA sequences for five nuclear genes through Sanger sequencing for a total of 26 individuals. To address the second objective of the study, we sampled a total of 194 individuals of P. sunkha and P. torallyi for genotyping‐by‐sequencing (GBS; Table S3). Three localities in the department of Santa Cruz, Bolivia, were sampled for P. sunkha in October 2016, resulting in a total of 48 individuals. Samples of P. torallyi were collected at six localities in the departments of Chuquisaca and Potosí, Bolivia, from 146 individuals between October 2016 and August 2020. All collection sites consisted of wild populations, except for Sucre, where Parajubaea is cultivated (Figure 1). Fragments of fresh leaves from every individual were stored and transported in paper envelopes containing silica gel. We stored leaf samples at the Herbario Nacional de Bolivia (LPB) and at Memorial University of Newfoundland in Canada.
We ground leaf fragments using a TissueLyser LT machine (Qiagen). We isolated DNA from 50 mg of dried leaf tissue using the Qiagen DNeasy Plant Mini Kit with the following modifications to the original manufacturer's protocol. We added 600 μL of Buffer AP1 to the ground plant material. After vortexing, we incubated the mixture for 15 min at 65°C. We added 195 μL of Buffer P3 to the lysate. We used 50 μL of Qiagen Buffer AE for the final DNA elution. We performed a second elution step by pouring the volume obtained from the first elution directly on the same Qiagen column and waiting for 5 min at room temperature. We diluted total DNA extractions to 20 ng/μL in Qiagen Buffer EB.
Amplification of low‐copy nuclear genes and phylogenetic reconstruction
2.2
To address our first objective, we sequenced five low‐copy nuclear DNA regions from the WRKY gene family: WRKY6, WRKY7, WRKY12, WRKY16 and WRKY21 following Meerow et al. (2015). WRKY transcription factors are mostly plant‐specific proteins that were chosen because they proved useful for inferring the species‐level phylogenetic tree of tribe Cocoseae (Meerow et al., 2015). Polymerase chain reaction (PCR) was performed using a 20 μL reaction volume containing 5 μL of the Qiagen AllTaq© 4× Master Mix (final concentration 1×), 0.25 μM of each forward and reverse primer, and 20 ng of template DNA. PCR amplification was carried out in a Veriti 96‐Well Thermal Cycler (Applied Biosystems) with a cycling protocol of 2 min at 95°C (initial denaturation), followed by 40 cycles of 20 s at 95°C (denaturation), 30 s at 56–58°C (annealing) and 30 s at 72°C (extension), followed by a final 5‐min extension at 72°C. WRKY primers, annealing temperatures and PCR product sizes are detailed in Table S4.
Amplifications were visualized by electrophoresis in 1.5% agarose gel stained with RedSafe™ and under ultraviolet light. PCR products were purified using the Qiagen QIAquick PCR Purification Kit (Qiagen Inc, Valencia, CA, USA) before being sent for Sanger sequencing to the Centre for Applied Genomics at the Hospital for Sick Children (Canada, http://www.tcag.ca/). The resulting chromatograms were observed, assembled and edited in Geneious Prime® 2023.2.1 (https://www.geneious.com, Biomatters Ltd.). IUPAC codes were used to treat heterozygotes. Sequences for each molecular marker were aligned individually using the Geneious alignment implementation of Geneious Prime®. Alignments were later manually curated to get a total concatenated DNA matrix consisting of 3753 aligned positions and approximately 21% missing data.
We used two model‐based methods to reconstruct the phylogenetic relationships of Parajubaea. A maximum likelihood (ML) analysis was conducted in RAxML‐NG v1.2.0 (Kozlov et al., 2019), and Bayesian inference (BI) was carried out in MrBayes v3.2.7 (Ronquist et al., 2012), both available in the CIPRES Science Gateway v3.3 (Miller et al., 2010). We determined the best‐fit nucleotide substitution model for each WRKY region with ModelTest‐NG v0.1.7 (Darriba et al., 2020) also available in CIPRES. We specified a maximum parsimony topology type, selected the candidate model's rate heterogeneity to both +I + G, and the remaining model parameters were set as default. We chose the Akaike and Bayesian information criteria to select the best‐fit model for each WRKY region (Table S4).
For the ML analysis, we set the among‐site rate heterogeneity model to discrete GAMMA with four categories, mean category rates and ML estimate of alpha. We evaluated branch support by conducting Felsenstein bootstrap with 1000 replicates. All other RAxML‐NG parameters were set as default. For the BI, we executed two independent Markov chain Monte Carlo (MCMC) runs; each with four simultaneous chains, using a random starting tree and ran for one million generations sampling every 1000 trees. Partitions were set to be independent in terms of the shape of the scaled gamma distribution of site rates, proportion of invariable sites (pinvar), substitution rates matrix (revmat) and stationary nucleotide frequencies (statefreqs). The overall substitution rate was allowed to vary across the subsets of the alignment (ratepr = variable). We assessed the stabilization of each run by looking at the plot of the generation versus log‐likelihood values in Tracer v1.7.1 (Rambaut et al., 2018), and by ensuring that all effective sample sizes exceeded 200. We also verified that the standard deviation of split frequencies was close to 0. and that the potential scale reduction factor was close to 1.0 as runs converged. We discarded the first 25% of generations as burn‐in samples. Post burn‐in samples from the two runs were combined and used to calculate a majority rule consensus tree summarizing information on topology, branch lengths and posterior probabilities (PP). We visualized ML and BI trees in FigTree v1.4.4 (http://tree.bio.ed.ac.uk/software/figtree/).
Genotyping‐by‐sequencing (GBS)
2.3
The Institut de Biologie Intégrative et de Systèmes of the University of Laval in Canada conducted a two‐enzyme GBS (Poland et al., 2012) on the DNA extracted from 194 individuals of P. sunkha and P. torallyi. We followed Abed et al. (2019) for all steps of DNA digestion with SbfI and MspI restriction enzymes, design and ligation of unique barcodes 10–12 base pairs (bp) long and common/Y adapters (Mascher et al., 2013), PCR amplification and genomic library preparation. We sequenced samples in two separate batches as they became available from the field. For the first, which comprised 168 samples (Table S3), an Ion Torrent Proton technology (ThermoFisher Scientific) and single‐end sequencing were applied. For the second, which comprised 26 samples, we obtained paired‐end reads with an Illumina NovaSeq 6000 S4 machine (Table S3). Génome Québec (Canada) performed all sequencing.
We demultiplexed the raw reads with Sabre (https://github.com/najoshi/sabre) and screened them with FastQC v0.11.5 (Andrews, 2010) to check for Phred quality scores and to determine the most appropriate parameters for trimming in Trimmomatic v0.38 (Bolger et al., 2014). For every read, we removed the first 15 bases and shortened the length to 90 nucleotides. We discarded reads that were shorter than 90 bp, or that had an average quality score lower than 20.
To combine single‐end and paired‐end reads, and in the absence of a reference genome for Parajubaea, we used a de novo approach in Stacks v2.53 (Rochette et al., 2019). We first created the reverse complement of the reverse reads of all samples that were paired‐end sequenced (Table S3) with the FASTX toolkit v0.0.14 (http://hannonlab.cshl.edu/fastx_toolkit/). Forward reads and reverse‐complement reads of each sample were then concatenated into a single file. Following Rochette and Catchen (2017) and Paris et al. (2017), we selected a subset of 20 samples (two from each sample locality) to test for the most appropriate value of M (number of mismatches allowed between stacks of reads within individuals) for our dataset in Stacks. We then ran the denovo_map pipeline in Stacks with the complete set of samples with m = 3, M = 5, n = M. Lastly, using the populations module of Stacks, we kept those SNPs that were present in at least two sample localities and at least half of the individuals of those sample localities (p = 2 and r = 0.5), and no minimum allele frequency threshold (default).
Genetic structure and diversity of Bolivian Parajubaea
2.4
To investigate the genetic structure among Parajubaea individuals we used two approaches. First, we applied a popular Bayesian, model‐based clustering method, STRUCTURE v2.3.4. (Falush et al., 2003, 2007; Pritchard et al., 2000). We ran STRUCTURE for the two Parajubaea species separately and combined. Since STRUCTURE can be sensitive to linked loci, we used a complete and a reduced de novo SNP set. The reduced SNP set included only the first SNP of each locus (option –write‐single‐snp in Stacks). We determined the number of genetic clusters (K) with default parameter settings and correlated allele frequencies. The linkage model proposed by Falush et al. (2003) was not designed to handle linkage disequilibrium between markers that are very tightly linked (Porras‐Hurtado et al., 2013), which is the case of SNPs, thus we used the admixture model in every analysis. Furthermore, since we wanted to compare the results produced with the complete and reduced SNP set, we chose to use the admixture model with both datasets to avoid introducing more variation. We ran analyses without a priori population information. All analyses consisted of 20 iterations for each value of K, and of 200,000 Markov Chain Monte Carlo (MCMC) generations after a 100,000‐generation burn‐in for each iteration. For the combined Parajubaea analysis we allowed K to vary from one (no population structure) to 10 genetic clusters (nine collection sites plus one). To explore genetic structure further, we ran analyses for each species separately, varying K from one to seven for P. torallyi, and from one to six for P. sunkha. We then used STRUCTURE HARVESTER v0.6.93 (Earl & vonHoldt, 2012) to collate the STRUCTURE results, explore different likelihood values across all Ks of all iterations, perform the 𝛥K test proposed by Evanno et al. (2005), and to prepare files for downstream steps. We aligned genetic clusters across iterations with CLUMPP v1.1.2 (Jakobsson & Rosenberg, 2007). Lastly, we produced bar plots representing the coefficient of membership of each individual to genetic clusters with DISTRUCT v1.1 (Rosenberg, 2004).
Second, using the complete de novo SNP set, we performed a Discriminant Analysis of Principal Components (DAPC) (Jombart et al., 2010) available in the package adegenet (Jombart, 2008) in R v4.0.3 (R Core Team, 2020), for the two Parajubaea species combined and for P. torallyi alone, testing the hypothesis that every collection site comprises a separate genetic group. Thus, we tested a K of eight for the two species together, and a K of five for P. torallyi. To optimize the number of principal components to retain, we carried out a cross‐validation test of 200 replicates with the xvalDapc function, which calculates the number of principal components attaining the lowest mean squared error. We included all Sucre individuals in STRUCTURE but not in the DAPC because we wanted to obtain an assignment score that would reveal the potential origin of those cultivated P. torallyi individuals in Bolivia. This DAPC detected a batch effect in our data (see Section 3 ‘Results’). To mitigate this batch effect we used a pseudo‐reference approach for SNP discovery to diminish reference biases that result from shorter single‐end reads (Lou & Therkildsen, 2022). We describe this method in detail in the supporting file.
To test for the effect of missing data on our results, we conducted eight DAPC analyses with four levels of missing data, with and without imputation. To this end, the R filter of the populations module of Stacks was applied to the pseudo reference SNP set to retain those SNPs that were present in at least 20%, 40%, 60% and 80% of the total number of Parajubaea samples irrespective of their collection site. Imputation of missing genotypes was carried out in GenoDive v.3.06 (Meirmans, 2020) and was based on the overall allele frequencies.
We performed a Mantel test to detect isolation by distance. We used the R package ade4 (Chessel et al., 2004) to measure the correlation between a matrix of pairwise F' _ ST _ values among the nine Parajubaea sample localities and their geographic distances. We estimated pairwise Weir and Cockerham's (1984) F' _ ST _ values with the package hierfstat v0.5.10 (Goudet, 2005) in R. We calculated pairwise geographic distances in kilometers with the Geographic Distance Matrix Generator (Ersts, 2011). The Mantel test used the Pearson coefficient and a default alpha value of 0.05.
Lastly, we reran the populations module in Stacks on the complete de novo SNP set to compute summary statistics and genetic diversity indexes for each genetic cluster. We therefore assigned individuals to each of the resulting genetic clusters (not sample sites). We kept the requisite for each locus to be present in at least two genetic clusters (p = 2), but reduced the proportion of individuals in a cluster that must have a given locus to 10% (r = 0.1) to avoid a large reduction in the number of SNPs. We estimated the observed (H _ O _) and expected heterozygosity (H _ E _), nucleotide polymorphism diversity, number of private alleles, and the inbreeding coefficient F IS. For pairs of genetic clusters, we estimated pairwise F' ST values as above. We tested the significance of our calculated pairwise values by comparing them to a null distribution created via 999 random permutations of our groups. Because of their cultivated nature, we decided to eliminate Sucre individuals from estimates of genetic diversity and pairwise F ST comparisons of genetic groups. We used this last genetic cluster‐based de novo SNP set (p = 2, r = 0.1) to conduct an analysis of molecular variance (AMOVA) implemented in GenoDive v3.06 to test the distribution of genetic variation within and among genetic clusters, using the infinite allele model and testing its significance with 999 permutations. Table S5 summarizes all SNP sets used in this study and the analyses conducted with each.
RESULTS
3
Phylogenetic relationships among the three Parajubaea species
3.1
Both ML and BI concatenated analyses recovered congruent topologies for Parajubaea and the outgroup (Figure 2). Parajubaea was monophyletic (1.0 PP, 100% bootstrap support (BS)). Parajubaea cocoides was monophyletic (1.0 PP, 100% BS) and was sister to a clade formed by all individuals of P. torallyi and P. sunkha. Contrary to our expectation, P. cocoides was not nested within the P. torallyi/P. sunkha clade (Figure 2). Interestingly, the individual collected from Tabaconas, Peru (P. cocoides PcoTa008), which some argue is a wild population, was sister to all other P. cocoides. Parajubaea torallyi and P. sunkha were each paraphyletic, but together formed a monophyletic group (0.99 PP, 100% BS). Within this P. torallyi/P. sunkha clade, there were two sister clades (0.94 PP, 75% BS and 0.86 PP, 38% BS, respectively) whose composition did not correspond to geographic location. In general, individuals from any given sample locality (e.g. Lajas, Palmarcito, Sauce Mayo) did not form a clade. Branch support values within the P. torallyi/P. sunkha clade were low to moderate in the ML tree (28%–72% BS) and moderate to high in the BI tree (0.55–0.99 PP).
Bayesian 50% majority rule consensus phylogram of 26 Parajubaea individuals and outgroup resulting from the analysis of five low‐copy nuclear WRKY loci (3753 bp). Values above the branches are the Bayesian posterior probabilities, and values below are the maximum likelihood bootstrap values. Maximum likelihood topology was identical to the Bayesian tree. Tips show species name and sample locality or number as in Table S2. Scale bar represents estimated substitutions per site. Photo of P. cocoides cultivated in Quito, Ecuador.
Genotyping‐by‐sequencing, filtering and SNP discovery
3.2
The single‐end GBS rendered close to 353.5 million reads of 25–239 bp. Around 21 million (5.9%) reads of that total did not match any barcode when no mismatches were allowed in Sabre. After trimming reads for quality and size, 82.45% of the input reads were retained, corresponding to an average of approximately 1.63 million reads per sample (0.26–4.63 million reads per sample, Figure S1a). The paired‐end GBS yielded over 105.5 million reads (approximately 52.8 million pairs) between 143 and 147 bp in length. Less than 1% of the total reads had no barcode match. When trimming the demultiplexed paired‐end sequences, none were discarded because all reads were longer than 90 bp and their average Phred score was always higher than 20. The paired‐end GBS produced an average of 3.91 million reads (1.95 million pairs of reads) per sample, with a range between 2.34 and 8.37 million reads per sample (Figure S1b). The Stacks pipeline allows checking for depth of coverage of each individual at two instances, namely after the ustacks and gstacks modules. We checked that all samples accomplished a depth of coverage of at least 20× in both instances, therefore all Parajubaea samples were kept for genotyping.
The complete de novo SNP set contained 15,134 SNPs, while the reduced SNP set (one SNP per locus) contained 4710 SNPs. A similar proportion of missing data was observed for the complete (90.4%) and the reduced (89.6%) SNP sets. The de novo SNP set obtained after grouping individuals by genetic cluster consisted of 2317 SNP and had 81.3% missing data.
Genetic structure and diversity of Bolivian Parajubaea
3.3
Comparison of the STRUCTURE results between the complete and reduced de novo SNP sets, for both Parajubaea species combined and across values of K, showed that all P. sunkha individuals form a genetic group (red in Figure S2); Ruditayoj, Lajas and Sucre formed another group (green in Figure S2). Differences between these two datasets appeared in the El Palmar site of P. torallyi, where a higher level of admixture was observed across values of K with the reduced SNP set. Another difference was present in the Sauce Mayo and Palmarcito sites of P. torallyi, for which we found a higher level of admixture across values of K with the complete SNP set. For K of 5, which was the best‐fit model for both species combined (Figure S3a), individuals in Sauce Mayo grouped in the same genetic cluster with El Palmar/Palmarcito in the reduced SNP set, while they appeared highly admixed in the complete SNP set (Figure S2).
When P. torallyi was analyzed alone, Ruditayoj, Lajas and Sucre formed a group (green in Figure S4) across K values both with the complete and the reduced SNP sets, as in the combined STRUCTURE analysis. Additionally, Sauce Mayo showed up as a distinct group towards the high end of the range of K with both sets. El Palmar and Ruditayoj individuals showed higher admixture with the reduced de novo SNP set. For K of 3, which was the best‐fit model for P. torallyi alone (Figure S3b), individuals in Sauce Mayo grouped in the same genetic cluster with El Palmar/Palmarcito with the reduced SNP set, whereas with the complete SNP set they grouped with Lajas/Ruditayo (Figure S4). When P. sunkha was analyzed alone, all individuals were highly admixed across values of K with both de novo SNP sets (Figure S5). Since we observed that the significant reduction of SNP data (15,134 vs. 4710 SNPs) prevented a higher differentiation of El Palmar individuals, and because most genetic clusters were the same, we decided to report below only the STRUCTURE results on the complete de novo SNP set (Figure 3) and dropped the reduced SNP set from further analyses (DAPC, AMOVA, F ST; Table S5). In addition, as stated before, the missing data between these two datasets were very similar.
Bar plots showing the genetic structure of both Parajubaea species in Bolivia estimated with STRUCTURE. Analyses using the complete set of 15,134 de novo SNPs for (a) both species combined and a K of 5, (b) for P. torallyi and a K of 3 and (c) for P. sunkha and a K of 2. Each vertical bar represents an individual and is colored by the proportion of its assignment to each genetic cluster. Sample localities are indicated at the bottom of the bar plots.
STRUCTURE analysis of the two species combined, at a K of five (Figure 3a), resulted in all P. sunkha individuals being assigned to a single cluster with a score of 80% or higher. We found more admixture in P. torallyi with 76 out of 146 individuals (52%) assigned to a single cluster (≥80% score). None of the individuals from Sauce Mayo, Palmarcito or Sucre achieved an assignment score of 80% or above. In each of the rest of P. torallyi's collection sites (El Palmar, Lajas and Ruditayoj) at least 50% of their individuals had an assignment score ≥80%.
When P. torallyi was assessed independently (Figure 3b), two major groups were evident, El Palmar and Palmarcito (in blue), which are geographically close to each other, and the remaining P. torallyi collection sites (in green, Figure 3b, Figure S4). These two major groups within P. torallyi were also revealed in the combined‐species STRUCTURE analysis (Figure 3a). Fifty‐seven per cent of P. torallyi individuals were assigned to one genetic cluster with a score ≥80%. Again, all individuals from Sauce Mayo and Sucre were admixed with assignment scores below 80%, but approximately over a third of the individuals of Palmarcito were assigned (score ≥ 80%) to the same group as El Palmar. In the rest of collection sites, most individuals (68% or higher) were assigned to one group. The seed origin of the cultivated individuals in Sucre probably was Sauce Mayo or Ruditayoj or Lajas due to Sucre's genetic assignment similarity with individuals from those collection sites.
In the analysis of P. sunkha alone, the log‐likelihood supported K of one as the best model, whereas ∆K achieved its greater value at K of two (Figure S3c). However, this last inference must be considered carefully since the Evanno test is not capable of comparing K of one to greater values. At K of 2, 26 individuals (54%) of the 48 P. sunkha samples showed assignment scores to one group. Since the analysis of P. sunkha alone showed great admixture among individuals (Figure S5), we treat them as a single genetic group. Altogether, the STRUCTURE analysis revealed three main genetic groups for Bolivian Parajubaea: (1) all individuals of P. sunkha, (2) P. torallyi individuals from El Palmar and Palmarcito and (3) P. torallyi individuals from Lajas, Ruditayoj, Sucre and Sauce Mayo.
For the DAPC analysis of the two species combined, we retained 61 principal components, as they achieved the lowest mean squared error. The first and second discriminant functions accounted for almost 70% of the total variation. Individuals clustered roughly into three genetic groups as in the STRUCTURE analysis (Figure 4). Admixed individuals in grey (assignment scores < 80%) were mostly from the Sauce Mayo and Palmarcito sites (Figure 4, Figure S6a). The third discriminant function accounted for 13% of the variation and separated Sauce Mayo from the other sample sites (Figure S6b). Sunkha individuals did not segregate by sample site (Figure S6a,b). When evaluating P. torallyi alone, the first two discriminant functions explained 84% of the total variation. This ordination distinguished the two P. torallyi genetic groups inferred from STRUCTURE and also distinguished all P. torallyi sample sites except for Ruditayoj and Lajas (Figure S6c,d).
Plots of the discriminant analysis of principal components (DAPC) using the complete set of 15,134 de novo SNPs obtained from genotyping‐by‐sequencing. The percentage of variance explained by each discriminant function appears on the x and y axes. Individuals are colored according to their genetic group assignment (score ≥ 0.80) from the STRUCTURE analysis. Individuals in grey are admixed, attaining an assignment score lower than 0.80 for any of the genetic groups. A) both Parajubaea species combined. B) P. torallyi alone.
We observed a tight clustering and distance of Palmarcito individuals from the other P. torallyi sites revealing a batch effect due to read type (paired‐end vs single‐end). To mitigate this batch effect, we conducted a DAPC using the pseudo reference SNP set, whereby the big separation of Palmarcito individuals was no longer visible and the same three genetic clusters recovered in the de novo DAPC were more clearly separated (Figure 4, Figure S7). Furthermore, the R parameter in Stacks rendered datasets with different numbers of SNPs and levels of missing data ranging from 2437 SNPs with 15.10% of missing data to 19,087 SNPs with 52.71% missing data (Table S6). Applying imputation of missing genotypes did not alter fundamentally the distribution or grouping of the individuals in the DAPC analysis, being the most notable difference that individuals of Palmarcito were more spread out when imputation of missing data was performed than when it was not. Notably, all eight DAPCs (Figure S7) showed the same results of three genetic clusters towards the edges and the highly admixed individuals of Sauce Mayo and Palmarcito grouped in the center, demonstrating that different levels of missing data do not change our results. Since all the DAPC and STRUCTURE results were highly concordant, we are confident about the recognition of the three main genetic clusters.
The Mantel test showed a significant positive correlation between sample locality genetic differentiation and their geographic distances (R = 0.349, p‐value = 0.025, Table S7), suggesting the presence of isolation by geographic distance. When comparing the genetic groups, Lajas/Ruditayoj/Sauce Mayo showed the most private alleles (768) and the highest nucleotide diversity (0.204), while the Sunkha group showed the least private alleles (143) and lowest nucleotide diversity (0.146, Table 2). H _ O _ and H _ E _ were very close (values overlapped when taking into account the standard error) in the two P. torallyi genetic groups, meeting the neutral expectation of allele frequencies consistent with Hardy Weinberg equilibrium (Table 2). In the Sunkha group, however, H _ O _ was higher than H _ E _ which means there was an excess in heterozygosity suggesting an excess in outbreeding or an isolate‐breaking effect (i.e. crossing between genetically differentiated populations). Inbreeding coefficients were positive but close to zero for the two P. torallyi genetic groups, meeting the neutral expectation (Table 2). Only Sunkha had a negative F IS, corroborating the excess in outbreeding in this genetic group. F ST values showed low to moderate differentiation between genetic groups suggesting high to moderate gene flow amongst them. The highest F ST was between Lajas/Ruditayoj/Sauce Mayo and Sunkha (0.0856), while the lowest F ST was between Lajas/Ruditayoj/Sauce Mayo and El Palmar/Palmarcito (0.0761) (Table 3).
TABLE 3: Pairwise F ST values among the three genetic groups of Parajubaea in Bolivia recommended as management units.
Analysis of molecular variance using the genetic‐cluster‐based de novo SNP set revealed that the variation within individuals accounted for 86.5%, while the variation among individuals within genetic clusters and among genetic clusters represented 0 and 13.5%, of the total variation, respectively (Table 4). The F ST estimate for the differentiation among genetic clusters was 0.164.
DISCUSSION
4
Non‐timber forest products are exploited worldwide and are of paramount importance to local economies. Thus, a characterization of the evolutionary history, population structure and genetic diversity of natural populations can assist the conservation and sustainable harvest of such products. Our phylogenetic analysis does not support the hypothesis that P. cocoides originated from extant wild Bolivian populations. GBS data support the recognition of a single Bolivian species and the hypothesis of low genetic diversity for narrow endemic species such as Parajubaea. We found a genetic structure shaped by distance, but no inbreeding signal which was unexpected. We showed the presence of three genetic clusters which we use to propose three management units, as well as in situ and ex situ conservation strategies.
Taxonomic status and evolutionary relationships
4.1
Multiple lines of evidence challenge the current taxonomy of recognizing two morphology‐based Bolivian species; instead, they support a population‐level differentiation within a single species. First, the estimates of F ST among genetic clusters are weak and more indicative of intraspecific variation. Second, the number of private alleles for P. sunkha is smaller (143) than the number of private alleles for any of the other two genetic clusters in P. torallyi (438 and 768). Lastly, the DAPC indicates as much genetic differentiation between the P. torallyi sampling sites as observed between the two putative species.
GBS applied to two closely related North American palm genera also rejected the taxonomic recognition of the two morphologically defined Washingtonia species, and supported the recognition of two instead of three Brahea species (Klimova et al., 2018). GBS was also useful in delimiting species in the Neotropical palm genus Acrocomia, reducing the number of species to four (Díaz et al., 2021). Altogether, these results support the hypothesis that many traditional morphological characters used to distinguish palm species (e.g. Table S1) do not have phylogenetic signals or are plastic (Roncal et al., 2012).
The phylogenetic relationships did not support the hypothesis that P. cocoides originated from extant wild Bolivian populations, instead, it seems that P. cocoides evolved as an independent species that later became cultivated leaving no wild individuals. Also, domesticated crop species like Dioscorea alata (yam) have no wild populations, and no clearly identified closest wild relative (Sharif et al., 2020; Table 1). Some genetic studies of domesticated palms have provided insights into their origins and relationships with wild relatives (e.g. Clement et al., 2017; Díaz et al., 2021; Gros‐Balthazard et al., 2017; Gunn et al., 2011; Pérez‐Escobar et al., 2021). For example, the incipiently domesticated Acrocomia aculeata used for biodiesel oil has a higher genetic diversity in Brazil, suggesting the species' origin in this area, but has an unknown sister species (Díaz et al., 2021; Table 1). The evolution of Phoenix dactylifera's genome (date palm) was influenced by introgression with two wild relatives (Phoenix theophrasti and P. sylvestris) approximately 2100 years ago, highlighting the ancient hybrid origin of the date palm (Pérez‐Escobar et al., 2021). The amount of admixture, if any, between Parajubaea cocoides and the extant wild Bolivian species remains unknown, and we acknowledge that the use of five nuclear loci may not fully represent the potential evolutionary history of the genus.
Genetic structure and diversity
4.2
We found a pattern of genetic structure influenced by distance, which may be explained by the biotic agents involved in the genetic exchange between Parajubaea populations. Bees (Apis mellifera, Trigona sp.), wasps (Agelaia multiplicata, Eumenes sp.) and flies (Volucella sp., Eristalis sp., Syrphus sp.) have been reported to transport pollen of these palms (Guerra et al., 1997; Moraes & Henderson, 1990), but may fail to do so over long distances (Araújo et al., 2004; Beekman & Ratnieks, 2000; Prezoto & Gobbi, 2005). Similarly, rodents have been documented as potential seed dispersers (Vargas, 1994), but it is unlikely for such small mammals to carry the relatively large Parajubaea seeds over tens or hundreds of kilometers. The Andean spectacled bear (Tremarctus ornatus), a large mammal capable of traversing long distances, has been seen feeding on P. torallyi fruits (Anibarro, 1994), but seed dispersal by the Andean bear is anecdotal.
H _ O _ in the three genetic clusters is lower than in other Neotropical palms sources of non‐timber forest products with notably wider distributions like Euterpe edulis (0.62–0.79, Gaiotto et al., 2003) and Oenocarpus bataua var. bataua (0.47–0.88, Escobar et al., 2018). H _ O _ is also lower than in other IUCN vulnerable palms like Pseudophoenix sargentii and P. vinifera (0.15–0.44 and 0.45–0.55, respectively, Rodríguez‐Peña et al., 2014), and Ceroxylon quindiuense (0.436–0.569, Sanín et al., 2017; 0.59–0.62, Chacón‐Vargas et al., 2020). However, H _ O _ for the Bolivian Parajubaea palms is close to the lower end of values found in populations of IUCN critically endangered palms with restricted distribution, such as Pseudophoenix lediniana (0.25) and P. ekmanii (0.20–0.29) (Rodríguez‐Peña et al., 2014), Coccothrinax jimenezii (0.294–0.342, Jestrow et al., 2016) and Tahina spectabilis (0.01–0.25, Shapcott et al., 2020).
The negative and close‐to‐zero inbreeding coefficients indicated no risk of inbreeding depression. This is uncommon in studies of wild populations of endangered palms (Jestrow et al., 2016; Namoff et al., 2011; Rodríguez‐Peña et al., 2014; Shapcott et al., 2020), and even for palms of no conservation concern (Cibrián‐Jaramillo et al., 2009; Escobar et al., 2018; Gaiotto et al., 2003; Luna et al., 2007), which, with few exceptions, report positive F IS values. The avoidance of inbreeding in Parajubaea could be explained because these palms are protandrous which prevents self‐fertilization (Moraes & Henderson, 1990), the large suite of pollinators described above could enhance their crossbreeding capacity, and because many wild stand sizes are large consisting of hundreds to thousands of individuals. Parajubaea, therefore, is among the endangered plant species (e.g. Dalapicolla et al., 2021; Rodríguez‐Rodríguez et al., 2022), and self‐incompatible dioecious or monoecious plants (e.g. Allendorf & Luikart, 2007; Balloux, 2004) that exhibit heterozygosity excess. We cannot rule out the possibility of local adaptation or drift among populations followed by secondary contact to explain the heterozygosity excess.
Methodological considerations
4.3
It is known that GBS can result in a relatively high proportion of missing data (Heffelfinger et al., 2014; Perea et al., 2016; Wallace & Mitchell, 2017), and our study agrees with this tendency. Early simulations and in silico studies cautioned against the potential underestimation of genomic polymorphism due to the presence of missing data caused by allele dropout in reduced representation sequencing (Arnold et al., 2013; Gautier et al., 2012; Luca et al., 2011). Reduced nucleotide diversity (Luca et al., 2011), inflated H _ E _ and F ST estimates (Gautier et al., 2012), and other summary statistics were inaccurately calculated from loci with missing data (Arnold et al., 2013). For this reason, many studies discard loci and/or individuals that contain high proportions (>15%) of missing data (e.g. Ackiss et al., 2020; Dupuis et al., 2018; Lah et al., 2016). However, some empirical evidence has demonstrated that allowing for substantial missing data recovers a higher number of loci, and thus more power for population assignment inference than a more conservative approach (Chattopadhyay et al., 2014). Also, different data completion levels showed little impact on most genetic summary statistics (Shafer et al., 2017) and on the identity of genetic groups or subspecies recovered (our study, Featherstone & McGaughran, 2024). Hodel et al. (2017) showed that as missing data increased, so did heterozygosity and F ST estimates, albeit in a less pronounced manner than anticipated by simulations. We strived to achieve a compromise between a large number of markers to compensate for the pervasive missing data, and the increased computational demand resulting from the analysis of large datasets. Contrary to Chattopadhyay et al. (2014), who found that large amounts of missing data (90%) obliterated any intermediate ancestry coefficient, our analysis revealed highly admixed individuals despite the high percentage of missing data. In Li and Latch (2021), different percentages of total missing data did not impact genetic structure but non‐random missingness did, whereby samples with high missing data were indistinguishable from truly admixed individuals appearing at the center of a plot. Consistent with expectations, and cross‐validated by the STRUCTURE results, we found highly admixed individuals (Sauce Mayo, Palmarcito) at the center of the DAPC plot irrespective of the amount of missing data (from 15% to 53%) (Figure S7).
Another methodological consideration of restriction site‐associated DNA sequencing (RADSeq) protocols like GBS is their limited transferability. Unlike markers that can be transferred across taxa with relative ease such as SSR (e.g. in palms; Billotte et al., 2004) or target‐capture probes (e.g. in palms; de La Harpe et al., 2019), the exact same SNP set obtained through GBS cannot be recovered with another taxon sampling or sequencing batch, particularly when produced de novo. Since RADSeq relies on the conservation of restriction sites among individuals, polymorphism in or the lack of the restriction enzyme cutting site leads to allele dropout (Andrews et al., 2016). Stochastic processes can cause one allele to amplify more than the other allele at a given locus (PCR duplicates, Schweyen et al., 2014). Differential GC content in the restriction fragments causes preferential PCR amplification of loci with high GC content (Benjamini & Speed, 2012). Additionally, the number of loci recovered will depend on the genome size of the taxa involved. All these issues may result in biases in the measurement of genetic variation (Andrews et al., 2016; Davey et al., 2013; Puritz et al., 2014). For these reasons, RADSeq is more appropriate for the intraspecific level or for species of shallow divergence (Harvey et al., 2016). For instance, in a population‐level RADseq study that involved four species of two sister avian genera, only about 0.3%–0.8% of all loci inferred de novo overlapped across all four species (McCormack et al., 2012). Contrastingly, population‐level target‐capture loci attained an average of 92% loci overlap across 40 species of birds spanning 14 families (Harvey et al., 2016). In our GBS study, since P. sunkha and P. torallyi were found conspecific, we obtained a high percentage of loci overlap (82.4%) between the two when individuals were assigned to their respective genetic clusters.
Conservation units
4.4
Among the different types of conservation units in the literature, management units are the most used. Management units are conceived as populations or groups of populations that reflect current demographic independence, regardless of the approach used to delineate them, and they do not necessarily imply phylogenetic divergence (Funk et al., 2012; Palsbøll et al., 2007). Based on our resulting genetic groups, we propose to treat all P. sunkha individuals as one management unit and to split P. torallyi into two management units: El Palmar/Palmarcito and Lajas/Ruditayoj/Sauce Mayo. These two latter management units represent two metapopulations, one located in the north of the department of Chuquisaca and the other in the center of it and in the eastern part of the Potosí department (Figure 1). These two metapopulations differ in geological conditions but not morphologically. The center has an older geological formation, with extensive Silurian to Devonian rock substrates, and palms are usually found in ravines or in organic matter adjacent to the rocks (Jiménez et al., 2009; Moretti et al., 2002). The metapopulation in the north grows in younger, Triassic, Jurassic and Cretaceous substrates (Carretero et al., 2011).
In situ and ex situ conservation
4.5
Actions need to be implemented to ensure the in situ conservation of Parajubaea in its natural habitat. For the two P. torallyi management units, only the wild stand at El Palmar occurs within the national system of protected areas in Bolivia. Based on our genomic evidence, we have proposed the municipal council of Ckochas to designate a protected area in the Lajas zone. We have also contacted the municipality of El Villar, through the National Herbarium of Bolivia, to create a protected area for Sauce Mayo.
Parajubaea sunkha was evaluated in the Red Book of Andean Plants of Bolivia as threatened (EN; Moraes et al., 2012). Harvesting practices are unsustainable for adult individuals and producers are not organized for fibre extraction. There has also been a mix of socioeconomic activities in the same territory and a reduction in the levels of natural regeneration of the Sunkha genetic group (Moraes, 2011). Decades ago, eight confirmed wild stands existed (Vargas, 1994), within an area of occupancy of barely 56 km^2^ (Enssle, 2006). Most of those stands consisted of a few adults, except for Mataralcito, where individuals can be counted by the hundreds, and thus account for about 70% of this particular genetic group (Enssle et al., 2006). There is one in situ protected area for the Sunkha genetic group, the Río Grande Valles Cruceños Integrated Management Natural Area, with 734,000 ha that includes only a fraction of the distribution of this management unit. Therefore, we strongly recommend that the in situ protection of Mataralcito and adjacent stands (Figure 1) must be considered as a priority and urgent. Parajubaea is an emblematic palm that appears in the Bolivian coat of arms representing the country's plant diversity; this is an advantage when proposing protected areas to the government.
Article 9 of the Convention on Biological Diversity states the role of ex situ conservation for the purpose of complementing in situ measures (Convention on Biological Diversity (CBD), 1992). Currently, there is fragmented evidence on the real success of ex situ management in preventing species from going extinct, recovering depleted populations or maintaining their viability (Gant et al., 2021). However, in many cases, within the country, ex situ facilities like nurseries contain unique genetic diversity and may represent the best source to provide propagules for species recovery (e.g. Asmussen‐Lange et al., 2011). In 2021, at the National Herbarium of Bolivia, an ex situ germplasm collection of Parajubaea was created by installing several germination experiments with hundreds of seeds from El Palmar and Ruditayoj sites, representing two of the three proposed management units. We thus recommend augmenting this ex situ collection with seeds from the Sunkha management unit, following the recommendations of Namoff et al. (2010), who suggested that the optimal sampling for ex situ conservation that captures most allelic variation is 15 individuals per management unit. However, due to the low germination success of palm seeds, we suggest collecting at least double this amount, if possible, in the hundreds as mentioned above. The seedlings will be used for reintroductions or augmentations if wild populations face a rapid decline, thus this ex situ collection will act as an insurance.
CONCLUSION
5
The hypothesis that the P. cocoides cultigen originated from extant wild Bolivian populations was not supported. Furthermore, our DNA sequencing data challenged the taxonomic recognition of P. sunkha and P. torallyi as two separate endemic palm species of Bolivia. The low genetic diversity of these emblematic palms is shaped by geographic distance and consists of at least three genetic clusters which we recommend treating as separate management units. Endangered species sources of non‐timber forest products, such as Parajubaea, deserve funding priority for extensive genome sequencing that will reveal their intraspecific variation, evolutionary history, and genes under selection, so that we can prevent their extinction in the near future.
CONFLICT OF INTEREST STATEMENT
The authors declare no conflict of interest to this work.
Supporting information
Appendix S1.‐S2.
The reference list from the paper itself. Each links out to its DOI / PubMed record.
- 1Abed, A. , Légaré, G. , Pomerleau, S. , St‐Cyr, J. , Boyle, B. , & Belzile, F. (2019). Genotyping‐by‐sequencing on the ion torrent platform in barley: Methods and protocols. In W. Hardwood (Ed.), Methods in molecular biology (pp. 233–252). Humana Press.10.1007/978-1-4939-8944-7_1530460569 · doi ↗ · pubmed ↗
- 2Ackiss, A. S. , Larson, W. A. , & Stott, W. (2020). Genotyping‐by‐sequencing illuminates high levels of divergence among sympatric forms of coregonines in the Laurentian Great Lakes. Evolutionary Applications, 13(5), 1037–1054. 10.1111/eva.12919 32431751 PMC 7232772 · doi ↗ · pubmed ↗
- 3Allendorf, F. W. , & Luikart, G. (2007). Conservation and the genetics of populations. Blackwell Publishing.
- 4Andrews, K. R. , Good, J. M. , Miller, M. R. , Luikart, G. , & Hohenlohe, P. A. (2016). Harnessing the power of RA Dseq for ecological and evolutionary genomics. Nature Reviews Genetics, 17, 81–92. 10.1038/nrg.2015.28 PMC 482302126729255 · doi ↗ · pubmed ↗
- 5Andrews, S. (2010). Fast QC: a quality control tool for high throughput sequence data . http://www.bioinformatics.babraham.ac.uk/projects/fastqc
- 6Anibarro, G. (1994). Diagnóstico de potencialidades del bosque de palmeras en los cantones Pasopaya y Rodeo del municipio Presto . ACLO‐Chuquisaca, Sucre. Internal report.
- 7Antonelli, A. , Zizka, A. , Antunes Carvalho, F. , Scharn, R. , Bacon, C. D. , Silvestro, D. , & Condamine, F. L. (2018). Amazonia is the primary source of Neotropical biodiversity. Proceedings of the National Academy of Sciences of the United States of America, 115(23), 6034–6039. 10.1073/pnas.1713819115 29760058 PMC 6003360 · doi ↗ · pubmed ↗
- 8Araújo, E. D. , Costa, M. , Chaud‐Netto, J. , & Fowler, H. G. (2004). Body size and flight distance in stingless bees (Hymenoptera: Meliponini): Inference of flight range and possible ecological implications. Brazilian Journal of Biology, 64(3b), 563–568. 10.1590/S 1519-69842004000400003 15619994 · doi ↗ · pubmed ↗