Unravelling habituation for COVID-19-related information: A panel data study in Japan
Shinya Fukui

TL;DR
This study explores how people in Japan gradually became less responsive to COVID-19 information over time, affecting their mobility patterns.
Contribution
The paper introduces a novel analysis of habituation to pandemic-related information using panel data from Japanese prefectures.
Findings
Human mobility decreased by 1.09 percentage points in response to a 1% increase in infected cases during the first wave.
Habituation led to smaller mobility decreases in later waves, with 0.71 and 0.29 percentage point decreases in the second and third waves.
Spatial spillovers of infection information were observed, but not for emergency declarations or vaccination efforts.
Abstract
This study examines people’s habituation to COVID-19-related information over almost three years. Using publicly available data from 47 Japanese prefectures, I analyse how human mobility responded to COVID-19-related information, such as the number of COVID-19-infected cases, the declaration of a state of emergency (DSE), and several doses of vaccine using an interactive effects model, which is a type of panel data regression. The results show that Japanese citizens were generally fearful and cautious during the first wave of the unknown infection. As such, a 1% week-on-week increase in the number of infected cases results in a decrease in human mobility by 1.09-percentage-point (pp) week-on-week. However, they gradually became habituated to similar infection information during the subsequent waves, which is reflected in 0.71 pp and 0.29 pp decreases in human mobility in the second and…
Genes, proteins, chemicals, diseases, species, mutations and cell lines named across the full text — each resolved to its canonical identifier and authoritative record.
Click any figure to enlarge with its caption.
 Figure 1
 Figure 2
 Figure 3
 Figure 4
 Figure 5
 Figure 6
 Figure 7
 Figure 8
 Figure 9
 Figure 10
 Figure 11
 Figure 12
 Figure 13
 Figure 14
 Figure 15
 Figure 16
 Figure 17
 Figure 18
 Figure 19
 Figure 20
 Figure 21
 Figure 22
 Figure 23
 Figure 24
 Figure 25
 Figure 26
 Figure 27
 Figure 28
 Figure 29
 Figure 30
 Figure 31
 Figure 32
 Figure 33
 Figure 34
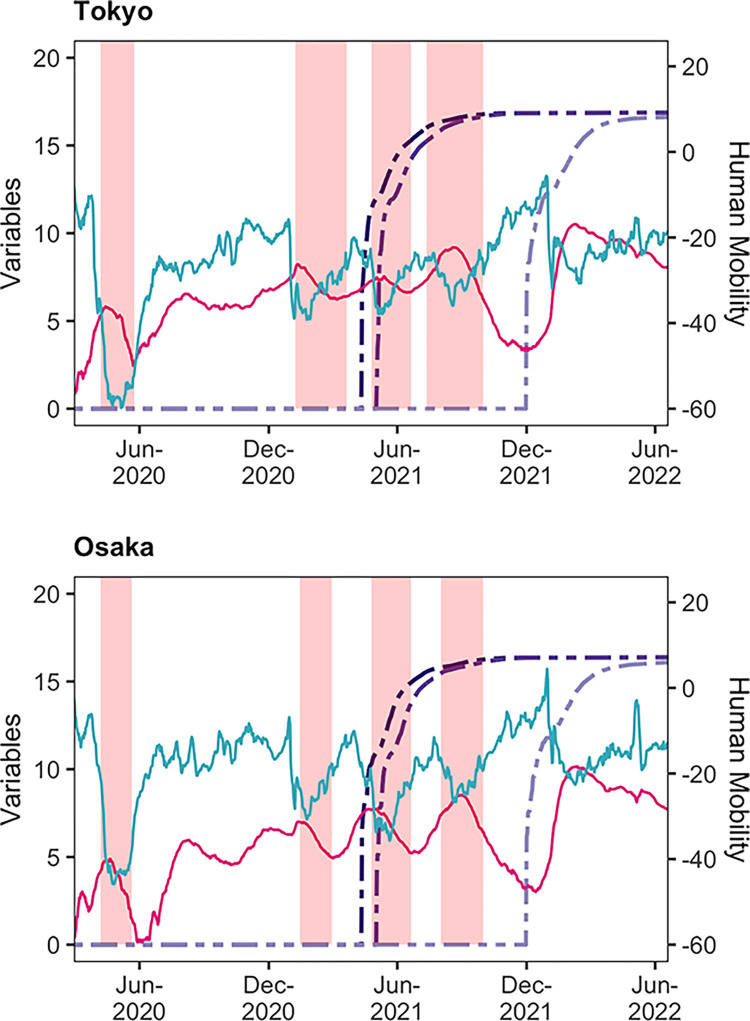 Figure 35
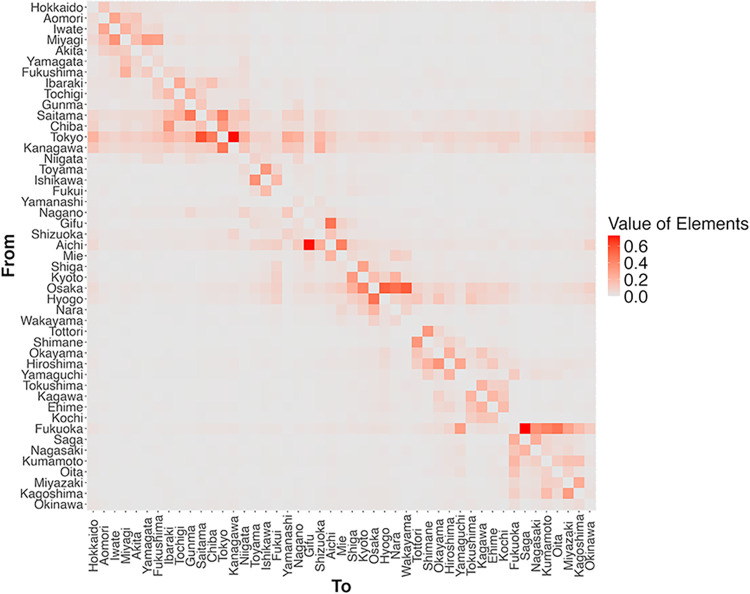 Figure 36
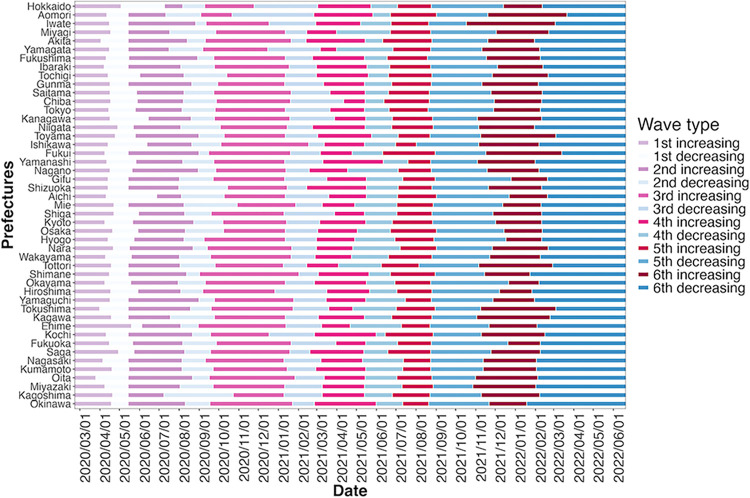 Figure 37
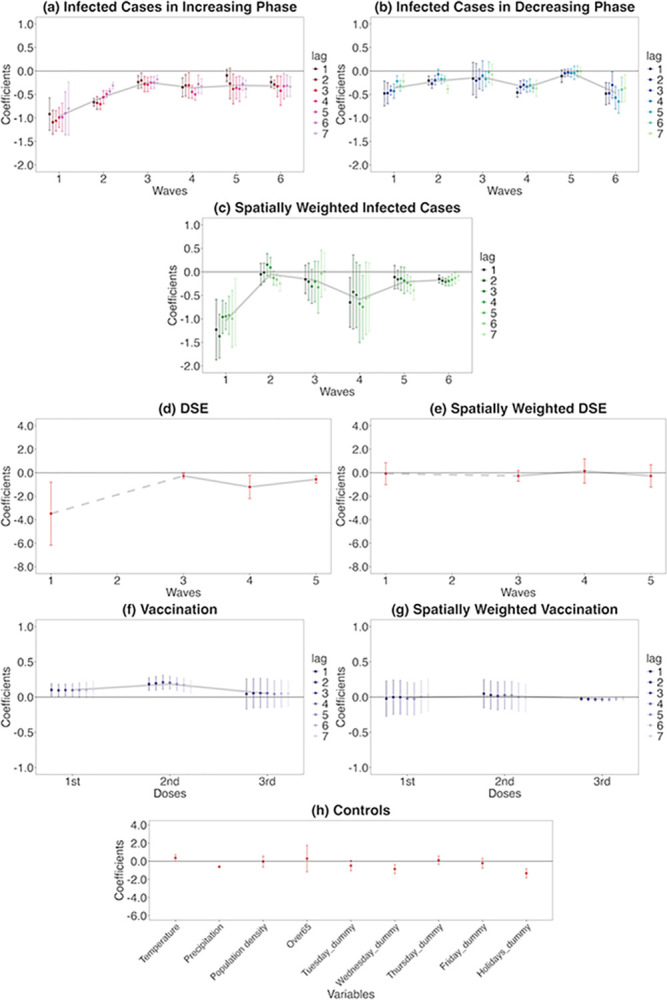 Figure 38
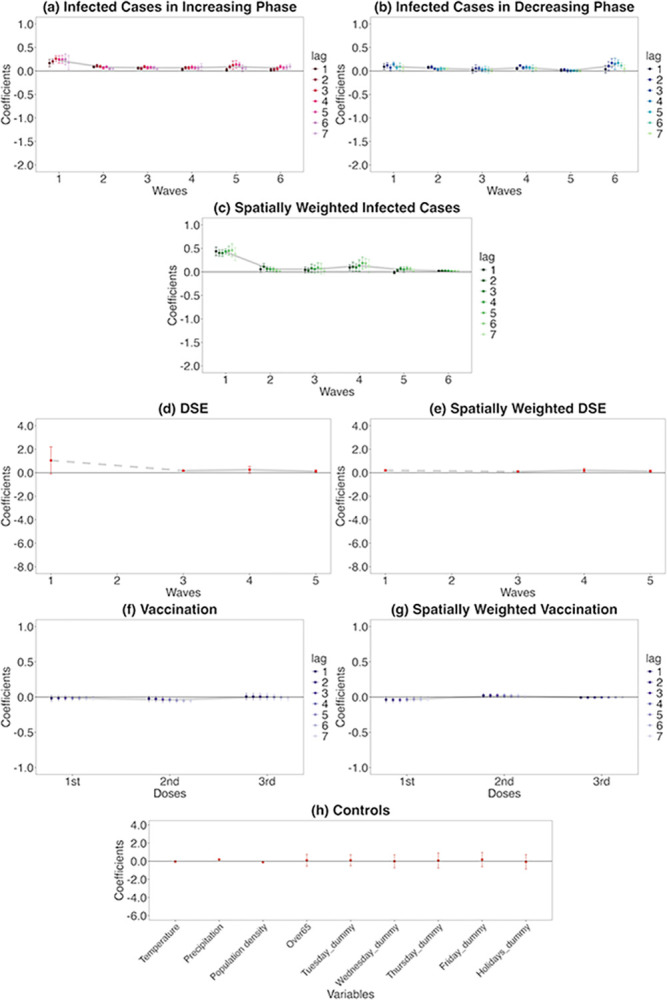 Figure 39
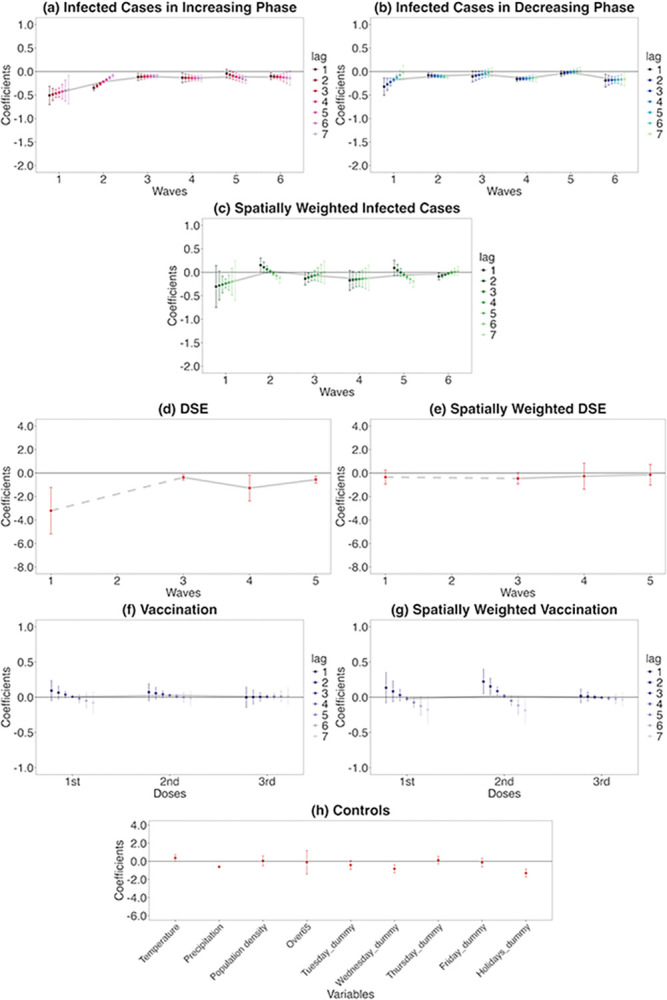 Figure 40
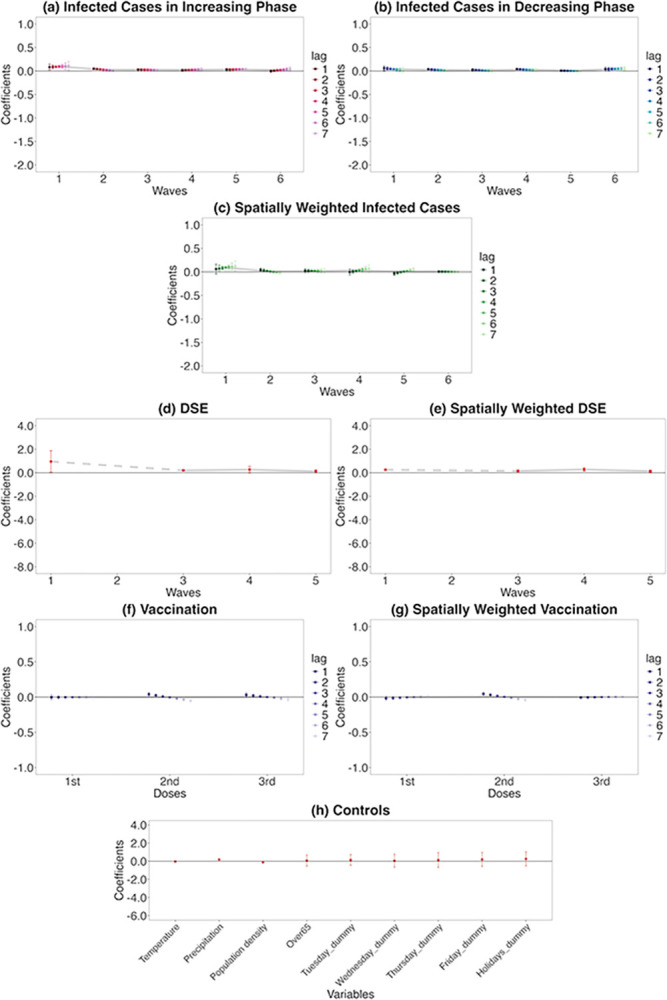 Figure 41
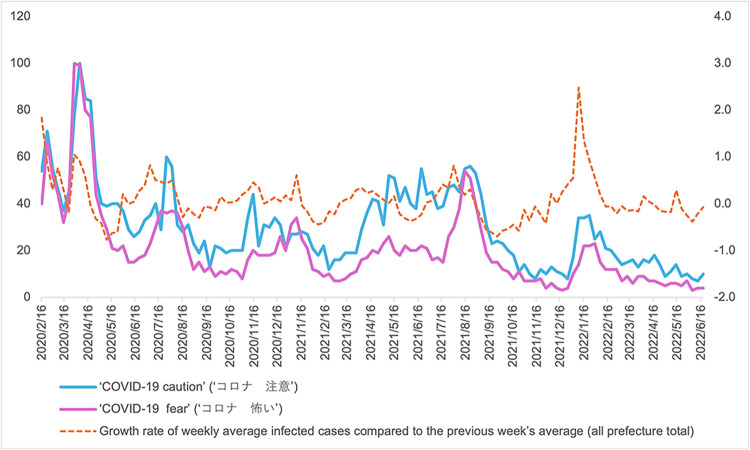 Figure 42
 Figure 43
 Figure 44
Peer Reviews
No public reviews on file for this paper yet. If you reviewed it on a platform where reviews are public (OpenReview, ICLR, NeurIPS, ICML), you can paste yours below so the community can read it here.
Videos
No videos yet. Explain this paper in a talk, walkthrough, or lecture? Add one.
Taxonomy
TopicsCOVID-19 epidemiological studies · COVID-19 Pandemic Impacts · Urban, Neighborhood, and Segregation Studies