New clusterization of global seaport countries based on their DEA and FDEA network efficiency scores
Dineswary Nadarajan, Elayaraja Aruchunan, Noor Fadiya Mohd Noor, Sudipta Chowdhury, Sudipta Chowdhury, Sudipta Chowdhury

TL;DR
This paper clusters 133 countries by seaport network efficiency using DEA and FDEA scores, revealing four distinct connectivity groups.
Contribution
The study introduces hkmeans clustering for seaport network efficiency, creating new connectivity clusters (LC, MC, HC, VHC).
Findings
hkmeans clustering is shown to be consistent and practical for grouping seaport efficiency data.
24, 47, 40, and 22 countries were classified into low, medium, high, and very high connectivity clusters, respectively.
The method works effectively with both fuzzy and non-fuzzy datasets.
Abstract
Global seaport network efficiency can be measured using the Liner Shipping Connectivity Index (LSCI) with Gross Domestic Product. This paper utilizes k-means and hierarchical strategies by leveraging the results obtained from Data Envelopment Analysis (DEA) and Fuzzy Data Envelopment Analysis (FDEA) to cluster 133 countries based on their seaport network efficiency scores. Previous studies have explored hkmeans clustering for traffic, maritime transportation management, swarm optimization, vessel trajectory prediction, vessels behaviours, vehicular ad hoc network etc. However, there remains a notable absence of clustering research specifically addressing the efficiency of global seaport networks. This research proposed hkmeans as the best strategy for the seaport network efficiency clustering where our four newly founded clusters; low connectivity (LC), medium connectivity (MC), high…
Genes, proteins, chemicals, diseases, species, mutations and cell lines named across the full text — each resolved to its canonical identifier and authoritative record.
Click any figure to enlarge with its caption.
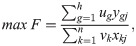 Figure 1
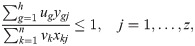 Figure 2
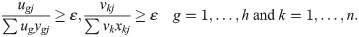 Figure 3
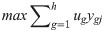 Figure 4
 Figure 5
 Figure 6
 Figure 7
 Figure 8
 Figure 9
 Figure 10
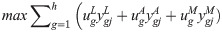 Figure 11
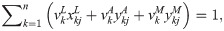 Figure 12
 Figure 13
 Figure 14
 Figure 15
 Figure 16
 Figure 17
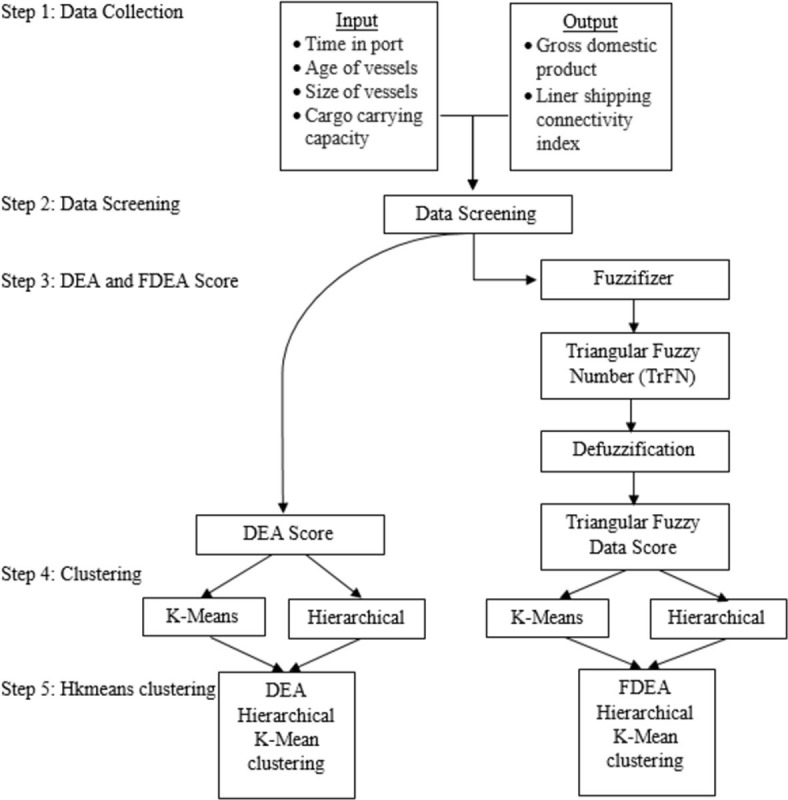 Figure 18
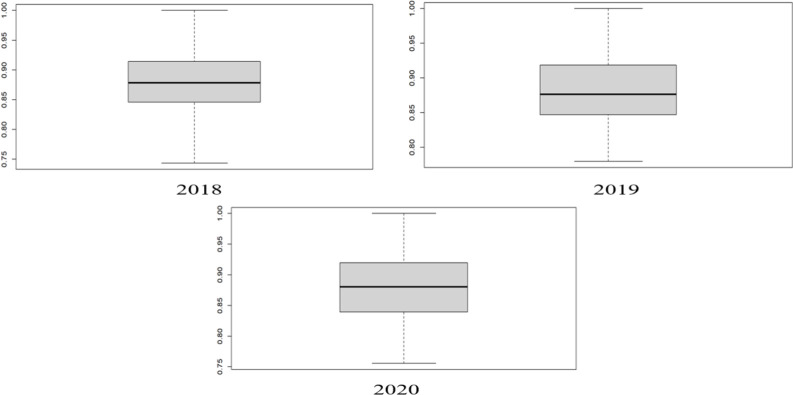 Figure 19
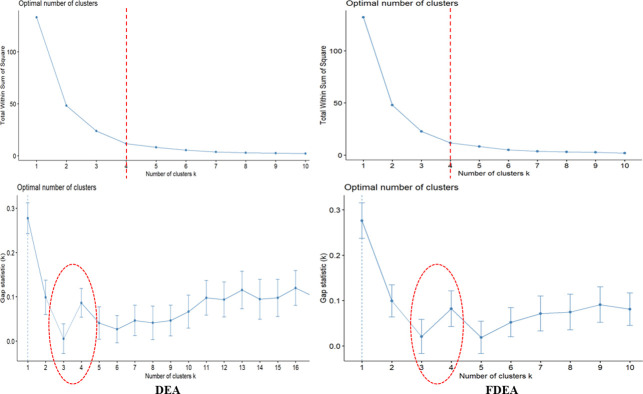 Figure 20
 Figure 21
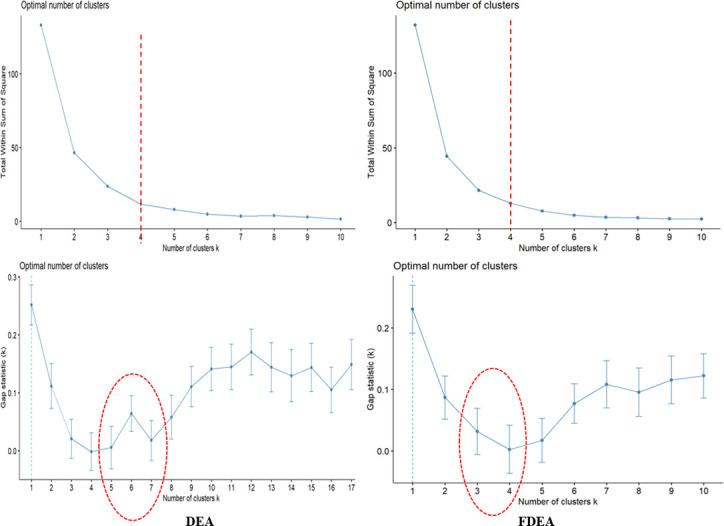 Figure 22
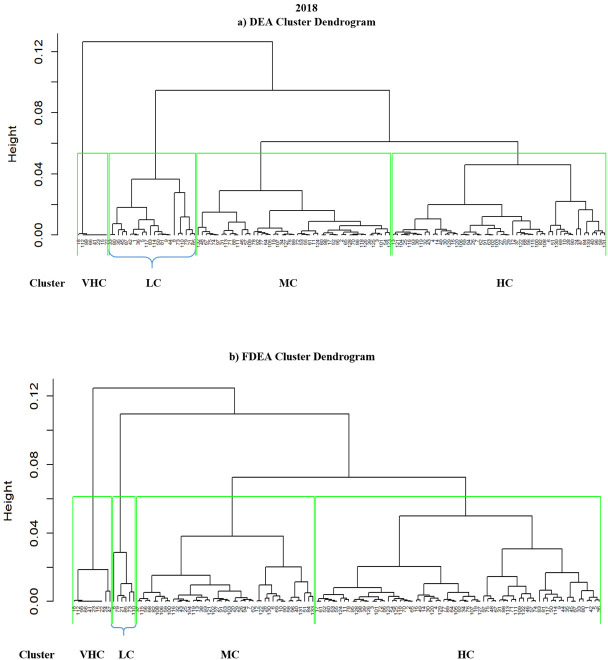 Figure 23
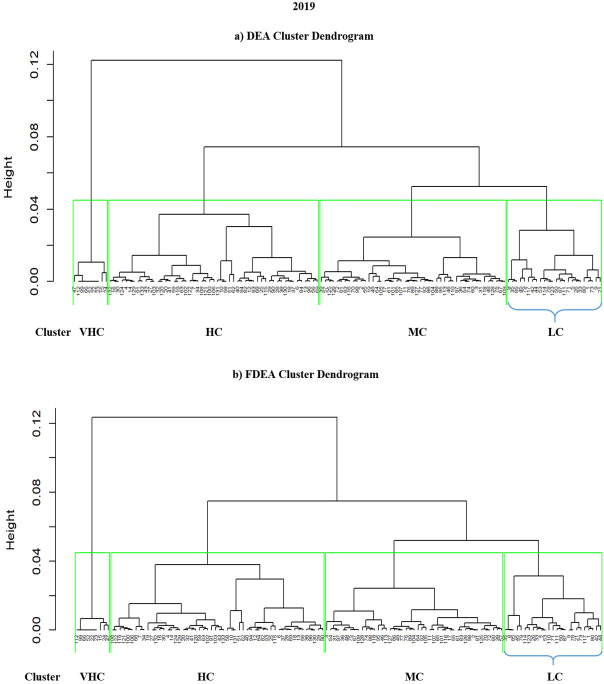 Figure 24
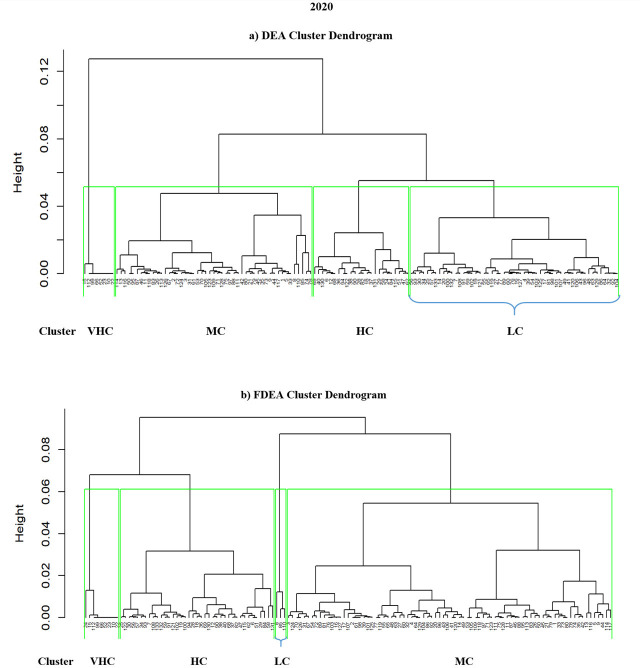 Figure 25
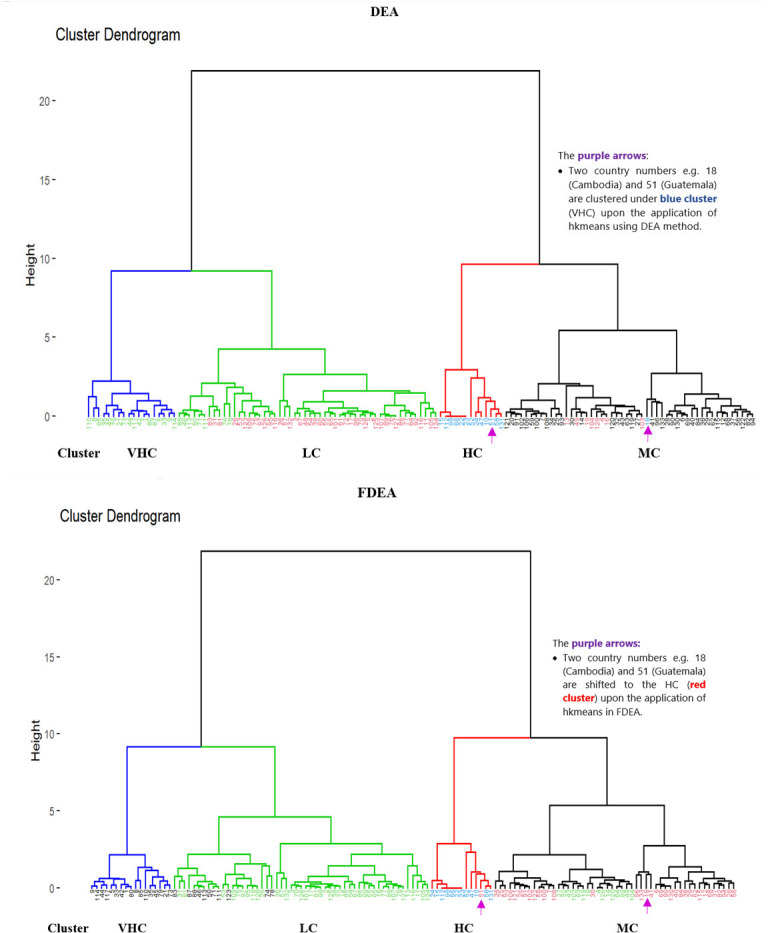 Figure 26
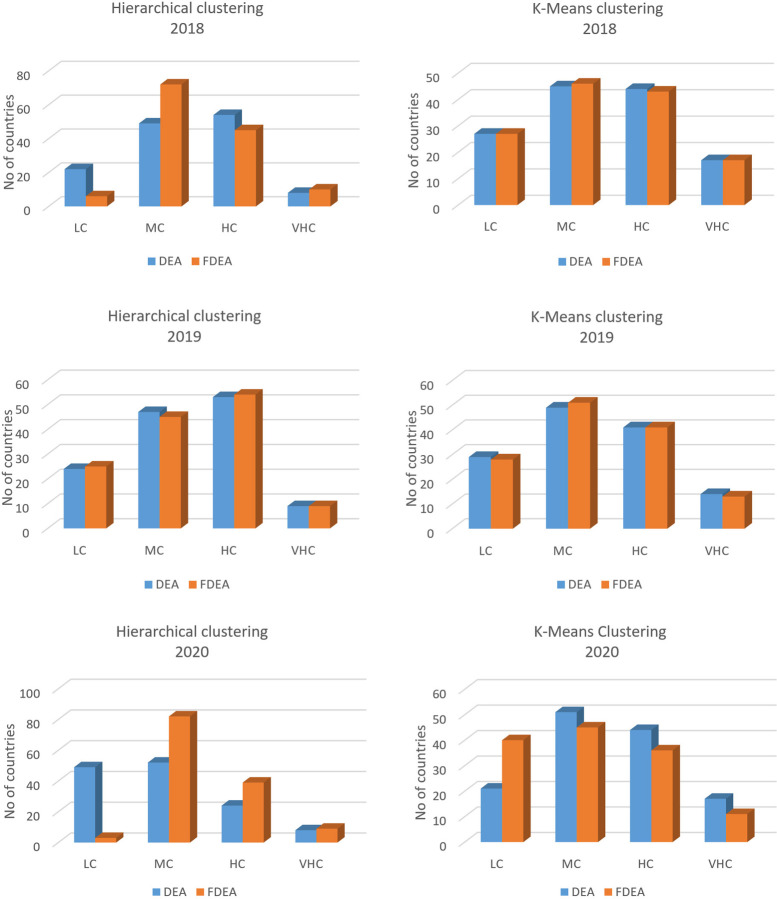 Figure 27
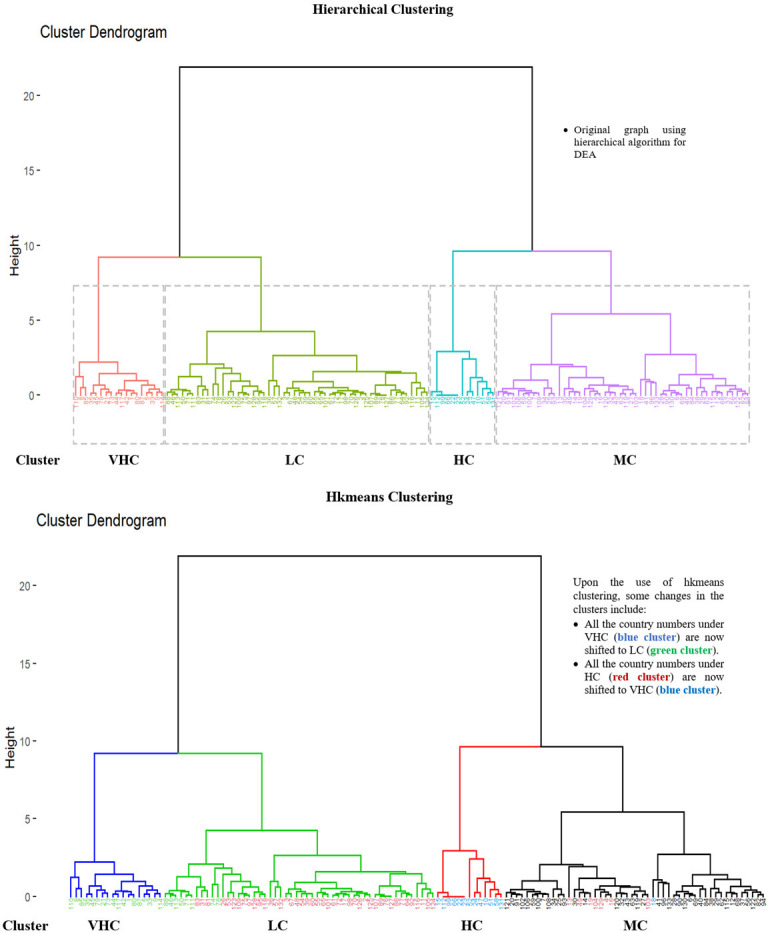 Figure 28
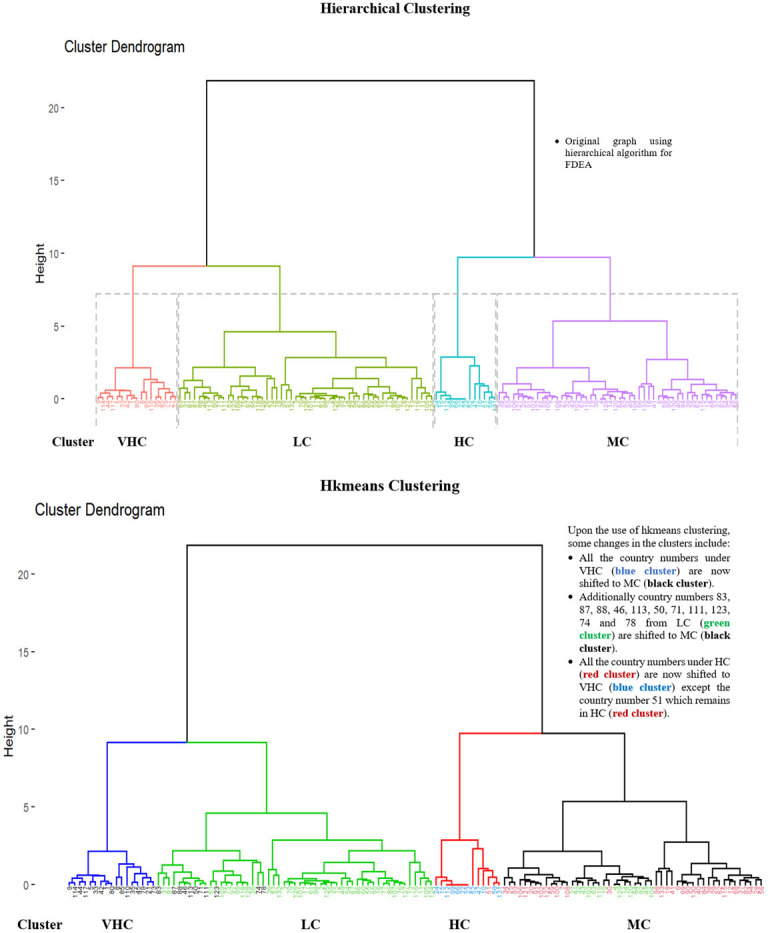 Figure 29
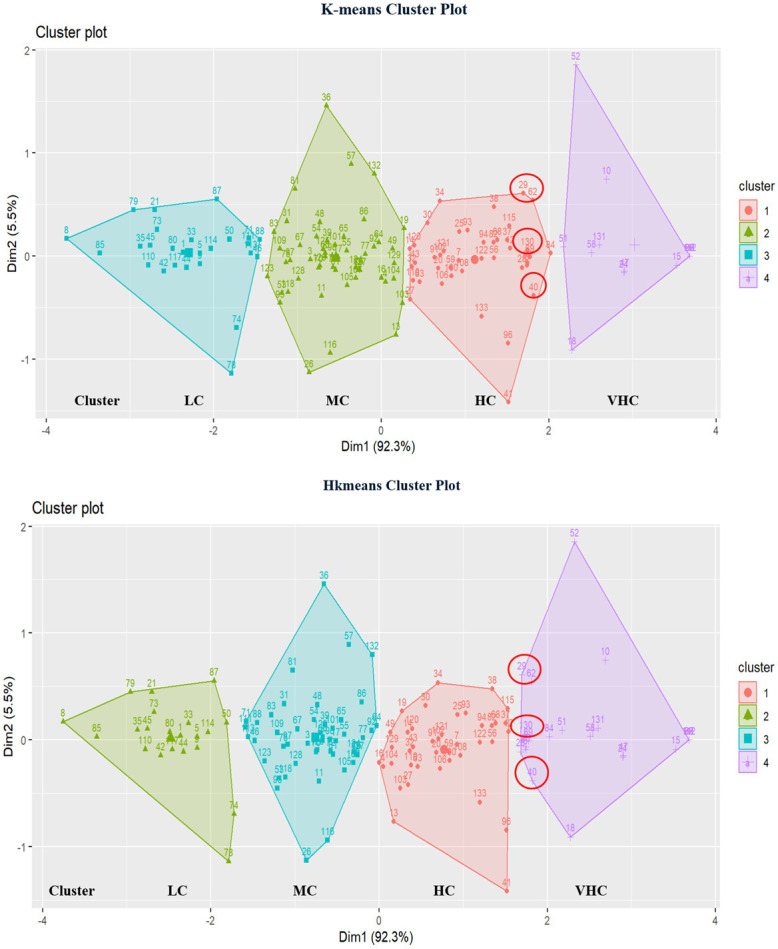 Figure 30
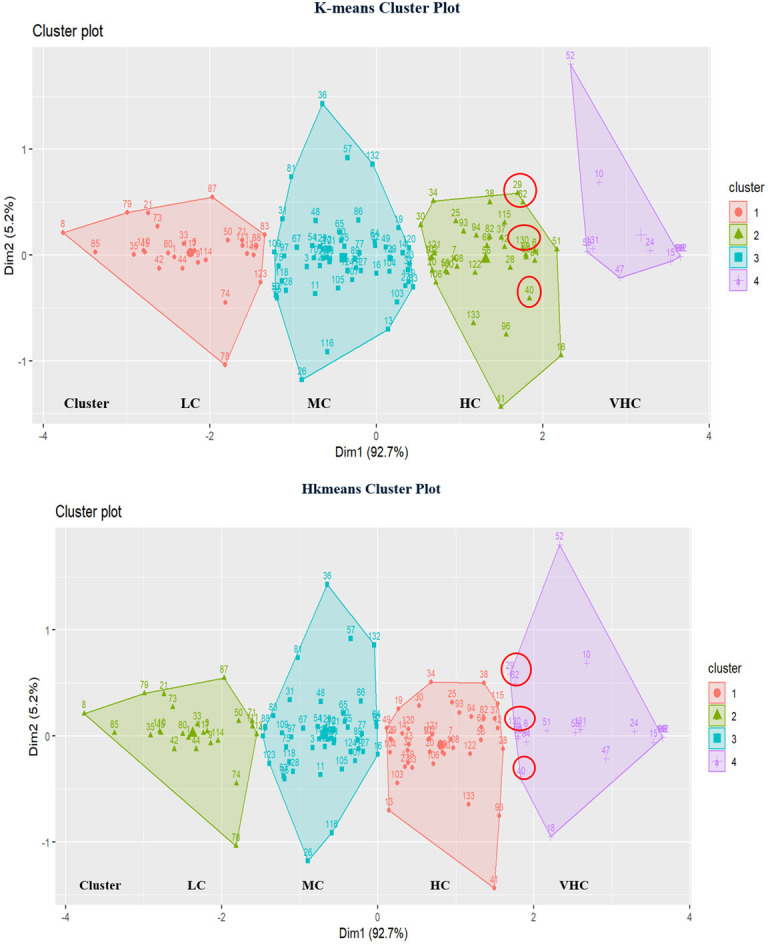 Figure 31
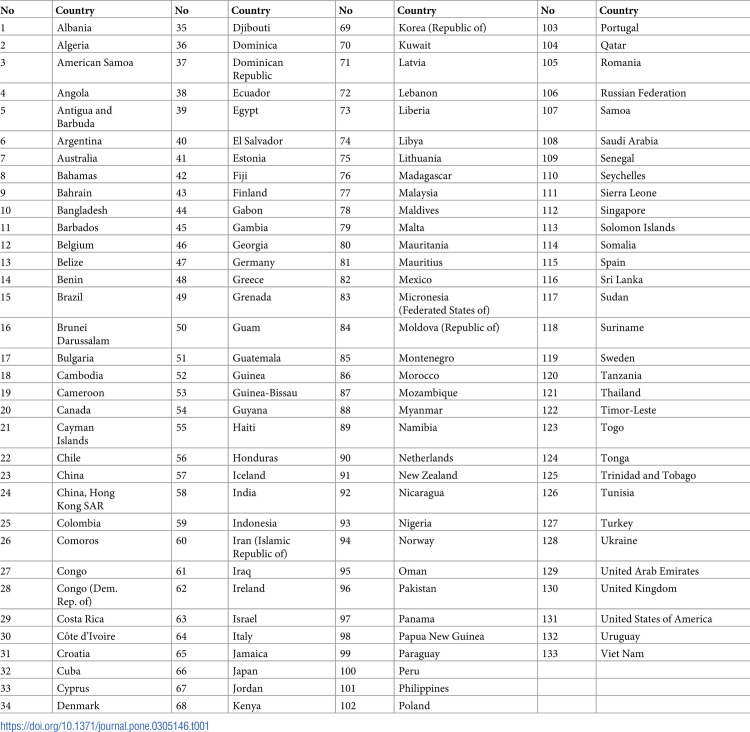 Figure 32
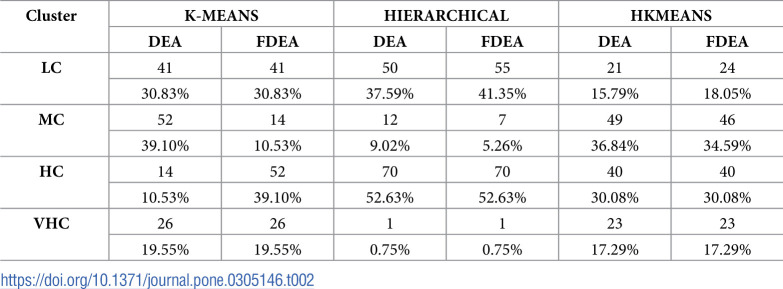 Figure 33
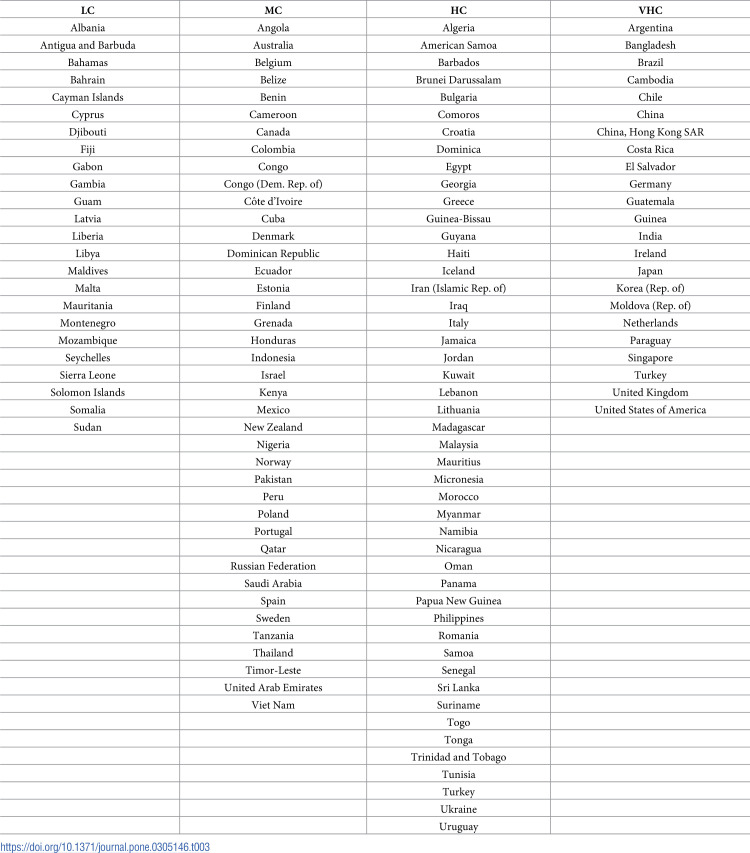 Figure 34
Peer Reviews
No public reviews on file for this paper yet. If you reviewed it on a platform where reviews are public (OpenReview, ICLR, NeurIPS, ICML), you can paste yours below so the community can read it here.
Videos
No videos yet. Explain this paper in a talk, walkthrough, or lecture? Add one.
Taxonomy
TopicsMaritime Ports and Logistics · Vehicle Routing Optimization Methods · Efficiency Analysis Using DEA