An empirical comparison of sleep-specific versus generic quality of life instruments among Australians with sleep disorders
Taylor-Jade Woods, Billingsley Kaambwa

TL;DR
This study compares how well generic and sleep-specific quality of life tools work for Australians with sleep disorders.
Contribution
The study provides empirical evidence on the complementary roles of generic and sleep-specific QoL instruments in sleep disorder populations.
Findings
Generic and sleep-specific instruments showed moderate overlap in measuring quality of life constructs.
A five-factor model best explained the shared constructs, including daytime dysfunction and perceived sleep quality.
Combining EQ-5D-5L with ESS or PSQI provides the most comprehensive QoL assessment for sleep health interventions.
Abstract
In Australian adults diagnosed with a sleep disorder(s), this cross-sectional study compares the empirical relationships between two generic QoL instruments, the EuroQoL 5-dimension 5-level (EQ-5D-5L) and ICEpop CAPability measure for Adults (ICECAP-A), and three sleep-specific metrics, the Epworth Sleepiness Scale (ESS), 10-item Functional Outcomes of Sleep Questionnaire (FOSQ-10), and Pittsburgh Sleep Quality Index (PSQI). Convergent and divergent validity between item/dimension scores was examined using Kendall’s Tau-B correlation, with correlations below 0.30 considered weak, between 0.30 and 0.50 moderate and those above 0.50 strong (indicating that instruments were measuring similar constructs). Exploratory factor analysis (EFA) was conducted to identify shared underlying constructs. A total of 1509 participants (aged 18–86 years) were included in the analysis. Convergent…
Genes, proteins, chemicals, diseases, species, mutations and cell lines named across the full text — each resolved to its canonical identifier and authoritative record.
Click any figure to enlarge with its caption.
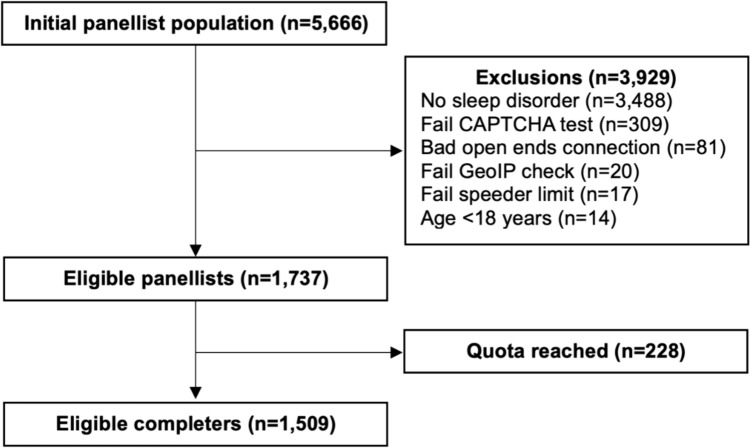 Figure 1
- —Flinders University
Peer Reviews
No public reviews on file for this paper yet. If you reviewed it on a platform where reviews are public (OpenReview, ICLR, NeurIPS, ICML), you can paste yours below so the community can read it here.
Videos
No videos yet. Explain this paper in a talk, walkthrough, or lecture? Add one.
Taxonomy
TopicsSleep and related disorders · Urban Transport and Accessibility · Restless Legs Syndrome Research
Plain English summary
Sleep disorders are common in the general population, and reduced quality of life (QoL) is a consequence of them, attributing to $25.5 billion in associated costs in 2019–20. No single instrument is available to measure all aspects of QoL or sleep outcomes relevant to people with sleep disorders in an economic evaluation (comparing the costs versus outcomes of interventions). Currently, a combination of a generic and sleep-specific questionnaires is commonly used to measure the benefits of sleep disorder interventions because using one or the other alone does not measure QoL with enough breadth. We compared two generic and three sleep-specific instruments to identify which instruments are appropriate in economic evaluations and if generic and sleep-specific questionnaires share an underlying relationship in their measurement of QoL or sleep outcomes. In the absence of a single ‘gold-standard’ questionnaire, our results support the combined use of a generic and sleep-specific instrument to measure QoL and sleep outcomes in sleep disorder patients. Therefore, depending on the research’s context, a combination of the generic EuroQoL 5-dimension 5-level and the sleep-specific Epworth Sleepiness Scale (for the broadest measurement of sleep outcomes) or Pittsburgh Sleep Quality Index (where bodily function is more important) is recommended.
Introduction
Sleep disorders are prevalent in the general population despite being underdiagnosed and under-treated [1]. The incidence of the two most common sleep disorders in adults, obstructive sleep apnea (OSA) and insomnia, is estimated at approximately 1 in 7 [2] and 1 in 10 [3], respectively. The health consequences of sleep disorders include increased risk of cardiovascular disease, metabolic syndrome [4], reduced quality of life (QoL) [5], and mortality [6, 7]. Beyond the substantial burden of illness and loss of wellbeing, which put healthcare resources in high demand, sleep disorders pose a dramatic quantifiable economic burden [1] borne by patients, payers, and society [8]. Between 2019–20, the cost of sleep disorders in Australia was $35.4bil AUD, with 72% attributed to the non-financial reduction in wellbeing [1]. A cost incursion of this magnitude puts pressure on the distribution of limited public funds among competing healthcare interventions, making the knowledge of health economic aspects of intervention crucial for payers and decision-makers.
Economic evaluation is used by decision-makers to guide the cost-effective allocation of public funds and is recommended by decision-making bodies, including the Medical Benefits Advisory Committee (MSAC) in Australia, and the National Institute for Health and Clinical Excellence (NICE) in the United Kingdom [9, 10]. In addition to direct and indirect costs, outcomes such as QoL are a key health economic aspect of evaluating intervention benefits. Several generic preference and non-preference-based questionnaires have been used within sleep economic evaluations to measure QoL and other sleep outcomes. The EuroQoL 5-dimension 5-level (EQ-5D-5L) is amongst the most popular generic preference-based instruments used in such evaluations [13, 14]. An alternative instrument that, to our knowledge, has not been used in sleep economic evaluations is the ICEpop CAPability measure for Adults (ICECAP-A) [15], which focuses on capability-based QoL gains with a broader scope. It is however being used in other non-economic sleep studies [16, 17] Additionally, the ICECAP-A is considered a promising tool for future economic evaluations that extend beyond just health benefits [18]. Reimer and Flemons [19] have argued in support of using generic instruments to measure QoL in sleep- disordered populations, with consideration of physical, mental, and social function, symptom burden, and wellbeing. It is well-documented that sleep disturbance significantly impacts all aspects of QoL, often with a more pronounced effect on mental health [5], supporting the use of generic instruments broadly measuring the concept [19–21]. Measuring QoL with a broad scope is important, but capturing QoL attributes relevant to sleep disorder patients, such as sleep quality, fatigue, and energy, makes for a more effective measurement of intervention outcomes in sleep economic evaluations [11, 12]. Therefore, clinicians and researchers will often select condition-specific instruments with well-established validity because they focus on the unique aspects of a particular condition and can, therefore, detect subtle changes that might be missed by generic instruments [23]. While none of these instruments were developed to generate QALYs used in cost-utility analyses (CUA), and few measure QoL, they do take into account important factors relevant to populations dealing with sleep disorders and may have a place in sleep economic evaluations.
Our recent systematic review has shown that a combination of generic and sleep-specific instruments has been used in nearly half of the economic evaluations of sleep health interventions [14]. It is, however, unclear whether generic or sleep-specific instruments share an underlying, strong relationship in their measurement of QoL and other sleep outcomes. Therefore, this cross-sectional study explored the convergent and divergent validity between the generic EQ-5D-5L and ICECAP-A, and the sleep-specific 10-item Functional Outcomes of Sleep Questionnaire (FOSQ-10), Epworth Sleepiness Scale (ESS), and Pittsburgh Sleep Quality Index (PSQI) and their latent constructs in Australians who self-reporting having a sleep disorder. While the ESS and PSQI do not strictly measure QoL, they are commonly used screening tools, measuring daytime sleep propensity and sleep quality respectively. The conceptual overlap between instruments was also assessed using the International Classification of Functioning, Disability and Health (ICF) framework [24].
Methods
Sample
In this study, participants completed a structured questionnaire including a series of socio-demographic questions and five QoL instruments contemporaneously administered. Two instruments were generic: the EQ-5D-5L and ICECAP-A. Three instruments were sleep-specific: ESS, FOSQ-10, and the PSQI. The questionnaire was accessible via ‘PureProfile’, an online survey platform, on users’ dashboards from May 27th to August 9th 2022. Following advertisement of the study to PureProfile’s platform of users, informed consent was gained from all potential participants before proceeding to the questionnaire which gathered data from adults (aged 18 and above) who self-reported being diagnosed with a sleep disorder (participants were asked to specify which). Eligibility was based on predetermined quotas for various traits such as age, sleep disorder history, ethnicity, income, education, and employment status. Authentication criteria were applied to ensure legitimacy of respondents including CAPTCHA (Completely Automated Public Turing test to tell Computers and Humans Apart) test, open ends connectivity, internet protocol (IP) geolocation, and speeder limits. The goal was to secure a nationally representative sample of the Australian population. The target sample size was 1500, well exceeding the minimum recommended number of 50 participants for this kind of survey [25].
Quality of life instruments
The EQ-5D-5L is a widely-used generic health-related QoL measure. Although not validated in sleep disordered populations, the EQ-5D-5L has shown excellent psychometric properties across a range of other disease populations and settings [26]. The EQ-5D, both 3- and 5- level, are the most frequently used generic instrument in economic evaluations within sleep disorders [14], though the EQ-5D-5L has reduced ceiling effects compared to its three-level counterpart [27]. It measures five dimensions: mobility, self-care, usual activities, pain/discomfort, and anxiety/depression each with five levels of impairment ranging from ‘no problem’ to ‘unable’ defining a possible 3125 health states. Using the Australian general population preference weights, a utility score ranging from −0.30 to 1 was attached to each health state [28].
The ICECAP-A is a generic measure of adult capability wellbeing measuring five dimensions: stability, attachment, achievement, autonomy, and enjoyment. Each attribute has four levels ranging from full to no capability to distinguish a possible 1024 capability states [15]. The algorithm based on a best–worst scaling method using UK population tariffs was applied to score the ICECAP-A and derive overall scores ranging from 0 (no capability) to 1 (full capability) [29].
The FOSQ-10 is a self-administered questionnaire assessing the impact of excessive somnolence on QoL in adults that is often applied in primary sleep disorders, particularly OSA. Shorter than its predecessor, the FOSQ-30 [30], the FOSQ-10 has performed well in recent studies [31, 32] and a newly established minimally important difference [33] improves its interpretability and applicability in practice. Due to the limited number of items per subscale (1 to 3), only the total score (ranging from 5 to 20) is recommended for use [34].
Applied across many sleep disorders and settings, the ESS is the most commonly used instrument for assessing excessive daytime sleepiness, which is a major consideration specifically in clinical decision-making concerning the diagnosis and management of OSA [35, 36]. It was also the most commonly applied sleep-specific instrument in economic evaluations [14]. Participants rate their propensity to doze or fall asleep on a four-point scale from 0 (never) to 3 (high chance) in eight different low-activity situations. Taking the sum of each item’s score, ranging from 0 to 24, an ESS score greater than 10 is indicative of excessive daytime sleepiness [37].
The PSQI is a self-report questionnaire used to discriminate between ‘poor’ and ‘good’ sleepers in clinical and non-clinical populations. Its application within sleep disorders is broad including sleep initiation and maintenance disorders and disorders of excessive somnolence [38]. Nineteen items generate 7 component scores (based on Likert response scored 0 to 3) and an overall ‘global’ score ranging from 0 to 21. Five additional items answered by a bed partner are excluded from scoring.
Higher scores for the EQ-5D-5L, ICECAP-A and FOSQ-10 indicated better outcomes, whereas the converse was true for the ESS and the PSQI.
Conceptual overlap between instruments
The dimensions/items of all instruments were compared using the ICF to assess the conceptual overlap between the instruments [24]. The ICF is a multipurpose and comprehensive framework used to classify health and disability concepts within a biopsychosocial model of health, functioning, and disability [24]. Using the ICF framework, the instrument dimensions were categorised into two of four possible domains: (i) ‘body functions’ (measuring impairments of a) physiological and psychological functioning and b) anatomical functioning of body systems), and (ii) ‘activities and participation’ (measuring the full range of life areas including execution of tasks and management of life situations) [24]. Both domains were broken down into chapters which were further broken down into categories.
Statistical analysis
Descriptive statistics (means, standard deviations, medians, interquartile ranges, frequencies) were generated. The distribution of the dimension/total scores of all QoL instruments were tested for normality using the Shapiro-Francia test [39]. All instrument dimension/total scores followed non-normal distribution (Shapiro-Francia test, p < 0.05), therefore, non-parametric tests of differences were applied (Wilcoxon-Mann Whitney, Kruskal Wallis, and Spearman’s correlation). Differences in dimension/total scores based on demographics (age band, gender, living arrangements, educational attainment) and self-rated QoL were tested using the Kruskal Wallis test.
Convergent validity between dimension/total scores of all instruments was assessed using Kendall’s Tau-B rank correlation significant at the 5% level, recommended for ordinal categorical data [40]. Correlations below 0.30 were considered weak, those between 0.30 and 0.50 moderate, and those above 0.50 strong. Strong absolute correlations between instruments, indicative of convergent validity, suggested they were measuring similar constructs [40]. We hypothesised that strong convergent validity would exist between items or dimensions belonging to the same ICF domains. Divergent validity was also assessed using Kendall’s Tau-B correlation. We hypothesised that divergent validity would be confirmed if items/dimensions belonging to different ICF domains had lower or no statistically significant correlation than those belonging to the same ICF chapter.
Exploratory Factor Analysis (EFA), incorporating Polychoric correlation matrices and iterative principal factor extraction to accommodate the ordinal and multivariate non-normal nature of the data (Mardia’s kurtosis p < 0.001 [41]), was conducted. Minimum average partials (MAP) [42] and Horn’s parallel analysis (PA) [43] were used to determine the optimal number of factors to retain. Promax oblique rotation with a kappa value of 3 was used to ensure realistic and statistically sound factor structures [44, 45]. The threshold for salient loadings was set at 0.32 as recommended in the literature [46]. The magnitude of loadings was interpreted as follows: ≥ 0.32 to < 0.45 was poor, ≥ 0.45 to < 0.55 was fair, ≥ 0.55 to < 0.63 was good, ≥ 0.63 to < 0.70 was very good, and ≥ 0.70 was excellent [47]. All candidate models were judged on their interpretability and theoretical sense to identify the most acceptable solution [48, 49]. Four sensitivity analyses testing the results’ robustness compared correlation matrices used (polychoric vs Pearson’s), factor extraction methods (iterative principal factor vs maximum likelihood), alternative rotation methods (promax vs oblimin), and outliers (using Mahalanobis distance (D^2^) [50].
There was no missing data to account for in our analyses. The assumed threshold for statistical significance in all analyses was 5% [51], and Stata version 15.1 (StataCorp, TX) was used to conduct all analyses.
Ethical approval
This study adhered to the ethics guidelines set forth by the 1964 Helsinki Declaration and received approval from the Flinders University Social and Behavioural Ethics Committee.
Consent
Informed consent was obtained from all individuals included in this study.
Results
Cohort selection is depicted in Fig. 1. Of the initial PureProfile panellist population (n = 5666), 1737 were eligible. The primary reason for exclusion was not having had a sleep disorder (n = 3488). After pre-determined quotas were reached, 1509 eligible panellists completed the survey. There were no partial completions or missing data.Fig. 1. Sample selection flow chart. CAPTCHA Completely Automated Public Turing test to tell Computers and Humans Apart, GeoIP geographic internet protocol
Sample characteristics
Participant characteristics are presented in Table 1. Participants’ ages ranged from 18 to 86 years (mean 46 and median 45). The sample consisted of nearly equal numbers of males and females. Self-rated QoL was indicated as average, good, or very good by 80.7% of participants. The frequency of self-reported sleep disorders is reported in Table 2. Bruxism was most commonly reported (n = 569, 37.7%), followed by insomnia (n = 553, 36.7%) and OSA (n = 467, 31.0%). Narcolepsy was least frequently reported (n = 41, 2.7%).Table 1. Quality of life values for selected participant sociodemographicsCharacteristicN (%)EQ-5D-5Lmedian (IQR)ICECAP-A median (IQR)ESSmedian (IQR)FOSQ-10median (IQR)PSQImedian (IQR)Whole sample (absolute score)1,509 (100)0.89 (0.78–0.96)0.85 (0.69–0.94)6 (3–9)35 (28–38)9 (6–12)Whole sample (Z-score)^a^1,509 (100)0.00 (± 1.00)0.00 (± 1.00)0.00 (± 1.00)0.00 (± 1.00)0.00 (± 1.00)Age 18–24 years188 (12.5)0.89 (0.65–0.93)0.81 (0.67–0.92)8 (4–11)29 (24–34)10 (8–13) 25–34 years292 (19.4)0.92 (0.81–0.97)0.86 (0.71–0.94)7 (4–1033 (25–37)10 (7–13) 35–44 years261 (17.3)0.92 (0.85–0.97)0.87 (0.70–0.97)6 (3–10)25 (28–38)10 (7–13) 45–54 years248 (16.4)0.89 (0.76–0.96)0.85 (0.66–0.92)6 (3–9)34 (27–38)10 (7–14) 55–64 years216 (14.3)0.89 (0.78–0.96)0.80 (0.61–0.92)5 (2–8)36 (31–39)11 (7–14) 65–74 years233 (15.4)0.89 (0.80–0.96)0.87 (0.81–0.92)4 (2–8)38 (34–40)9 (6–12) 75 + years69 (4.6)0.92 (0.80–0.93)0.87 (0.81–0.92)5 (3–8)38 (35–40)9 (6–12) Prefer not to say2 (0.1)0.86 (0.76–0.96)0.90 (0.79–1.00)12 (7–16)22 (14–30)10 (5–14)* P*-value^b^** < 0.01**** < 0.01**** < 0.01**** < 0.010.19Gender Male753 (49.9)0.92 (0.81–0.97)0.88 (0.70–0.95)6 (3–10)35 (29–39)10 (7–12) Female753 (49.9)0.89 (0.76–0.93)0.84 (0.67–0.92)5 (3–9)34 (27–38)10 (8–14) Other1 (0.1)0.62 (0.63–0.63)0.92 (0.92–0.92)13 (13–13)33 (33–33)missing Prefer not to say2 (0.1)0.98 (0.96—1.00)0.65 (0.51–0.79)7 (7–7)34 (30–37)7 (5–8) P-value^b^ < 0.01**** < 0.010.02 < 0.01**** < 0.01Aboriginal or torres strait islander status No1423 (94.3)0.92 (0.80–0.96)0.85 (0.69–0.94)6 (3–9)35 (29–38)10 (7–13) Yes, aboriginal73 (4.8)0.81 (0.49–0.92)0.79 (0.57–0.93)8 (4–13)28 (22–34)11 (8–14) Yes, torres strait islander2 (0.1)0.36 (0.08–0.65)0.52 (0.51–0.53)9 (7–10)28 (24–31)10 (8–11) Yes, both aboriginal and torres strait islander5 (0.3)0.34 (0.20–0.76)0.76 (0.07–0.87)16 (14–19)14 (14–29)12 (9–14) Prefer not to say6 (0.4)0.81 (0.60–0.96)0.81 (0.67–0.88)8 (4–15)32 (20–36)8 (7–15) P-value^b^ < 0.010.05 < 0.01**** < 0.010.25Country of birth Australia1215 (80.5)0.89 (0.76–0.96)0.85 (0.67–0.84)6 (3–10)34 (27–38)10 (7–13) Not australia283 (18.8)0.92 (0.85–0.96)0.87 (0.70–0.94)6 (3–9)36 (30–39)9 (7–12) Prefer not to say11 (0.7)0.92 (0.86–0.97)0.80 (0.62–0.97)5 (0–9)39 (32–40)11 (10–17) P-value^b^ < 0.010.240.29 < 0.010.03Living arrangements On your own379 (25.1)0.89 (0.76–0.96)0.81 (0.64–0.92)6 (3–10)35 (29–38)10 (7–13) With your spouse794 (52.6)0.92 (0.82–0.96)0.88 (0.76–0.95)6 (3–9)35 (29–39)10 (7–12) With other family283 (18.8)0.89 (0.71–0.93)0.79 (0.60–0.90)7 (3–10)33 (26–37)10 (8–13) With others‚ not family51 (3.4)0.92 (0.61–0.93)0.81 (0.63–0.94)6 (3–11)35 (28–38)10 (7–13) Prefer not to say2 (0.1)0.71 (0.42–1.00)0.39 (0.00–0.79)3 (1–4)30 (20–40)21 (21–21) P-value^b^ < 0.01 < 0.010.14 < 0.010.01Education level Primary or some secondary school (e.g. 8th grade or less)20 (1.3)0.78 (0.35–0.89)0.75 (0.51–0.85)9 (6–13)28 (23–31)10 (9–15) Some high school, but did not graduate132 (8.8)0.88 (0.67–0.93)0.85 (0.61–0.91)6 (3–9)36 (30–39)10 (7–14) High school graduate or HSC262 (17.4)0.92 (0.76–0.96)0.85 (0.69–0.94)5 (3–9)35 (29–38)10 (7–13) Tafe graduate (e.g., Certificate, diploma)460 (30.5)0.89 (0.72–0.93)0.85 (0.64–0.92)6 (3–9)35 (28–38)10 (7–13) University graduate (e.g., Bachelor’s degree)475 (31.5)0.92 (0.85–0.97)0.85 (0.70–0.95)6 (3–10)34 (27–38)9 (6–12) More than 4-year university degree (e.g. Masters, PhD)157 (10.4)0.92 (0.88–1.00)0.89 (0.76–0.97)6 (3–10)36 (30–39)9 (7–12) Prefer not to say3 (0.2)1 (0.76–1.00)1 (1.00–1.00)13 (0–16)40 (14–40)14 (8–22) P-value^b^ < 0.01 < 0.010.030.010.01Self-rated quality of life Very good80 (5.3)0.97 (0.92–1.00)0.97 (0.88–1.00)5 (2–10)38 (31–40)6 (4–10) Good532 (35.3)0.93 (0.89–0.97)0.90 (0.83–0.97)5 (3–9)36 (31–39)8 (6–11) Average606 (40.2)0.89 (0.81–0.93)0.85 (0.69–0.92)6 (3–10)34 (27–38)10 (8–13) Poor225 (14.9)0.77 (0.57–0.89)0.67 (0.51–0.81)6 (3–11)32 (26–36)12 (10–15) Very poor66 (4.4)0.58 (0.28–0.77)0.43 (0.30–0.71)9 (5–12)29 (20–34)14 (11–16) P-value^b^ < 0.01 < 0.01**** < 0.01**** < 0.01**** < 0.01**EQ-5D-5L EuroQoL 5-Dimension 5-Level, ICECAP-A ICEpop CAPability measure for Adults, ESS Epworth Sleepiness Scale, FOSQ-10 10-item Functional Outcomes of Sleep Questionnaire, PSQI Pittsburgh Sleep Quality Index^a^Utility and summary scores were power transformed to follow a normal distribution (using the square transformation) before converting them to Z-scores. Results are reported for mean (± standard deviation)^b^Kruskal-Wallis test, 5% significance thresholdTable 2Frequency of self-reported sleep disordersSleep disorderN (%)OSA467 (31.0)Insomnia553 (36.7)Narcolepsy41 (2.7)Restless legs syndrome292 (19.4)Bruxism569 (37.7)REM sleep behaviour disorder53 (3.5)Parasomnia169 (11.2)Delayed sleep phase disorder67 (4.4)^^Not mutually exclusiveOSA obstructive sleep apnea, REM rapid eye movement
Quality of life instrument scores
The distribution of total (ESS, FOSQ, PSQI) and utility (EQ-5D-5L, ICECAP-A) scores across participant characteristics is shown in Table 1. Median (IQR) EQ-5D-5L and ICECAP-A utility scores were 0.89 (0.78–0.96) and 0.85 (0.69–0.94) respectively. Median (IQR) total scores on the ESS, FOSQ-10, and PSQI were 6 (3–9), 35 (28–38), and 9 (6–12), respectively. For all five instruments, there was a statistically significant relationship between utility/total score and self-rated QoL, suggesting that all instruments were able to discriminate according to self-rated QoL (Kruskal Wallis test, p < 0.01). The distribution of utility/total scores for all instruments across all dimension levels of the EQ-5D-5L and ICECAP-A are presented in the supplementary material Tables S1 and S2.
Conceptual overlap between instruments
Table 3 presents the conceptual overlap according to the ICF framework between all instrument items/dimensions. When the generic instruments were compared to sleep-specific instruments, the most overlap between the two types of instruments was seen in their capture of the ICF ‘activities and participation’ domain. Three of the five (60%) EQ-5D-5L dimensions (‘usual activities’, ‘mobility’ and ‘self-care’) and all the ICECAP dimensions captured this domain. In comparison, all the ESS items, eight of the 10 (80%) FOSQ-10 items (i.e., all except ‘concentration’ and ‘remembering’), and two of the seven (29%) of the PSQI items (‘daytime dysfunction’ and ‘use of sleep medication’) also captured this domain. There was, however, less overlap in the way the two types of instruments captured the ICF ‘body functions’ domain. Only two of five (40%) EQ-5D-5L dimensions (‘anxiety/depression’ and ‘pain/discomfort’) and none of the ICECAP dimensions captured this domain. In contrast, all of the ESS and FOSQ-10, and six of the seven (86%) of the PSQI items (i.e., all except ‘use of sleep medication’) captured this domain.Table 3. Classification of the EQ-5D-5L, ICECAP-A, ESS, FOSQ-10, and PSQI items/dimensions according to the International Classification of Functioning and Disability Functioning (ICF) frameworkInternational Classification of Functioning, Disability and Health (ICF) classificationsQuality of life instrumentsICF domainICF chapterEQ-5D-5L5 dimensionsICECAP-A5 dimensionsESS8 itemsFOSQ-1010 itemsPSQI7 dimensionsBody functionChapter b1: Mental functionsAnxiety/ depressionN/ASitting and readingConcentrationSleep qualityWatching TVRememberingSleep latencySitting, inactiveFinishing a mealSleep durationCar passengerWorking on a hobbySleep efficiencyLying down to restHouseworkSleep disturbancesSitting and talkingOperating motor vehicle (short)Daytime dysfunctionSitting quietlyOperating motor vehicle (long)In a carDifficulty completing tasksManaging financial affairsPerforming workChapter b2: Sensory functions and painPain/ discomfortN/AN/AN/ASleep disturbancesActivities and participationChapter d1: Learning and applying knowledgeN/AAchievementWatching TVN/AN/AChapter d2: General tasks and demandsUsual activitiesSecurityIn a carWorking on a hobbyDaytime dysfunctionHouseworkOperating motor vehicle (short)Operating motor vehicle (long)AutonomyDifficulty completing tasksAchievementPerforming workChapter d3: CommunicationN/AN/ASitting and talkingN/AN/AChapter d4: MobilityMobilityN/ASitting and readingOperating motor vehicle (short)Daytime dysfunctionCar passengerOperating motor vehicle (long)In a carDifficulty completing tasksChapter d5: Self-careSelf-careAutonomyLying down to restFinishing a mealUse of sleep medicationChapter d6: Domestic lifeUsual activitiesSecurityN/AHouseworkN/AAutonomyChapter d7: Interpersonal interactions and relationshipsUsual activitiesAutonomySitting and talkingN/ADaytime dysfunctionAttachmentChapter d8: Major life areasUsual activitiesAchievementN/AManaging financial affairsN/APerforming workChapter d9: Community, social and civic lifeUsual activitiesEnjoymentSitting and readingWorking on a hobbyDaytime dysfunctionSitting and talkingWatching TVSitting, inactiveSitting quietlyEQ-5D-5L EuroQoL 5-Dimension 5-Level, ICECAP-A ICEpop CAPability measure for Adults, ESS Epworth Sleepiness Scale, FOSQ-10 10-item Functional Outcomes of Sleep Questionnaire, PSQI Pittsburgh Sleep Quality Index
Convergent and divergent validity
Results of the assessment of validity between the dimensions and item scores of all instruments is presented in supplementary Table S4. Although correlations existed in the direction expected between items/dimensions of different instruments hypothesised to measure similar constructs, and were statistically significant in most cases, they were weak to moderate at best. Between the EQ-5D-5L or ICECAP-A and all sleep-specific instruments, statistically significant absolute correlation ranged from 0.06 (‘car passenger’ [ESS] vs ‘pain’ [EQ-5D-5L]) to 0.35 (‘daytime dysfunction’ [PSQI] vs ‘anxiety/depression’ [EQ-5D-5L]). The EQ-5D-5L and FOSQ-10 shared the most moderate correlations. Indicative of poor divergent validity, correlation coefficients between items/dimensions of generic versus sleep-specific instruments hypothesised to belong to different ICF domains ranged from 0.05 (‘sleep duration’ [PSQI] vs ‘usual activities’ [EQ-5D-5L]) to 0.33 (‘sleep quality’ [PSQI] and ‘enjoyment’ [ICECAP-A]) (Kendall’s Tau-B, p < 0.05).
Exploratory factor analysis
EFA results are shown in Table 4, depicting loadings of instrument items/dimensions on to the latent factors. Parallel analysis suggested 5 factors be retained, whereas MAP suggested 6 factors be retained (supplementary Tables S5 and S6). Root mean squared residual (RMSR) indicated a close fit of the model (RMSR = 0.041). Assessing all candidate models’ fit showed that, compared to a 6-factor solution, a 5-factor solution had fewer cross-loadings, and removing Factor 6 did not change the RMSR suggesting that a 5-factor solution was simpler. Before rotation, Factors 1 and 2 explained 37.1% and 11.4% of total variance respectively while Factors 3, 4, and 5 collectively explained 14.5%. Nearly two thirds (64.9%) of salient loadings were excellent in magnitude. All items of the FOSQ-10 had excellent magnitude salient loadings onto Factor 1. In contrast, the PSQI ‘daytime dysfunction’ had fair magnitude, while ESS items ‘sitting and talking’ and ‘in a car’ showed poor magnitude. Only items of the ESS loaded on to Factor 2, with 5 of 8 items of excellent magnitude. Factor 3 was loaded onto by all ICECAP-A dimensions, 4 of 5 with an excellent magnitude, and one EQ-5D-5L item (‘anxiety/depression’) with fair magnitude respectively. The ICECAP-A dimension ‘autonomy’ had cross-loading on to Factors 3 and 4 of poor and fair magnitude. All EQ-5D-5L dimensions except ‘anxiety/depression’ loaded saliently on to Factor 5 with good or excellent magnitude. All PSQI components except ‘use of sleep medication’ and ‘daytime dysfunction’ loaded saliently on to Factor 5. The components ‘sleep quality’, ‘sleep duration’, and ‘sleep efficiency’ components loaded with a very good to excellent magnitude. PSQI ‘use of sleep medications’ was the only dimension/item not meeting the salient loading threshold.Table 4. Results of exploratory factor analysis showing factor loadings of the EQ-5D-5L, ICECAP-A and PSQI dimensions, and ESS and FOSQ-10 items^a^VariableFactor 1Factor 2Factor 3Factor 4Factor 5UniquenessEQ-5D-5L dimensions Mobility0.860.26 Self-care0.770.19 Usual activities0.740.21 Pain/discomfort0.550.47 Anxiety/depression0.510.54ICECAP-A dimensions Stability0.860.26 Attachment0.740.48 Autonomy0.390.460.46 Achievement0.760.30 Joy0.790.30ESS items Sitting and reading0.770.41 Watching TV0.760.47 Sitting, inactive0.770.28 Car passenger0.730.40 Lying down to rest0.620.61 Sitting and talking−0.360.550.26 Sitting quietly0.720.33 In a car−0.390.540.29FOSQ-10 items Concentration0.730.32 Remembering0.740.34 Finishing a meal0.840.27 Working on a hobby0.780.29 Housework0.750.32 Operating motor vehicle (short distance)0.910.19 Operating a motor vehicle (long distance)0.770.37 Difficulty completing tasks0.870.22 Managing financial affairs0.900.25 Performing work0.840.23PSQI components Sleep quality0.660.38 Sleep latency0.530.60 Sleep duration0.820.45 Sleep efficiency0.810.46 Sleep disturbances0.380.59 Use of sleep medication0.78 Daytime dysfunction−0.510.42Total variance explained by factor (%)37.111.45.65.13.8n/aDeterminantp < 0.001Bartlett’s test of sphericityX^2^ = 28151.71, p < 0.001Kaiser–Meyer–Olkin measure of sampling adequacy0.94EQ-5D-5L EuroQoL 5-Dimension 5-Level, ICECAP-A ICEpop CAPability measure for Adults, ESS Epworth Sleepiness Scale, FOSQ 10-item Functional Outcomes of Sleep Questionnaire, PSQI Pittsburgh Sleep Quality Index, n/a not applicable^a^Blanks represent absolute loading < 0.32, the assumed threshold for salient loading
Sensitivity analysis
Comparing polychoric and Pearson’s correlation matrices used for EFA, the determinant, Bartlett’s test of sphericity, and KMO results (Tables 4 and S7) show that either correlation matrix was similarly appropriate. Factor extraction using maximum likelihood was similarly parsimonious to iterative principal factor extraction, Factors 1 and 2 explained 48.2% and 48.5% of total variance before rotation respectively with similar uniqueness values. Promax and oblimin rotated solutions shared the same factor loadings and loading magnitudes. Based on the critical value (D^2^ = 59.7) with 30 degrees freedom and using the conservative p < 0.001 significance level, 146 observations were identified as potential outliers. EFA excluding outliers shared the same close fit (RMSR = 0.041) with identical factor loadings of similar magnitude (supplementary Table S8) and was also robust to extraction and rotation methods. Therefore, our EFA results were robust across correlation matrices, extraction method, rotation, and outliers.
Discussion
This study is the first to report an empirical comparison of two generic and three sleep-specific metrics using data from a sample of the Australian general population previously diagnosed with a sleep disorder(s). Weak to moderate convergence between the generic versus sleep-specific instruments supports their application in parallel versus as alternatives within an economic evaluation. Our results suggest that, due to their wider coverage of QoL concepts as summarised by the ICF framework, the EQ-5D-5L in conjunction with the ESS or PSQI are the most appropriate instruments amongst those used in this study to apply dependent on context, content coverage, and latent constructs in economic evaluations and other similar sleep evaluations.
Based on ICF chapters that instrument items/dimensions were hypothesised to load on, statistically significant correlations of items/dimensions measuring the same constructs was moderate at best. The weak to moderate convergence observed between items/dimensions of generic and sleep-specific instruments supports the practice of using both types of instrument in parallel [14] to adequately measure QoL in sleep disorders in general within economic evaluation. An explanation for the weak to moderate magnitudes of correlation observed is that the ICF framework may not adequately capture unaccounted-for, unrecognised, and/or unmeasured latent constructs shared between items/dimensions [52]. For example, ‘sleep quality’ (PSQI) is not only related to ‘anxiety/depression’ (EQ-5D-5L), but several confounding external factors including the physical and social environment [53, 54] and comorbid chronic conditions [55]. Consequently, the strength of association between two items/dimensions hypothesised to measure the same construct is reduced due to the confounding of variables unaccounted for. Similar findings have been reported elsewhere [56, 57].
The robust 5-factor solution EFA showed that each instrument loaded primarily onto its own factor with the exceptions of ‘anxiety/depression’ (EQ-5D-5L) and ‘daytime dysfunction’ (PSQI). Factor 1 was loaded onto by all FOSQ-10 items, 2 ESS items, and 1 PSQI component. Given these items primarily measure daytime functional limitations precipitating from somnolence or poor sleep, Factor 1 can be characterised as ‘daytime dysfunction’. Loading onto Factor 2 was exclusive to ESS items, which Johns [37] posited represents ‘somnoficity’. However, cross-loadings of items 6 (‘sitting and talking’) and 8 (‘in a car’) suggests a single-factor solution is inadequate to describe the latent constructs of the ESS, also shown elsewhere [58]. In fact, Smith et al. [58] found items 6 and 8 of the ESS to be poor measures of the single ‘somnoficity’ construct with few participants reporting ‘a high chance of dozing’ in these situations. Therefore, an alternative characterisation of Factor 2 is required. Evidence suggests that the subjective daytime symptoms of OSA, as measured by the ESS [37], are better conceptualised as ‘fatigue’ rather than ‘somnoficity’ or sleep propensity [58, 59]; hence ‘fatigue’ is a better descriptor of Factor 2. Factor 3 can be characterised as measuring ‘wellbeing’, a broader concept capturing attributes of QoL that reflects the item loadings [60] and is in line with the development approach of the ICECAP-A [15]. Cross-loading of ‘autonomy’ (ICECAP-A) on to Factors 3 and 4 supports the position that not all aspects of Factor 3 are ‘psychosocial’ [60], as posited by Davis et al. [61]. Based on the dominance of items assessing physical functioning loading onto Factor 4, it can be characterised as measuring ‘physical functioning’. These findings and characterisations are commensurate with previous EFAs comparing the EQ-5D-3L with the ICECAP-A [60] and ICECAP-O [61]. Further, the factor loadings of the EQ-5D-5L in this study were the same as those reported for the EQ-5D-3L [60, 61], showing that the additional dimension levels do not change the instrument’s measurement of latent constructs. All PSQI items requiring a subjective assessment of sleep loaded on to Factor 5, as such it is plausible to characterise this factor as ‘perceived sleep quality’. Failure of ‘use of sleep medication’ to load saliently onto any factor is consistent with another EFA [62].
In the absence of a ‘gold standard’ instrument capturing relevant attributes of QoL in sleep disorders, which combination of instruments to use within economic evaluations in general sleep disorder populations should be determined based on study aim(s), content coverage, and latent constructs. The economic evaluation results should enable standardised comparisons across other non-sleep disorders, as in a CUA or CEA. In the case where utility scores are required, as in a CUA, the EQ-5D-5L is one of the instruments recommended by decision-making bodies such as NICE and MSAC [9, 10]. While the EQ-5D-5L remains the most applied instrument in economic evaluations of sleep interventions, the ICECAP-A would be more appropriate in contexts where there is a need to reflect changes in wellbeing-related capability. However, some measurement properties of generic QoL instruments in sleep disorder populations have yet to be demonstrated. Therefore, using a complementary sleep-specific instrument in parallel is required, and ICF framework coverage and latent constructs are additional considerations informing instrument choice. The ICF ‘activities and participation’ domain was captured more than the ‘body functions’ domain. Between the generic EQ-5D-5L and ICECAP-A, the former covers more of the ICF framework (measuring two ICF domains) and two latent constructs (Factors 3 [‘wellbeing’] and 4 [‘physical health’]), suggestive of broader coverage of QoL aspects. Of the sleep-specific instruments, the ICF framework was most broadly covered by the ESS, but the PSQI better measured the ‘body functions’ domain. The consideration of latent constructs shows that ‘daytime dysfunction’ (Factor 1) is common to all sleep-specific instruments, however the ESS and PSQI measure one additional factor each, ‘fatigue’ (Factor 2) and ‘perceived sleep quality’ (Factor 5) respectively. Within sleep disorder cohorts in general, the combination of generic and sleep-specific instrument should be guided by the context in which they will be applied. From the selection of instruments used in this study, a full economic evaluation should employ the EQ-5D-5L as the generic instrument to allow QALY calculation. The accompanying sleep-specific instrument depends on aspects of QoL that need to be measured, with the ESS offering the broadest content coverage and measurement of latent constructs. Although, the PSQI would be more appropriate in contexts where measuring ‘body functions’ is of import.
Several limitations of this study merit note. Data used in this study was collected using a cross-sectional study design where future research should consider a longitudinal study design. Such study design would allow the evaluation of which instruments are most responsive and best capture clinically important changes over time, supporting the assessment of incremental effectiveness in economic evaluation [63, 64]. Further, expanding the comparisons to include other generic and/or sleep-specific instruments should be considered because they may be more applicable in the assessment of sleep health interventions. For example the newly-developed SF-6Dv2 [65] has shown comparative validity to the EQ-5D-5L [66] but is more sensitive to clinical improvements in OSA patients [67], and a recently derived value set enables the calculation of QALYs for health technology assessment [68]. Other jurisdictions should extrapolate our results cautiously given they are based on a nationally representative sample of Australians who self-reported having a sleep disorder. As such, replication of this study in other countries is appropriate.
Conclusion
In the absence of a gold standard, neither a generic nor sleep-specific instrument alone is sufficient for measuring outcomes in general populations diagnosed with a sleep disorder(s) within an economic or other evaluations. Therefore, a combination of both is required. The context of the research to be done should guide the instrument choice.
Supplementary Information
Below is the link to the electronic supplementary material.Supplementary file1 (DOCX 97 KB)Supplementary file2 (DOCX 52 KB)
The reference list from the paper itself. Each links out to its DOI / PubMed record.
- 1National Institute for Clinical Excellence. (2004). Guide to the methods of technology appraisal.27905712 · pubmed ↗