Assessing friction and damage of cell monolayers on soft substrates in vitro
Rasmus Wagner, Matt J. Carré, Cecile M. Perrault, Paul C. Evans, Roger Lewis

TL;DR
This paper introduces a new, cost-effective method to study how medical devices interact with cell layers in a lab setting, using realistic pressures and better mimicking real tissues.
Contribution
The novel contribution is a cost- and time-efficient methodology for studying cell monolayer interactions with medical devices using realistic pressures and soft substrates.
Findings
A soft polydimethylsiloxane substrate better mimics blood vessel mechanics compared to previous materials.
A technique to correct experimental misalignments using raw spatial and force data is introduced.
The methodology is successfully demonstrated using human umbilical vein endothelial cells.
Abstract
In the area of surgical applications, understanding the interaction between medical device materials and tissue is important since this interaction may cause complications. The interaction often consists of a cell monolayer touching the medical device that can be mimicked in vitro. Prominent examples of this are contact lenses, where epithelial cells interact with the contact lens, or stents and catheters, which are in contact with endothelial cells. To investigate those interactions, in previous studies, expensive microtribometers were used to avoid pressures in the contact area far beyond physiologically relevant levels. Here, we aim to present a new methodology that is cost- and time-efficient, more accessible than those used previously and allows for the application of more realistic pressures, while permitting a quantification of the damage caused to the monolayer. For this, a soft…
Genes, proteins, chemicals, diseases, species, mutations and cell lines named across the full text — each resolved to its canonical identifier and authoritative record.
Click any figure to enlarge with its caption.
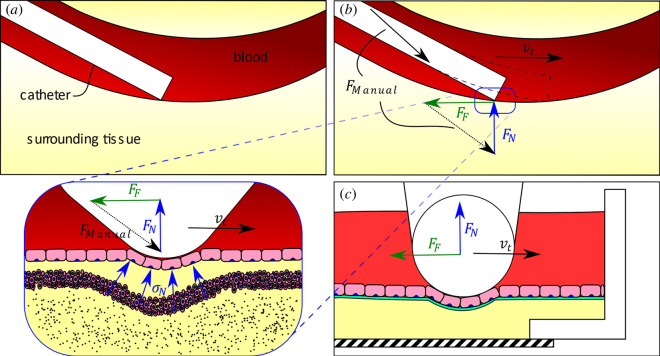 Figure 1
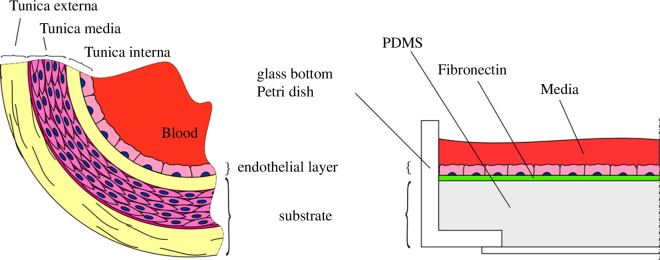 Figure 2
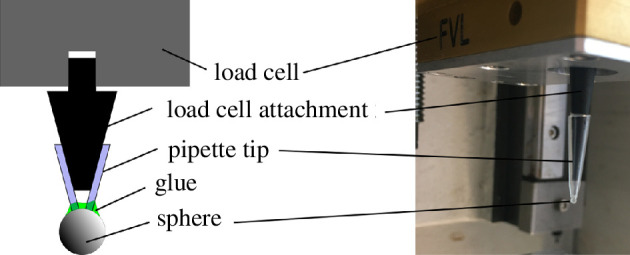 Figure 3
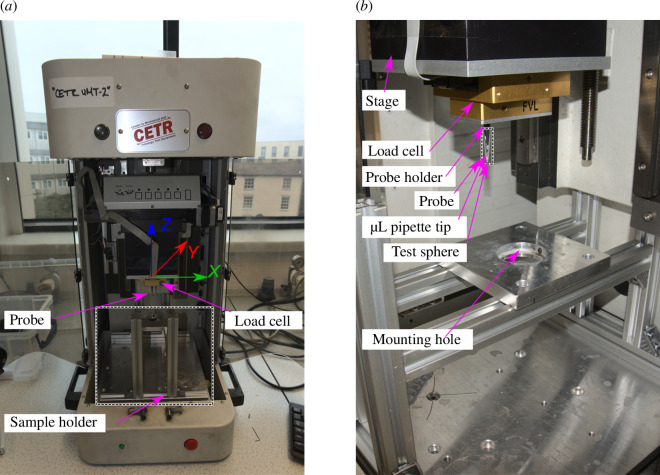 Figure 4
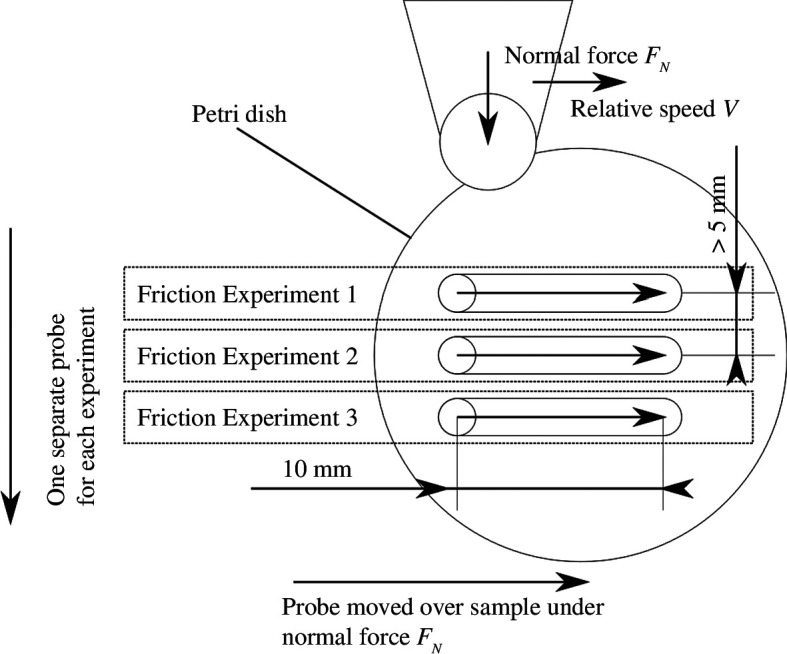 Figure 5
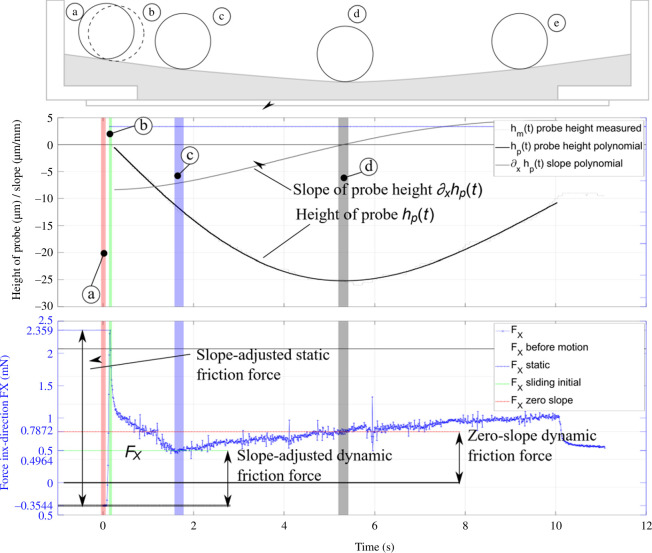 Figure 6
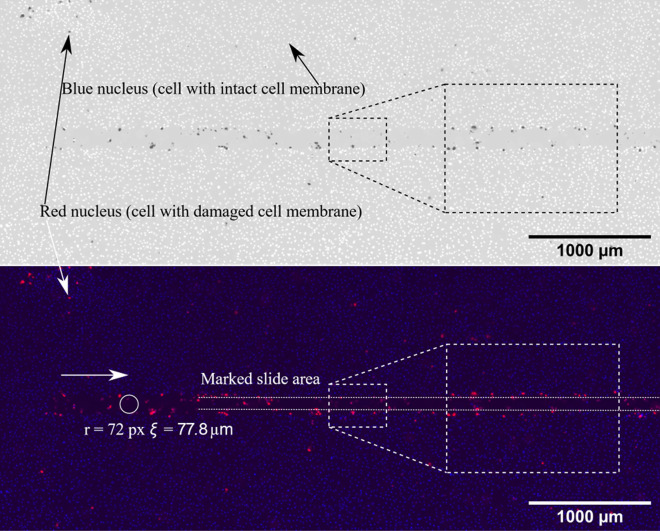 Figure 7
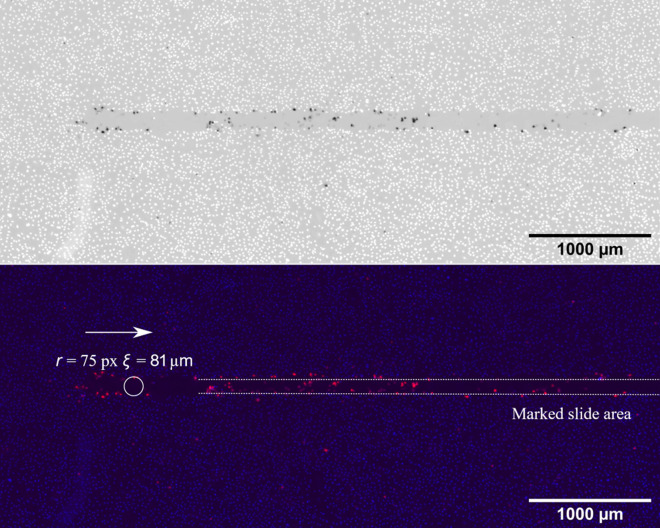 Figure 8
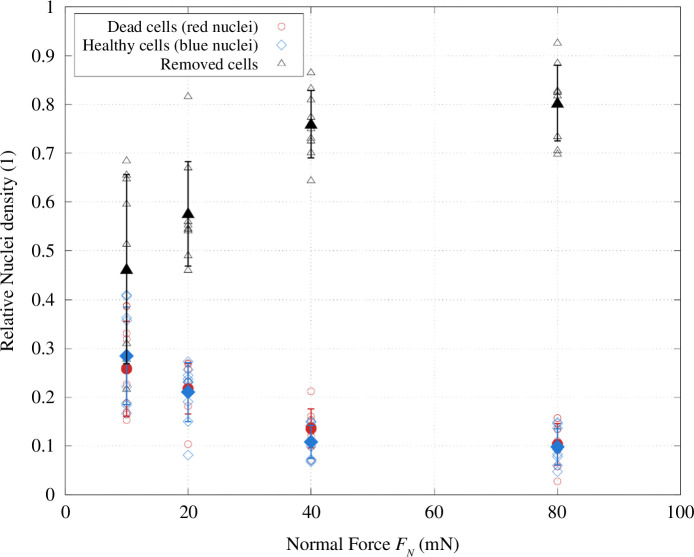 Figure 9
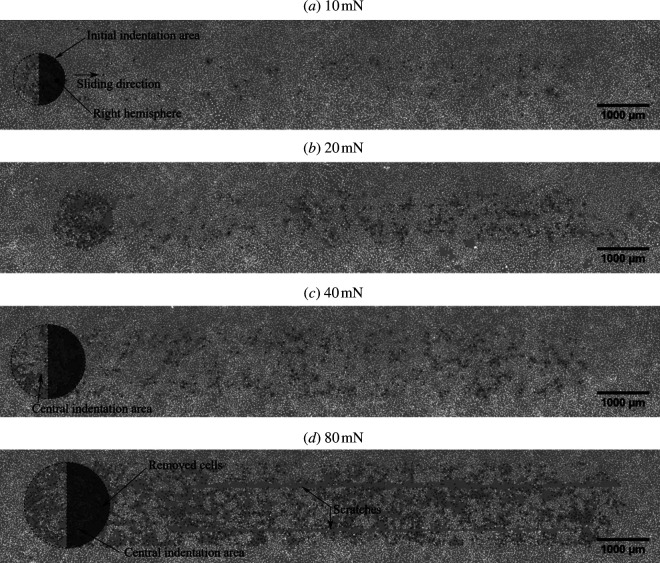 Figure 10
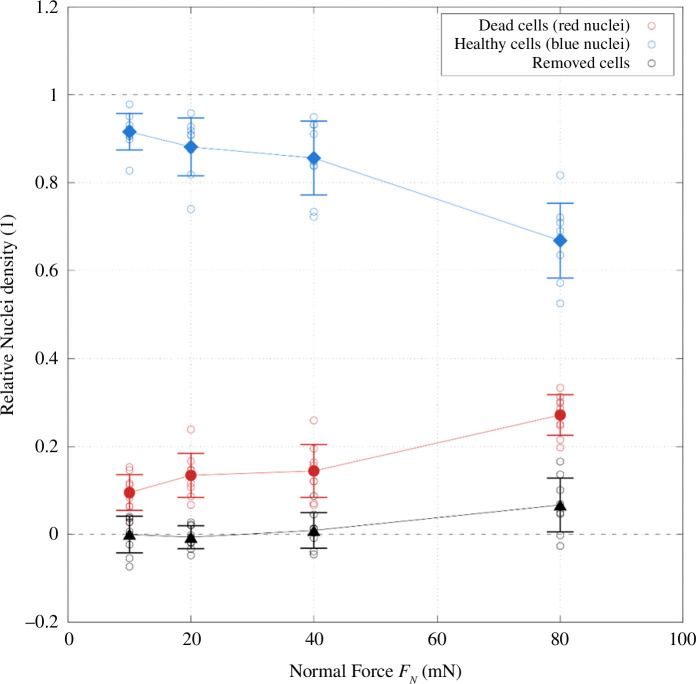 Figure 11
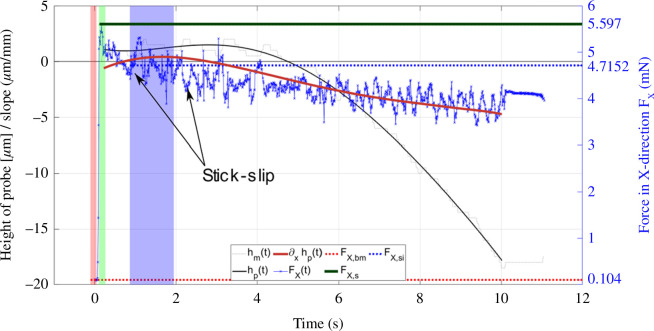 Figure 12
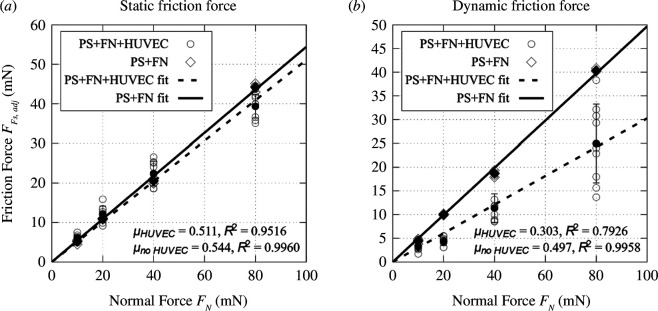 Figure 13
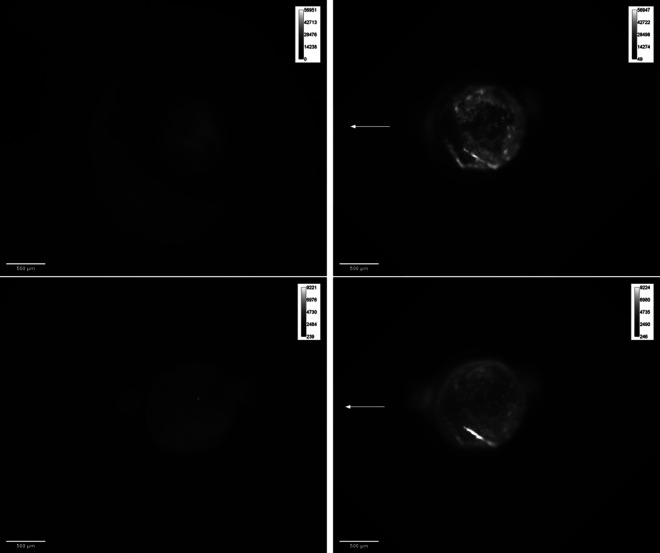 Figure 14
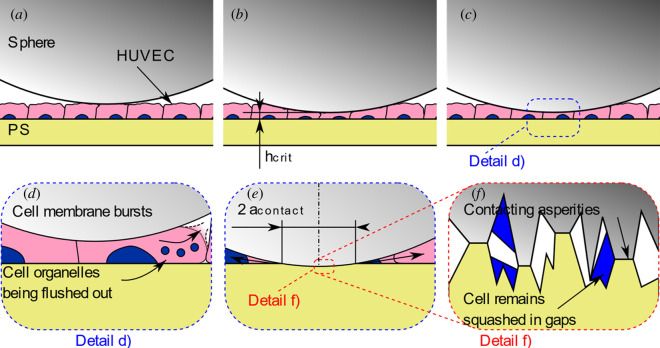 Figure 15
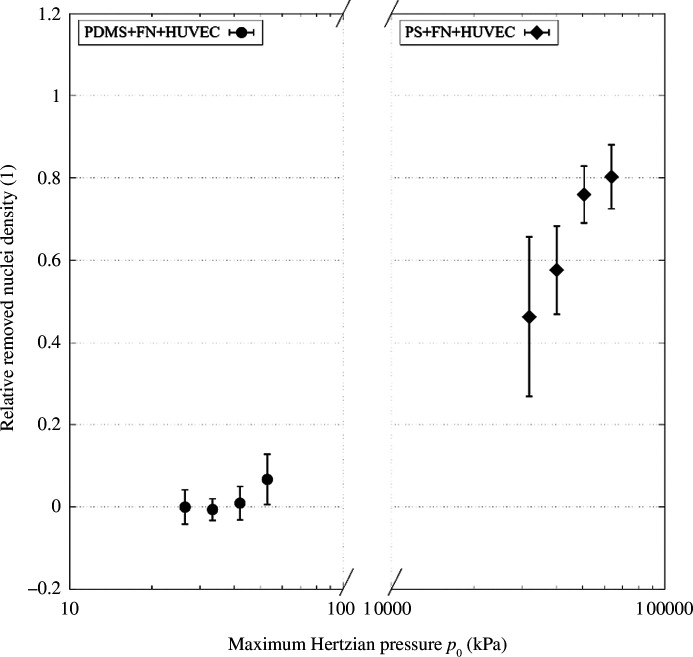 Figure 16
| substrate material | countersurface (probe) material | relative speed | repeats for each load condition |
|---|---|---|---|
| PS + FN | glass | 1 mm s−1 | 3 |
| PS + FN + HUVEC | glass | 1 mm s−1 | 9 |
| PDMS + FN + HUVEC | glass | 1 mm s−1 | 9 |
| parameter [unit] | polystyrene (PS) | polydimethylsiloxane (PDMS) |
|---|---|---|
| vPretouch [mm s−1] | 0.15 | 0.5 |
| vTouch [mm s−1] | 0.03 | 0.15 |
| vTracking [mm s−1] | 0.01 | 0.1 |
| FN,Touch [mN] | −1 | −0.3 |
Peer Reviews
No public reviews on file for this paper yet. If you reviewed it on a platform where reviews are public (OpenReview, ICLR, NeurIPS, ICML), you can paste yours below so the community can read it here.
Videos
No videos yet. Explain this paper in a talk, walkthrough, or lecture? Add one.
Taxonomy
TopicsCellular Mechanics and Interactions · Tendon Structure and Treatment · Polymer Surface Interaction Studies
Introduction
Some of the most popular cardiovascular medical devices (CMDs) are catheters, stents and stent retrievers. Stents are tube-shaped mesh structures used to open a blocked blood vessel. Catheters are used to deliver or retrieve fluids to or from various locations in the body. Stent retrievers are used to retrieve blood clots. All these devices touch the blood vessel wall during their application and operation, which causes mechanical interaction at the interface between endothelial cells (ECs) and medical devices. While stents are stationary, catheters and stent retrievers move relative to the vessel surface during their operation. Hence, for both groups of devices, friction plays a role, with dynamic friction being more important in catheters and stent retrievers, while static friction plays a major role for stents. Stents that do not apply enough static friction between stent struts and vessel walls can migrate owing to blood flow. Tribology has been successfully used in other areas to study the interaction between biomaterials such as tissue or bone and materials that have been introduced into the body in the context of implants, such as for artificial joints or hip replacements [1–3].
The applications of CMDs come with risks of complications, some of which can be linked to mechanical trauma or damage to the endothelium. In the physiological context, the damage caused by frictional interaction refers to trauma caused to the endothelial layer. As cell monolayers are not a conventional material in tribology, specific methods are required to make the damage or ‘wear’ visible and to quantify it in this context.
In vitro friction experiments have been conducted on (endothelial) cells before [4–8]. The overwhelming majority of those studies were carried out using cells cultured on either flat samples of polystyrene (PS) or glass, both of which are very good materials for cell culture. However, they are extremely hard compared with in vivo materials. Some of those studies have used soft (hydrogel) counter surfaces to avoid high pressures; however, since hydrogels only represent a realistic medical device material for a limited number of applications (contact lenses and some catheters), many studies have used glass or stainless steel spheres as the contacting ‘probe’ for testing. This makes the experiments reproducible and comparable, as accurately manufactured spheres of these materials can be procured anywhere in the world with relative ease. Nevertheless, these material pairings mean that the cells are stuck between a hard substrate and a hard sphere. Unless expensive microtribometers are available enabling extremely low loads to facilitate the application of low contact pressures, this results in almost all the cells in the contact area being destroyed owing to extreme compression, which makes damage difficult to assess, produces conditions that are not realistic and leads to the total obliteration of the cells. Those conditions also raise the question of the quality of the lubricating layer: it is not clear whether an intact endothelial monolayer or mangled cell remains are tested. The methodology to create soft substrate samples with a monolayer of human umbilical vein endothelial cells (HUVECs) shown in this work was developed with this in mind and was used to test cells in a more realistic way that also makes it possible to assess damage. In contrast, the exact same methodology (except for the soft substrate) was applied to stiff PS-based samples in order to see how the soft substrate influences the results.
This study aims to further improve tribological experiments on cell monolayers by mimicking the mechanical properties of blood vessels better than previous studies using a soft substrate. A live/dead assay is used to determine cell damage. Furthermore, a method is proposed to identify and account for misalignments based on the raw position and force data output by the tribometer. Not many studies share information on how raw data were processed and where friction forces were measured. The method presented in this work allowed us to study the effect of varying normal force on damage and friction. It also enables research groups that cannot afford a specialized biotribometer but have access to a generic tribometer capable of measuring low loads to conduct experiments on cell monolayers.
This work aims to provide a framework to mimic the frictional interaction between blood vessels and medical devices in an in vitro environment under more realistic conditions. For this, glass spheres were tested against a blood vessel substitute consisting of ECs, fibronectin (FN) and a soft polydimethylsiloxane (PDMS) to study the influence of load parameters. Future work may explore the relationship between probe material properties as an input and friction and damage as an output.
Background
The interaction of CMDs, specifically stents and catheters, against blood vessels is not well understood until now. Reliable friction data could provide more accurate simulations and models. Understanding the endothelium’s reaction to frictional interaction with medical devices and the resulting damage can inform new medical device designs. This would result in making an intervention safer and less invasive by reducing complications such as the risk of traumata and de-endothelization, with possibly following atherosclerosis. Additionally, when using catheter intervention, lower friction could mean less resistive forces and, therefore, a more pleasant and overall smoother process for the patient [9]. The interaction of a catheter with a blood vessel and the respective in vitro replication is shown schematically in figure 1.
Catheter sliding on blood vessel (a,b) and in vitro replication (c) with tangential speed vt under normal force FN , resulting in friction force FF . In the in vivo situation, FN and FF result in a total force Fmanual that must be overcome by the surgeon.
New materials need to be tested to achieve the goal of making cardiovascular intervention safer. Generally, the relevancy of the experiment to real applications increases with increasing complexity. However, cost and timeframes become bigger for such tests, and for in vivo experiments and medical studies, animals are often used, which is undesirable. Therefore, it is important to test new materials using in vitro experiments under laboratory conditions first before advancing to ex vivo and then in vivo testing, gradually increasing complexity and ensuring that new materials are tested extensively before their application in animals and, finally, humans. Ideally, we would want in vitro tests to be representative enough that human/animal testing is not needed; however, at the moment, in vitro experiments alone are not capable of serving as a sufficient substitute.
As such, in vitro experiments are an important step in the development process as they come with the advantages of controlled laboratory conditions while providing results collected from living tissue. They also allow an easy investigation by means of fluorescence and light microscopy. For these reasons, they can be relatively cheap to conduct, quick to set up and, at the same time, accurately emulate real tissue. As the experiment was designed to investigate the interaction between medical devices and blood vessels, the methodology presented will involve HUVECs. However, it could easily be adapted to mimic different tissue types, such as cornea or urinary tract tissues by varying the cell type.
Experiment set-up and protocols
As a baseline, friction experiments were conducted with FN-coated PS dishes (PS + FN). Friction tests with cells were conducted on the same type of dish cultured with cells, which represents the current state of the art for most cell friction experiments (PS + FN + HUVEC). Furthermore, experiments were conducted on a soft substrate sample using soft PDMS (PDMS + FN + HUVEC). An overview of the testing conditions and repeats can be seen in table 1. Experiments with cells were repeated nine times because cells represent an additional variable that cannot be easily controlled. Furthermore, because the cell density was measured after testing for these experiments, a higher number of repeats was chosen than for the ones without cells. Testing PDMS with and without FN showed that friction forces exceeded the limits of the load cell set by the manufacturer and also caused the PDMS to rip. This type of damage was not observed when cells were tested on PDMS, likely owing to the much lower friction forces occurring.
Samples
3.1.
The sample, in the scope of this experiment, means everything that represents the biological tissue. Two critical requirements were identified for the sample.
First, it must have a surface that is as close to that of a real artery as possible. This is because adhesion effects between cells and medical device surface that could be caused by cellular membrane molecules may play an important role. Additionally, to assess damage to the endothelium, the behaviour of the surface must be similar. A HUVEC monolayer was chosen to replicate in vivo surface properties.
Second, it should replicate realistic mechanical properties, which not many other studies have considered. This means that the substrate underlying the cell monolayer should be soft for cardiovascular applications rather than hard like glass or polystyrene substrates. This property is important as pressures are more realistic if a soft substrate is used. The material can deform, just as a real artery (or another human soft tissue such as eyes) would. This avoids introduction of unrealistic pressures in the cells that would be stuck between two hard bodies (probe and glass or polystyrene substrate). For other applications, for example if the underlying real tissue is bone, a hard substrate may be the correct choice, as it could replicate realistic conditions.
The soft sample structure is shown in figure 2. Tunica media and tunica externa were represented by a soft PDMS. FN was used to attach the cells to the substrate. HUVECs were seeded on the substrate.
Structure of an artery and of PDMS-based sample used for in vitro experiments in comparison.
Substrate
3.1.1.
Standard 35 mm culture dishes with a glass bottom (CELLView™, Greiner Bio-One, item no. 627860) were selected to hold the sample, as the glass bottom allows a clearer view of the cells than a regular polystyrene dish would.
As a substrate, soft PDMS (NuSil, GEL-8100) with 1% additional crosslinker (Sylgard 184 curing agent from DOWSIL formerly DOW CORNING) was prepared according to the protocol of Yoshie et al. [10]. This substrate has a Young’s modulus of 73.32 ± 2.96 kPa [10]. Each dish was filled with 2 g PDMS, which is equivalent to approximately 2 ml. Given that the area of one culture dish is ca 8.8 cm^2^, the approximate height of PDMS is 2.27 mm. For some studies, a harder substrate might be desirable. This could be the case if ECs growing on a calcified artery are to be studied or, for example, in cartilage-focused research. Sylgard 184 is a harder PDMS that could be used for this.
The PDMS was cured at 65°C for 8 h (longer than the 90 min specified by Yoshie et al. [10]). This was to ensure thorough curing of the polymer without repercussions because the product is stable at up to 240°C.
After curing, the dishes were sterilized by fully submerging them in a larger cell culture dish filled with 70% IMS and left in the cell culture hood for 30 min. Then, the dishes were transferred to another larger cell culture dish, fully submerged with phosphate-buffered saline (PBS), washed by swilling gently and left for 30 min. Washing with PBS was repeated three times in total.
Coating
3.1.2.
To make the substrate more accommodating for cells, the PDMS was coated with 1 μg cm^−2^ (1−5 μg cm^−2^ is recommended by Sigma for ECs; this value might differ for other cell types) of FN (Merck, cat. no. F1141). Cells can attach to FN because they have cell adhesion molecules able to adhere to the protein that is naturally found in the extracellular matrix. The appropriate amount of FN (8.8 μg per dish) was diluted in 3.5 ml PBS per dish as this volume was sufficient to cover the whole culture dish surface. The solution was mixed with a pipette and each dish was filled with 3.5 ml solution. The dishes were left in a cell culture hood at room temperature overnight. Alternatively, the substrate could be coated with another protein or gelatin for different cell types. When the coating process of the substrate was finished, the sample was washed three times with PBS.
Cell culture
3.1.3.
HUVECs (catalogue number C-12253) were acquired from Promocell, Germany and cultured using the appropriate culture medium (catalogue number C-22010) in T25 and T75 flasks. When the cells in the flask were about 90–100% confluent, the cells were ready for detaching with trypsin (an enzyme that dissolves the extracellular matrix) and seeding on samples. As cells were cultured in regular culture dishes, and friction tests were conducted in a non-sterile environment, sterility could not be fully guaranteed. Hence, the culture dishes could be infected by bacteria or fungi. To avoid infections, cell culture was conducted with penicillin and streptomycin added to the culture medium.
After trypsinization, the detached cells were collected with a pipette. After centrifuging, the cell pellet was diluted in a culture medium, and the cells were counted with a haemocytometer. Cells were seeded with a density of 10 000 cells cm^−2^, resulting in 88 000 cells per dish, diluted in a 3.5 ml cell culture medium. The samples containing cells were stored in an incubator at 37°C, 95% relative humidity and 5% CO_2_. The culture medium was changed every 2–3 days until confluency was reached (after 7–10 days), and as such, the sample was ready for tribological testing. The cells were tested deliberately at full confluency and not after a fixed time as the target was for the sample to represent the usual state of an artery in vivo, that is, a confluent monolayer.
The procedure specified in this section is standard cell culture protocol. A similar approach could be used for different cell types such as epithelial cells, allowing for studying urinary catheter and contact lens interaction in their respective environments, requiring a different culture medium and similar incubation conditions.
Probe
3.2.
The probe replicates the medical device surface and geometry. To obtain realistic results, it is important to use a material that is similar to that of a real device. For catheters, that would be polyurethane, stents would be represented by stainless steel probes and contact lenses could be represented by a hydrogel probe as shown by Marshall et al. [11]. In the scope of this article, 2 mm diameter soda lime glass probes from Atlas Ball & Bearing (ABB), UK were used. Glass does not represent a realistic medical device, but it has been used many times in the past for biotribological experiments. Since this article focuses on presenting a methodology to conduct experiments, the results should be comparable to those of past studies. Hence, glass was chosen as the probe material. Furthermore, glass probes are readily available and, therefore, provide a good baseline despite not necessarily delivering medically relevant results. For the probe geometry, a sphere was chosen as it is a frequently used shape for friction experiments featuring a defined and analytically calculable contact geometry that is important for repeatability and calculation of pressures.
A photo and a schematic of the probe set-up are shown in figure 3. The spheres were glued to pipette tips with cyanoacrylate glue. The load cell attachment is a three-dimensionally printed geometry that serves as a connector between the load cell and the pipette tip with the sphere. As the pipette tip can be pushed over the load cell attachment, a quick swap of probes between friction experiments was possible. This is important as three slides were tested per sample and time spent outside the incubator should be minimized.
Schematic view of probe geometry and photo of the probe in the UMT.
Testing
3.3.
In this experiment, a pin-on-plate set-up was used to apply a single slide over the substrate. The normal load was set to a fixed value. Testing was conducted in a UMT2 from Bruker. For the measurement of forces in x and z directions, a Bruker FVL load cell was used, which features a maximum load of 100 mN with a resolution of 1 µN. The UMT2 and the FVL load cell are shown in figure 4.
(a) UMT2 with custom sample holder and main parts labelled. The coordinate system with the x, y and z axes is also shown. (b) FVL load cell with attached probe and sample holder.
Friction coefficients between ECs and glass can be expected to be around 0.03–0.06 [5]. Therefore, a tribometer capable of measuring low loads is required. The tribometer can move the probe in two directions, normally and tangentially to the sample surface. For the following experiments, the tangential speed was kept constant at 1 mm s^−1^ but could be set up to 3.2 mm s^−1^ in future experiments with the available machine. The tribometer also measures forces in the two directions of movement. It can control the load by lifting or pressing down the load cell with the probe on the substrate by moving the stage in the vertical direction. For the UMT, the vertical speed can be specified using three parameters: pre-touch, touch and tracking. Correct specification of these parameters can be crucial since poor choice may cause the normal load to oscillate, the UMT to call a timeout error or the normal force to diverge from its set value. The values chosen for the two substrate materials in this work can be found in table 2. Values were found through trial and error. When the velocity was set too high, the machine could overshoot the applied force and oscillate or even abort the test. If set too low, the machine would not be able to track the slope of the surface, and, hence, the normal force may diverge.
The sample holder was levelled with respect to the axis using an empty culture dish and ensuring that the test surface was flat. Samples were levelled during curing with a digital spirit level. However, one of the main advantages of this methodology is that certain inconsistencies during levelling may be mitigated owing to the curvature of the sample.
Cells need specific environmental properties to survive. Human cells are usually cultured at 37°C, with 5% CO_2_ and with 95% relative humidity. Owing to the short nature of the experiments described in this article (less than 10 min testing time), none of these properties was controlled during testing. As the sample cannot dry out, the humidity does not have to be controlled. Also, the short testing time does not allow for the pH to change significantly, which is the main purpose of controlling CO_2_ content. As the cells were cultured on plastic and submerged in warm media, the temperature was not assumed to change significantly either. If this methodology was applied for long-term experiments, the tribometer would have to be capable of maintaining the temperature of the sample, pH value of the media and humidity. The best option to maintain these properties is a small environmental chamber. If this option is not feasible, the temperature could be controlled using a culture dish heater. To control the pH value of the media, a buffer, such as HEPES buffer, could be used. High humidity is necessary to maintain the right concentration of nutrients in the media as concentrations rise if water evaporates. This effect should only come into play for very long experiments and could be mitigated by partial media changes during the experiment.
The sample was tested at several locations to maximize efficiency and cost-effectiveness as per the layout shown in figure 5. One sample was large enough to conduct three friction experiments on it. Only a single slide in one direction over the monolayer was studied to limit complexity. Future studies could look at reciprocating load conditions.
Test layout on the sample for friction experiments.
Staining and imaging
3.4.
After testing, the cells may be imaged with the objective of measuring cell damage and cellular reactions, which is called a live–dead assay. In general, live–dead assays are based on two markers. The first marker can enter all cells, including those with a healthy cell membrane. The second one is only able to enter cells with a dysfunctional (damaged) cell membrane owing to the size of the molecule. More advanced techniques may include staining for inflammatory or apoptotic markers.
An easy and readily available method to assess cell damage is trypan blue. Trypan blue cannot permeate a functioning cell wall. This allows cells that suffered damage to be stained blue, which can be detected under a regular light microscope. The stain was tested and showed good results; however, without a counter stain, it is difficult to distinguish areas populated by living cells from areas where cells were removed.
To solve this issue, the cells were stained with propidium iodide (PI) from Sigma-Aldrich (catalogue number P4170) to detect damaged cell nuclei. Additionally, Hoechst 33342 (Thermo Fisher Scientific, H3570) was used as a counterstain to distinguish between areas with live cells and areas without cells remaining. Like trypan blue, PI can only enter cells with a dysfunctional or ruptured cell wall, and it stains for DNA. Unlike trypan blue, PI is only visible under a fluorescence microscope and shows up in the red channel (excitation: 488 nm; emission: 617 nm). As a counterstain for undamaged cells, Hoechst, which can enter live cells and stains for DNA, was used. Hoechst is visible in the blue channel of a fluorescence microscope (excitation: 361 nm; emission: 486 nm). For imaging, a Nikon Eclipse Ti with a CoolLED pE-300 for fluorescence imaging was used. Both stains were applied as a single solution containing 0.15 mg ml^−1^ PI and 1 µg ml^−1^ Hoechst in a PBS buffer.
With these markers, there are three states a cell can show up after testing that are relevant regarding damage. First, the cell can have survived and be attached to the substrate. Such a cell would count as undamaged in the context of this analysis. Second, the cell could still be attached but have suffered a rupture of the cell membrane, eventually leading to cell death. Third, a cell could have been completely detached (either dead or alive). The latter two count towards cells that did not survive the interaction.
After tribologically testing the samples, the medium was aspirated and the sample was washed with 2 ml PBS, and 1 ml of pre-warmed (37°C) staining solution was added to the sample. After incubating for 15 min, the staining solution was aspirated, and the sample was washed with 2 ml PBS and then filled with 1 ml PBS. Afterwards, the sample was imaged under a fluorescence microscope. The cells were not fixed at this point since this was found to adversely affect staining quality, so the imaging process was conducted immediately after staining.
Imaging of the monolayer was not practical before testing since a large area had to be imaged, and quick processing of the sample containing living cells was required. Furthermore, staining was only conducted after testing so as to not induce more stress in the monolayer. With an improved set-up that would allow for imaging below or in front of the probe, capturing brightfield images before testing could be realized.
Data analysis
3.5.
Friction data
3.5.1.
During analysis of the friction data, it was apparent that the height of the probe was not consistent over the sample. It turned out that the probe both moved on a slope and also followed a meniscus shape. The first is caused by the misalignment of the sample with the stage. The latter is an issue of the methodology as the polymer is cured from a fluid base that may cause a changing slope over the sliding distance owing to meniscus effects or could be caused by stresses introduced during curing. If using polystyrene dishes without a soft substrate, for example, the meniscus may not be visible, but the misalignment between stage and sample may still influence the results. Misalignment and meniscus must be considered; however, the meniscus was found advantageous as it sometimes gave a level section at least somewhere along the sliding distance. The effect is shown in figure 6 and overlaid with experimental data. A method to account for misalignments based on a mechanical model developed within the context of this work is presented in appendix A.
UMT friction force FX (blue), height of probe h (black) and slope ∂xh (grey) plotted over time with probe position illustrations. Different stages are marked by coloured boxes: (a) (red)—pre-movement; (b) (green)—static friction; (c) (blue)—friction force stabilized; (d) (grey)—friction force at zero slope; (e) (only on probe position illustration)—sample is moving up the slope; hence, the friction force gets bigger.
Cell damage
3.5.2.
To analyse the damage caused to the cell monolayer, a workflow was created that uses the live/dead assay (Hoechst/PI). Cells were stained with PI which stains damaged cells. Additionally, the sample was stained with Hoechst 33343 which stained the remaining cells. Since the two dyes have different colours under the fluorescent microscope, damaged and healthy cells could be distinguished.
Results
Damage inflicted to the monolayer
4.1.
In [figure 7](#F7 F8), a 10 mN normal force slide is shown. Even for small forces, the monolayer was destroyed within the slide track, and almost no cells remain attached to the track. When the normal force was increased to 80 mN, the width of the slide track did not increase significantly, as shown in figure 8. The width of the track was measured as indicated by the circles. For a normal force *F_N_
- of 10 mN, the average width r was approximately 77.8 µm and for F _ N _ of 80 mN around 81 µm. However, it should be noted that the width could vary along the track. A detailed description of how the monolayer damage was calculated can be found in appendix B.
Red/blue combined image of a 10 mN normal force slide. The slide direction is marked by a white arrow. Top: inverted black and white image with contrast boost. Blue nuclei are white and red ones are dark in black and white image. Bottom: colour image with original red/blue channels.
Redx/blue combined image of an 80 mN normal force slide.
Apart from estimating the width of the track, the slide images that were collected were used to study the damage caused to the monolayer. On average, for normal forces of 10 mN, 28% of cells remained healthy in the slide area, while 26% were dead. Overall, 46% of all cells were removed in the slide area. When the normal load was increased to 20 mN, 21% of healthy cells remained, with 22% dead and 58% removed. Increasing the normal force further to 40 mN resulted in 11% of healthy cells remaining and 14% dead ones with 76% of cells removed. Finally, an increase in *F_N_
- to 80 mN prompted the most fatal damage to the monolayer that was recorded with 10% healthy cells and also 10% dead cells in the slide area. In total, 80% of the cells within the slide area were removed in the friction process on average. These data are plotted in figure 9 for the range of normal forces by showing the relative densities of nuclei in the test area with respect to the reference areas.
Damage caused to HUVEC monolayer on PS by the glass probe. Nuclei densities in the slide area relative to the blue nuclei density in the respective reference areas P are plotted over FN . Measurements of one slide are plotted as hollow circles, while averages are represented by filled circles. Blue circles stand for blue density measurements, red circles for red ones and black circles for the calculated percentage of removed cells.
In figure 10, representative images of the track are shown for the full range of forces on soft substrates. The circular initial indentation area and its right hemisphere are marked. The right hemisphere is the one facing towards the sliding direction. The sliding direction is indicated in the first slide image and is the same in all other images. As a general trend, in the right hemisphere, the damage to the monolayer was noticeably higher. For normal forces of 10 and 20 mN, this resulted in more cells found dead in that region and for higher normal forces of 40 and 80 mN rather than more dead cells being present, more cells were removed there. For a normal force of 80 mN, scratches in the monolayer become apparent, which are highlighted in the respective image.
Slide track images of soft substrate samples tested against glass probes for FN of 10, 20, 40 and 80 mN.
The resulting damage caused to the monolayer by the interaction of the glass probes with the soft substrate samples is shown in figure 11 for different loads. Singular slide measurements are plotted as open symbols and averages as larger, filled ones with the respective standard deviation. Blue nuclei densities are represented by blue symbols, red by red symbols and the calculated removed densities by black symbols.
Monolayer damage data for PDMS-based samples with HUVECs tested against glass probes presented as relative nuclei densities with respect to the compared areas. Dead cell densities are plotted in red, densities of healthy nuclei in blue and calculated removed densities in black. Individual measurements are plotted as open symbols, while averages are represented by filled symbols with standard deviation.
For 10 mN normal force, barely any cells were removed from the sample. So few cells were removed that for some slide areas, measurements of removed cell densities are below 0, which means that there were more cells in the slide area per unit area than in the reference areas, implying that cells were added in the process of sliding. This was likely owing to natural variances in the cell density of the monolayer. On average, −0.04% of cells were removed. 9.52% of cells were dead in the slide area, with respect to the density of healthy cells in the reference areas, and 91.57% were healthy. This means that essentially no cells were removed, and the damage is limited to individual cells being killed. The values for red and blue relative nuclei densities do not add up to 100% despite barely any cells being removed, which is again likely owing to variances in the initial nuclei density and the fact that relative nuclei densities are based on the blue nuclei density in the respective reference areas. For a normal force of 20 mN, still no significant amount of cells (−0.64%) was removed. However, more cells (13.44%) were dead for this increased normal load, which was naturally accompanied by a reduction in the rate of healthy cells in the slide area (88.12%). An increase in *F_N_
- to 40 mN caused 0.90% of cells to be removed. The rate of dead cells increased slightly further to 14.43%, while the amount of healthy nuclei decreased to 85.58%. Overall, the damage inflicted on the monolayer increased only slightly from 20 to 40 mN normal force. Finally, for a normal force of 80 mN, the amount of removed cells became significant as it increased to 6.70%. Also, the amount of dead nuclei increased further to 27.19%, while only 66.78% of cells remained in the slide area.
Friction
4.2.
PS dishes were coated with FN and seeded with HUVECs (PS + FN + HUVEC). Furthermore, PS dishes were coated with FN and tested without seeding cells on them (PS + FN). Dishes were then tested in the UMT2 against glass probes under the same conditions and with the same procedure used for soft substrate samples.
Static and dynamic friction forces of glass probes on PS + FN + HUVEC and PS + FN were extracted from the friction data as described earlier. The raw data for a 10 mN experiment on PS + FN are shown in figure 12. A noticeable degree of stick–slip was observed. In figure 13a,b, static and dynamic friction forces are plotted over the whole range of tested normal forces.
Raw friction force Fx and measured stage position hm data for a 10 mN friction test on a PS-based, FN-coated sample. Additionally, the height is approximated by a polynomial of fifth order hp and its slope ∂xhp are plotted. Values for force in the x direction before the experiment begin Fx,bm , static friction force Fx,s and friction force after movement began Fx,si are highlighted.
Static (a) and dynamic (b) friction of glass against FN-coated PS with and without HUVECs. Slope-adjusted static friction force F Fs,adj and slope-adjusted dynamic friction force F Fd,adj plotted over applied normal force FN . Individual measurements and averages with standard deviation are plotted in addition to a linear fit as per Amonton’s law; FF = µFN for both materials.
For the static friction, the value for the friction coefficient µ s,HUVEC = 0.511, as fitted with the linear model Amonton’s law suggests, is smaller than the one of just FN-coated PS (µ s,PS + FN = 0.544). For the dynamic condition, the friction coefficient µ d,HUVEC = 0.303 was significantly smaller than the one on the same substrate without cells (µ d,PS + FN = 0.497) and the one on just PS (µ d,PS = 0.474). It should be noted that especially for dynamic friction, the spread of the measured values is higher than it is when no cells are present. However, the highest measurement for the dynamic friction force is just below the ones of FN-coated PS. More friction results may be found in appendix C.
It should be noted that a cell remaining adhering to the probe may influence friction or adhesion between the sample and the probe. Figure 14 shows a glass probe before and after testing. Cell remains were clearly visible in fluorescence channels, showing that cell remains adhered to the probe.
Images of a glass probe after sliding over the monolayer with a normal force of 10 mN. Left: glass probe before testing. Right: after testing, stained with dapi and phalloidin. Top: blue channel images (dapi). Bottom: red channel images (phalloidin).
Discussion
For standard PS dishes with HUVECs, it was observed that the slide track was significantly wider than the Hertzian contact theory implies for a PS–glass contact. Furthermore, the width of the track did not increase to the extent suggested by Hertz with an increase in the normal force. The magnitude of the difference between the data and the Hertzian calculation is beyond the effects expected owing to limitations of the model such as adhesion, plastic deformation and nonlinear material parameters. It should be noted that the width of the track was measured based on damaged and removed cells, and in the Hertzian calculation, it was assumed that the cell layer was not playing a major role. From a purely mechanical standpoint, the assumption seems fair. However, the fact that cells are mechanically fragile compared with the other materials involved in the interaction may help to explain what is going on, focusing on the issues of deviations to the contact theory model and, consecutively, with the one of a minimal change in contact width with an increase in the normal force.
In the context of this work, a model was created based on Hertzian contact mechanics that explains the small change in the contact width with an increase in the normal force observed here. This model was also tested against previous work and was able to predict track widths there. Essentially, the phenomenon can be explained by the combination of two effects. First, the cell monolayer is soft and easily pierced, so the cells in a certain radius around the centre of the indentation are destroyed. This radius depends on the diameter of the probe. Once the cell monolayer is pierced, the PS absorbs the majority of the normal load, and since it has a fairly high Young’s modulus, deformations are small, causing the track width to only vary slightly with the normal force. The model is explained in more detail and applied to previous work in appendix D.
With regards to friction on cells cultured on PS, the question about the nature of the contact may be raised: are cells being tested or are they merely a lubricant between the PS dish and the glass sphere?
In figure 13a, the static friction data for PS + FN and PS + FN + HUVEC samples are plotted. Comparing the data in the figure indicates that cells do not have a major influence on the static friction force. This is also reflected by the static friction coefficients 0.544 and 0.511 for PS + FN and PS + FN + HUVEC, respectively. The friction force is slightly reduced. However, it is still much higher than the static friction force measured using soft substrate samples, where the pressures were much lower, and, hence, significantly more cells survived and remained in the track. As shown earlier, the static friction does not behave according to Amonton’s law for soft substrate samples, but for reference, the fitted static friction coefficient was 0.053. Also, on soft substrate samples, the qualitative friction force behaviour as a function of normal load is very different. Both PS-based samples’ results were in reasonably good accordance with Amonton’s law of friction, while the results using the soft substrate samples were not.
For the dynamic load condition, the difference between the PS + FN and the PS + FN + HUVEC samples was more significant, as is evident from the fitted dynamic friction coefficients 0.497 and 0.303, respectively. Despite being smaller, the values for PS + FN + HUVEC stand in stark contrast with the dynamic friction coefficient fitted from measurements on soft substrate samples, 0.018. The latter stands in much better accordance with literature values (Dunn et al. report a friction coefficient of µ = 0.03–0.06 [5]).
Figure 15 shows a possible reason for the small difference between PS + FN and PS + FN + HUVEC. The indentation process is shown at different stages. The sphere is shown as it just contacts the monolayer in position (a). In position (b), the cells in the centre of the contact are compressed to h crit and are thus about to burst. The probe is lowered further in position (c), destroying the cells and squeezing out their contents. Detail (d) shows the bursting. As the pressure gradient is directed outwards from the contact area, the cell bursts at the side. Cells mainly contain cytoplasm that is largely made up of water, so a good analogy is a balloon filled with water that is squeezed. It will burst somewhere at the side of the cell facing away from the centre of the contact area (i.e. it will burst in the direction of the pressure gradient). When that happens to the cells, most of the contents, like cell organelles, will be flushed out with the cytoplasm. As the sphere moves further down until it is in contact with the PS (i.e. the probe is fully loaded with the PS taking the main load), all liquid parts of the cell will be squeezed out and only viscous and elastic parts can remain. Those are mainly parts of the cell that were in some way attached to the substrate, such as the nucleus, parts of the cytoskeleton and the cell membrane, which are bound to the substrate through adherens junctions. At this point, an area will have formed where the glass and the PS are very close. This area will be approximately circular owing to the symmetrical geometry with the radius . Detail (f) shows this area on a microscopic level. The asperities of the glass and the PS may contact each other, as those materials are very hard compared with the cell organelles, and the pressures between the asperities can be expected to be very high. This would mean that in the static friction case, which has been preceded by 10 s of loading, the friction behaviour is largely equivalent to PS against glass, with some cell parts trapped in the asperities. This could be the reason why barely any difference was measured between PS + FN and PS + FN + HUVEC.
Schematic of the interaction between a glass sphere and a PS sample with HUVECs.
When the probe starts moving, more and more cell material comes into the contact area. As it is continuously moving, there may not be enough time for the probe to squeeze the more viscous cell parts out of the contact. Also, it is possible that at some point, the asperities of the sphere are saturated with cell matter. Both could lead to a separation of the asperities on a microscopic level as the cell matter is squashed between them. This would mean changing the dynamic of the contact mechanics and thus could be the reason for the observed reduction in the friction coefficient. In this case, the cells would act as a lubricant rather than as a surface in the interaction. This is supported by the observation that only 28.5% of the cells in the monolayer remain healthy, even for the lowest load tested, on PS samples.
The damage inflicted on the monolayer for different normal forces can still be differentiated for PS-based samples, so the point of absolute destruction has not been crossed. This means that the effect of the load regime on the monolayer damage can be studied. Factors that influence the severity of the load regime are certainly load, the underlying substrate parameters and relative velocity. As the velocity is the same in all experiments, the theoretical maximum Hertzian pressure between the probe and the substrate without HUVEC p_0_ may be a good indicator for the severity of the load condition, as it captures both load and material parameters. Also, pressure is an intuitive gauge of how damaging a load condition may be. In figure 16, this is visualized. Two datasets are plotted: the removed nuclei data for PDMS-based samples on the left and the equivalent for PS-based samples on the right. Both sets of data are plotted over the Hertzian contact pressure on the x-axis. The calculations were made for the respective substrate and an r = 1 mm glass probe. Note that the x-axis is in log scale, and there is a gap of two orders of magnitude between the two subplots. PDMS-based and PS-based experiments stand for mild- and harsh-load regimes, respectively, as indicated per the Hertzian pressure p_0_. When putting those two load regimes side by side, the bigger picture seems to become more apparent. For a mild-load regime, the cells are capable of remaining on the substrate to a large extent even if some die, as evident from the damage data and microscope images. However, the damage inflicted on the monolayer stays around zero and then rises relatively steeply towards the end of the mild-load regime. On the other hand, for the harsher-load conditions, the damage rises steeply but then seems to converge towards 1 (full destruction of the monolayer). Put together, the graphs look like they form the ends of a saturation curve, albeit the transition area between those ends is not depicted, and there is a large gap in between. Qualitatively, this makes sense, as for mild loads, few cells are being removed, while for harsh loads, nearly all are. Quantitatively, the large gap indicates that Hertzian pressure may not be the best measure for load regime severity. While the damage may be compared, the friction data may not because, as laid out earlier, it seems likely that the probe is considerably interacting with the underlying substrate as the monolayer is breached to a large extent for all cases tested on polystyrene.
Removed nuclei data on PDMS-based and PS-based samples against glass probes over Hertzian contact pressure.
Conclusions
In this article, a novel methodology was presented that can enable researchers to conduct ultra-low friction experiments under physiologically relevant conditions. Moreover, the presented protocols represent an affordable alternative to expensive microtribometers for groups that have access to a generic tribometer that can be used with low-load cells. Without soft substrate samples, however, the experimental set-up, as used in this work, is considered unable to test friction on cells cultured on polystyrene-based samples. Instead, the load conditions are so harsh that the monolayer is destroyed to a large extent, and consequently, a polystyrene substrate was tested against glass with the cell matter as a lubricant. This is evident from several observations. First, the majority of the monolayer was destroyed. As a large portion (46.3–80.3%) of cells do not remain in the track area, the probe has clearly penetrated the monolayer and must hence be interacting with the polystyrene to a large extent. As most cells are destroyed and the friction force in the dynamic case is significantly reduced, this implies that the remains of the cells are acting as some sort of lubricant. However, the friction forces are not reduced to a point where they would be comparable to literature values, or those collected on soft substrate samples. Overall, the load condition is simply too harsh for enough cells to survive in the track, which prevents testing the desired material pairing (cells against probe material). Experiments could still be conducted with different probe materials on PS samples; however, any differences in friction resulting from cell–probe interaction could not be easily differentiated from the ones resulting from cell-matter-lubricated PS–probe interaction. To ensure testing of the desired material pairing, a different, much more expensive, set-up would be required. However, differences in terms of damage caused to the monolayer were still measurable on PS samples and made sense when compared with the data collected on soft substrate samples, considering the harsher-load regime. It should be noted, however, that the indicator used to quantify the severity of the load condition here (p_0_) does not give credit to all factors that may influence the harshness for the cells and is thus almost guaranteed to not cover all cases of load conditions. This is evident from the large gap that extends over two orders of magnitude in figure 16. Furthermore, the friction data are not directly comparable between PS-based and PDMS-based samples as testing does not take place in the same load regime despite the same normal forces being used. The load cell that was used in this experiment was almost pushed to its upper limit by testing a normal force of 80 mN (the limit is 100 mN). To obtain a more continuous version of the plot and hence gain a broader view of the load regimes, soft substrate samples and the same type of probe could be used in conjunction with load cells capable of exerting higher loads. This would allow collecting data to cover the transition area and compare friction data over the whole range of load regimes, although still, at high loads, the substrate may be tested rather than the cells. For indentation, average Young’s modulus of vessel tissue is 125 kPa [12]. Clearly, the substrate used here is softer than this; however, compared to previous studies, the sample used here is closer to reality in terms of mechanical properties. In a future study, the PDMS could be adjusted to match physiological properties even better. The results of this work imply that tests conducted on monolayers cultured on hard substrates lack significance in terms of measuring damage and friction. This is because pressures are unrealistically high compared with practical applications, which destroys the monolayer and results in testing of the underlying material and not the cells. This means that in order to identify useful materials that could decrease friction and damage and in practice allow for less invasive interventions, soft substrates should be used. The probe images suggest that cells adhere to the probe. If this adhesion becomes too strong, the cells will be destroyed. Therefore, for practical applications, materials should be identified that exhibit low adhesive interactions with cells.
Misalignments within the friction testing set-up and unevenness of samples can cause significant deviations in the measured friction. The smaller the friction coefficient, the higher the influence of misalignments. While this effect has been accounted for in reciprocating experiments for dynamic friction, this work presents a new approach that also works for static and dynamic frictions of single-slide experiments. The soft substrate samples have proven an extremely affordable alternative to expensive microtribometers when used in conjunction with the approach to account for misalignments and unevenness. In the future, the methodology presented here may be used to conduct experiments using different probe materials and a range of load conditions to simulate more relevant in vivo conditions without the requirement for expensive equipment.
The reference list from the paper itself. Each links out to its DOI / PubMed record.
- 1Davim JP (ed). 2010 Biotribology. Hoboken, NJ: Wiley.
- 2Davim JP (ed). 2013 Biomaterials and medical tribology. Cambridge, UK: Woodhead Publishing. (10.1533/9780857092205) · doi ↗
- 3Davim JP . 2019 Mechanical behavior of biomaterials. Cambridge, UK: Woodhead Publishing.
- 4Chen YM , Kurokawa T , Tominaga T , Yasuda K , Osada Y , Gong JP , Yamamoto K , Ando J . 2010 Study on the sliding friction of endothelial cells cultured on hydrogel and the role of glycocalyx on friction reduction. Adv. Eng. Mater. 12 , B 628–B 636. (10.1002/adem.201080021) · doi ↗
- 5Dunn AC , Zaveri TD , Keselowsky BG , Sawyer WG . 2007 Macroscopic friction coefficient measurements on living endothelial cells. Tribol. Lett. 27 , 233–238. (10.1007/s 11249-007-9230-0) · doi ↗
- 6Pitenis AA , Urueña JM , Hart SM , O’Bryan CS , Marshall SL , Levings PP , Angelini TE , Sawyer WG . 2018 Friction-induced inflammation. Tribol. Lett. 66 , 81. (10.1007/s 11249-018-1029-7) · doi ↗
- 7Dunn AC , Sawyer WG , Sarntinoranont M , Tran-Son-Tay R . 2011 Mechanical response of living cells to contacting shear forces. In Cellular and biomolecular mechanics and mechanobiology (ed. A Gefen ), pp. 125–141. Berlin, Germany: Springer. (10.1007/8415_2010_23) · doi ↗
- 8Hart SM , Degen GD , Urueña JM , Levings PP , Sawyer WG , Pitenis AA . 2019 Friction-induced apoptosis. Tribol. Lett. 67 , 82. (10.1007/s 11249-019-1197-0) · doi ↗