Chlorophyll fluorescence characteristics and H2O2 contents of Chinese tallow tree are dependent on population origin, nutrients and salinity
Mengyue He, Lihong Ge, Xue Hui, Wenrao Li, Jianqing Ding, Evan Siemann

TL;DR
This study shows how Chinese tallow tree populations from the USA and China differ in their photosynthetic and antioxidant responses to nutrients and salt.
Contribution
The paper reveals how population origin, nutrients, and salinity affect chlorophyll fluorescence and H2O2 in an invasive plant.
Findings
Introduced population plants were larger but less resilient under saline or low-nutrient conditions.
Native plants had lower Fv/Fm under salinity, while introduced plants had lower electron transfer rates in high-nutrient conditions.
Hydrogen peroxide levels were lower in introduced populations, but increased with salinity and nutrient stress.
Abstract
Plants from invasive populations often have higher growth rates than conspecifics from native populations due to better environmental adaptability. However, the roles of improved chlorophyll fluorescence or antioxidant defenses in helping them to grow better under adverse situations are insufficient, even though this is a key physiological question for elucidating mechanisms of plant invasion. Here, we conducted experiments with eight native (China) and eight introduced (USA) populations of Chinese tallow tree (Triadica sebifera). We tested how salinity, nutrients (overall amount or N:P in two separate experiments) and their interaction affected T. sebifera aboveground biomass, leaf area, chlorophyll fluorescence and antioxidant defenses. Plants from introduced populations were larger than those from native populations, but salinity and nutrient shortage (low nutrients or high N:P)…
Genes, proteins, chemicals, diseases, species, mutations and cell lines named across the full text — each resolved to its canonical identifier and authoritative record.
Click any figure to enlarge with its caption.
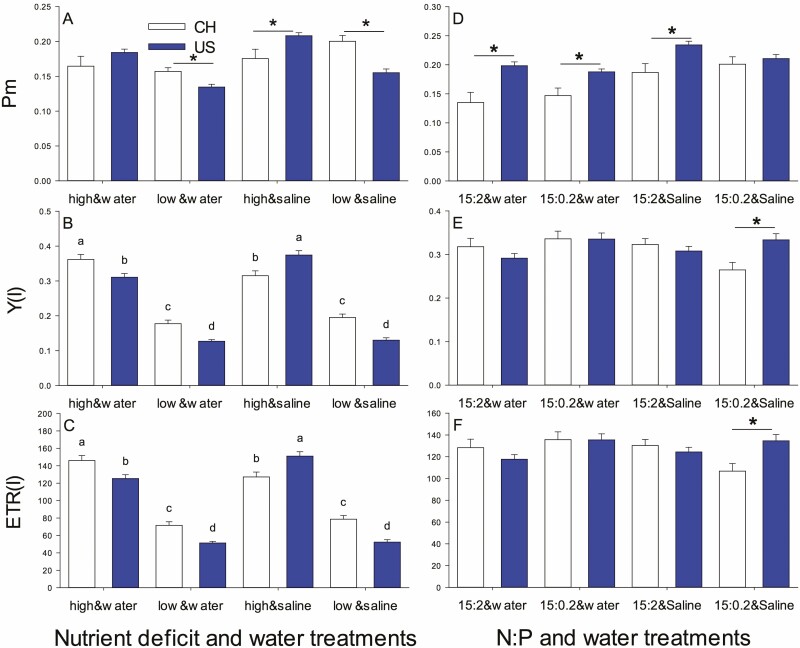 Figure 1
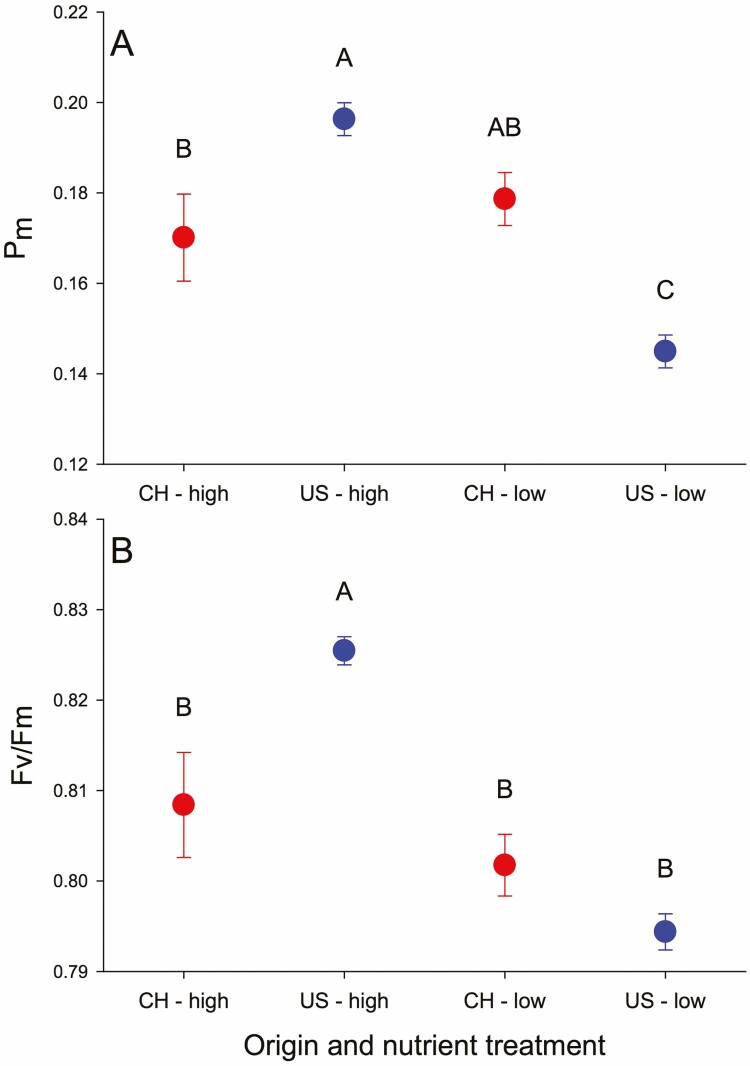 Figure 2
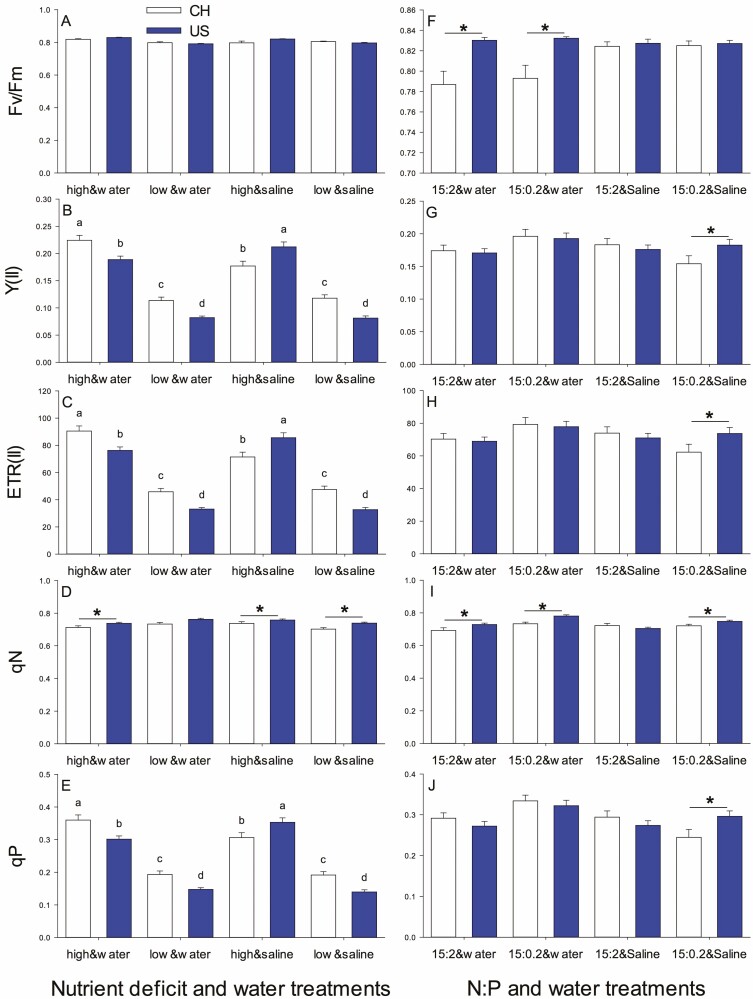 Figure 3
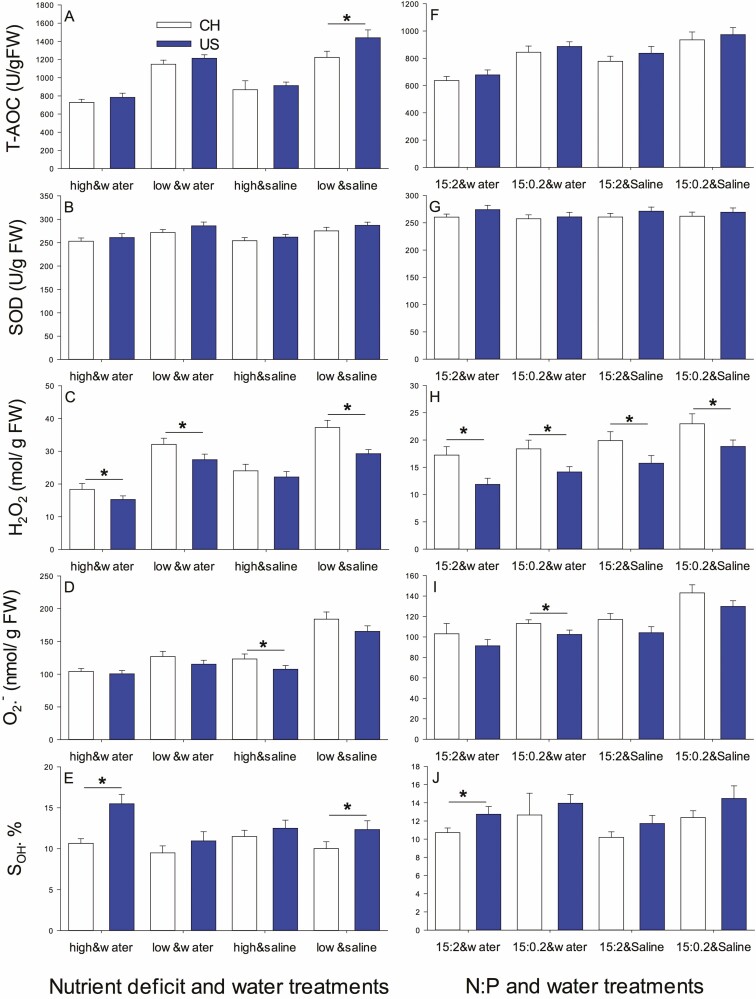 Figure 4
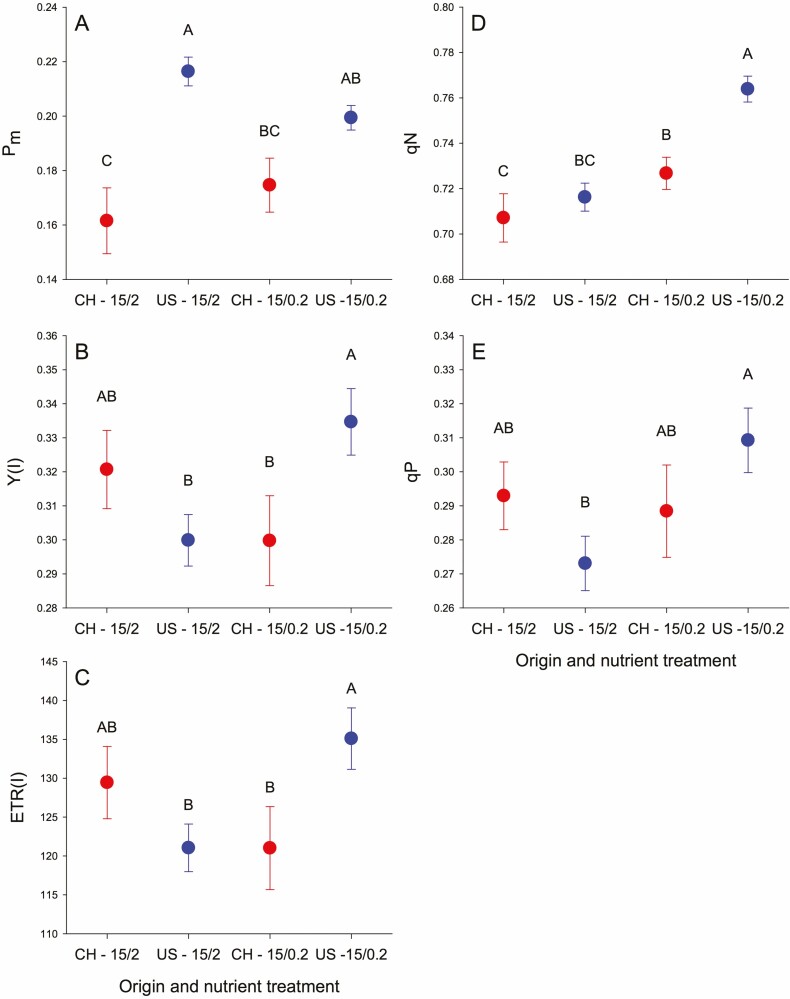 Figure 5
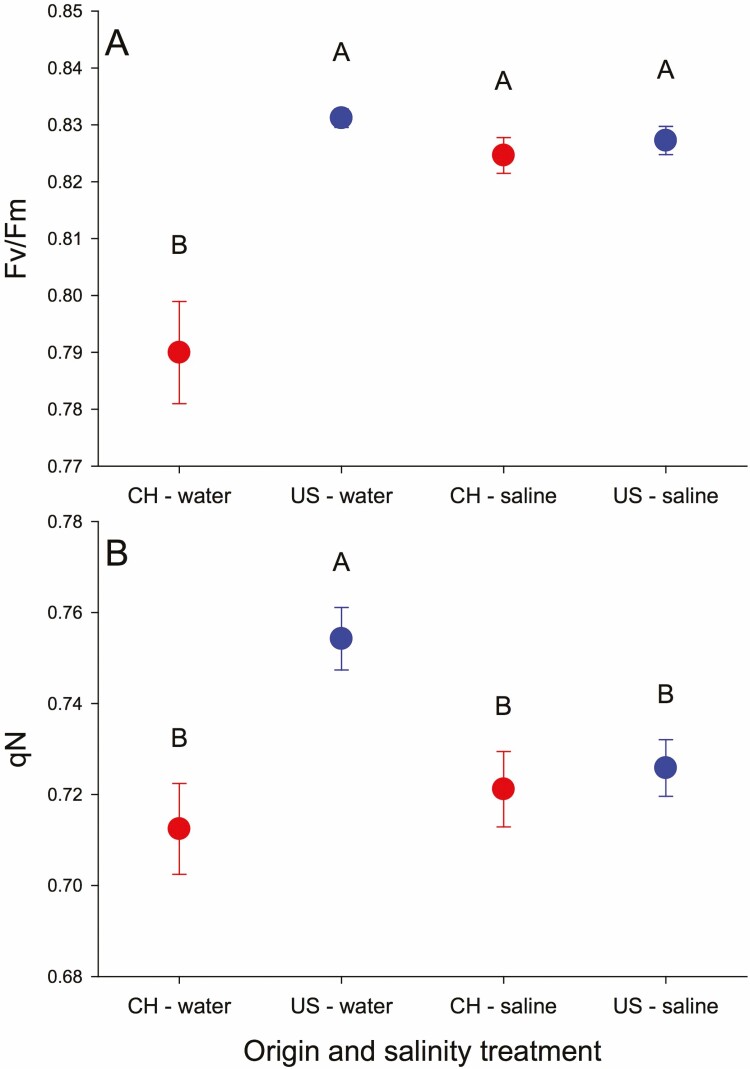 Figure 6
| Variable | DF | Nutrients | Salinity | Nutrients × salinity | Origin | Origin × nutrients | Origin × salinity | O × N × S | Pop (origin) | ||||||||
|---|---|---|---|---|---|---|---|---|---|---|---|---|---|---|---|---|---|
|
|
|
|
|
|
|
| P |
|
|
|
|
|
|
|
| ||
|
| |||||||||||||||||
| Leaf mass (g) | 231 |
|
|
|
|
|
|
|
|
|
|
|
|
|
|
|
|
| Stem mass (g) | 231 |
|
|
|
|
|
|
|
|
|
|
|
|
|
|
|
|
| Aboveground mass (g) | 231 |
|
|
|
|
|
|
|
|
|
|
|
|
|
|
|
|
| Leaf area (cm2) | 229 |
|
|
|
|
|
|
|
|
|
|
|
|
|
|
|
|
|
| |||||||||||||||||
|
| 168 |
|
|
|
| 1.55 | 0.2149 | 0.14 | 0.7164 |
|
| 0.32 | 0.5724 | 2.44 | 0.1203 |
|
|
| Y(I) | 168 |
|
| 1.57 | 0.2115 | 0.02 | 0.8774 |
|
|
|
|
|
|
|
| 1.52 | 0.0640 |
| ETR(I) | 168 |
|
| 1.55 | 0.2145 | 0.03 | 0.8711 |
|
|
|
|
|
|
|
| 1.53 | 0.0635 |
|
| |||||||||||||||||
|
| 168 |
|
| 1.59 | 0.2093 |
|
| 0.59 | 0.4565 |
|
| 0.45 | 0.5010 | 0.79 | 0.3748 | 2.00 | 0.0229 |
| Y(II) | 168 |
|
| 1.26 | 0.2632 | 2.16 | 0.1435 |
|
|
|
|
|
|
|
| 1.35 | 0.0884 |
| ETR(II) | 168 |
|
| 1.31 | 0.2546 | 2.19 | 0.1406 |
|
|
|
|
|
|
|
| 1.36 | 0.0874 |
| qN | 168 | 0.15 | 0.7007 | 0.21 | 0.6469 |
|
|
|
| 0.86 | 0.3537 | 0.06 | 0.8145 | 0.21 | 0.6467 | 1.48 | 0.0699 |
| qP | 168 |
|
| 0.22 | 0.6371 | 0.03 | 0.8591 | 4.30 | 0.0571 |
|
|
|
|
|
|
|
|
|
| |||||||||||||||||
| T_AOC (U g−1) | 170 |
|
|
|
| 0.04 | 0.8411 | 1.37 | 0.2621 | 1.34 | 0.2493 | 0.82 | 0.3674 | 1.07 | 0.3030 |
|
|
| SOD (U g−1) | 170 |
|
| 0.12 | 0.7340 | 0.02 | 0.8903 | 1.74 | 0.2087 | 0.31 | 0.5804 | 0.02 | 0.8903 | 0.01 | 0.9093 |
|
|
| H2O2 (µmol g−1) | 170 |
|
|
|
| 1.36 | 0.2453 |
|
| 2.65 | 0.1051 | 0.02 | 0.6531 | 0.91 | 0.3426 | 1.32 | 0.0928 |
|
| 170 |
|
|
|
|
|
| 2.35 | 0.1477 | 0.34 | 0.5592 | 0.94 | 0.3325 | 0.07 | 0.7966 |
|
|
|
| 170 |
|
| 0.010 | 0.9243 | 2.74 | 0.0997 |
|
| 0.71 | 0.4007 | 1.44 | 0.2321 | 3.63 | 0.0585 |
|
|
| Variable | DF | NP | Salinity | NP × salinity | Origin | Origin × NP | Origin × salinity | O × N × S | Pop (origin) | ||||||||
|---|---|---|---|---|---|---|---|---|---|---|---|---|---|---|---|---|---|
|
|
|
|
|
|
|
|
|
|
|
|
|
|
|
|
| ||
|
| |||||||||||||||||
| Leaf mass (g) | 233 | 2.08 | 0.1504 |
|
| 1.85 | 0.1749 |
|
|
|
|
|
| 0.11 | 0.7361 |
|
|
| Stem mass (g) | 232 | 0.84 | 0.3606 |
|
| 0.75 | 0.3864 |
|
|
|
|
|
| 0.03 | 0.8641 |
|
|
| Aboveground mass (g) | 233 | 0.62 | 0.4330 |
|
| 1.71 | 0.1929 |
|
|
|
|
|
| 0.06 | 0.8040 |
|
|
| Leaf area (cm2) | 231 |
|
|
|
| 1.98 | 0.1608 |
|
|
|
|
|
| 0.06 | 0.8008 | 1.62 | 0.0521 |
|
| |||||||||||||||||
| Pm | 168 | 0.08 | 0.7821 |
|
| 0.15 | 0.6975 |
|
|
|
| 2.33 | 0.1284 | 0.28 | 0.5963 |
|
|
| Y(I) | 168 | 0.52 | 0.4718 | 1.51 | 0.2203 |
|
| 0.29 | 0.5985 |
|
| 3.78 | 0.0537 | 2.02 | 0.1575 | 1.03 | 0.1516 |
| ETR(I) | 168 | 0.52 | 0.4705 | 1.53 | 0.2183 |
|
| 0.29 | 0.5995 |
|
| 3.79 | 0.0531 | 2.02 | 0.1574 | 1.04 | 0.1500 |
|
| |||||||||||||||||
|
| 168 | 0.23 | 0.6298 |
|
| 0.19 | 0.6601 |
|
| 0.07 | 0.7848 |
|
| 0.03 | 0.8562 |
|
|
| Y(II) | 168 | 0.86 | 0.3559 | 2.29 | 0.1321 |
|
| 0.15 | 0.7058 | 2.20 | 0.1402 | 1.22 | 0.2706 | 2.19 | 0.1409 |
|
|
| ETR(II) | 168 | 0.86 | 0.3556 | 2.33 | 0.1291 |
|
| 0.15 | 0.7026 | 2.19 | 0.1410 | 1.23 | 0.2685 | 2.21 | 0.1388 |
|
|
| qN | 168 |
|
| 1.83 | 0.1781 | 3.68 | 0.0569 | 3.08 | 0.1010 |
|
|
|
| 1.54 | 0.2156 |
|
|
| qP | 168 | 2.98 | 0.0863 |
|
|
|
| <0.01 | 0.9581 |
|
| 2.48 | 0.1173 | 2.83 | 0.0941 | 1.53 | 0.063 |
|
| |||||||||||||||||
| T_AOC (U g−1) | 170 |
|
|
|
| 1.20 | 0.2742 | 0.66 | 0.4307 | 0.03 | 0.8559 | 0.01 | 0.9146 | 0.03 | 0.8592 |
|
|
| SOD (U g−1) | 170 | 0.84 | 0.3603 | 0.33 | 0.5666 | 0.75 | 0.3883 | 0.78 | 0.3919 | 0.57 | 0.4531 | <0.01 | 0.9705 | 0.14 | 0.7112 |
|
|
| H2O2 (µmol g−1) | 170 |
|
|
|
| 0.56 | 0.4559 | 6.14 |
| 0.09 | 0.7595 | 0.13 | 0.7200 | 0.10 | 0.7485 |
|
|
|
| 170 |
|
|
|
| 3.47 | 0.0644 | 2.07 | 0.1723 | <0.01 | 0.9603 | 0.05 | 0.8192 | 0.01 | 0.9343 |
|
|
|
| 170 | 0.57 | 0.4531 |
|
| 0.18 | 0.6709 | 2.55 | 0.1325 | 0.12 | 0.7278 | 0.010 | 0.9061 | 0.15 | 0.7007 | 1.37 | 0.1749 |
- —National Science Foundation10.13039/100000001
Peer Reviews
No public reviews on file for this paper yet. If you reviewed it on a platform where reviews are public (OpenReview, ICLR, NeurIPS, ICML), you can paste yours below so the community can read it here.
Videos
No videos yet. Explain this paper in a talk, walkthrough, or lecture? Add one.
Taxonomy
TopicsPlant Stress Responses and Tolerance · Plant Ecology and Soil Science · Ecology and Conservation Studies
Introduction
Successful invasive plants often optimize their performance by evolving broad environmental tolerance, physiological characteristics or high phenotypic plasticity, including larger leaf area or specific leaf area and greater net photosynthesis rate compared with non-invasive native or alien species when faced with limited nutrient availability (Funk and Vitousek 2007; Funk 2013; Ordonez and Olff 2013; Pintó-Marijuan and Munné-Bosch 2013; Yang et al. 2015a; Morris et al. 2020; Li et al. 2023). However, the mechanisms that promote these dominant physiological characteristics under various abiotic conditions remain poorly understood (Funk and Vitousek 2007; Funk 2013; Pintó-Marijuan and Munné-Bosch 2013; Li et al. 2023).
Chlorophyll fluorescence characteristics can highlight the influence of environmental resources on photosynthesis and plant growth (Misra et al. 2012; Huang et al. 2015; Jiao et al. 2017; Deng et al. 2019). For instance, when faced with water stress or nutrient shortage, invasive species can exhibit changes in PSII maximum photochemical efficiency (Fv/Fm). For example, Juniperus virginiana maintained its initial Fv/Fm level under water stress (Bihmidine et al. 2010), while Melinis minutiflora experienced a decrease in Fv/Fm (Musso et al. 2021). Interestingly, fertilizer application did not affect the non-photochemical quenching coefficient (qN) (Musso et al. 2021). In the case of Triadica sebifera, introduced populations showed a higher PSII effective quantum yield (Y(II)) but lower Fv/Fm compared with native populations when grown in sterilized soil (Deng et al. 2019). Conversely, under high water stress conditions, invasive M. minutiflora exhibited higher Fv/Fm than native Schizachyrium microstachyum, and this difference was reduced with fertilization (Musso et al. 2021). Furthermore, the growth response and chlorophyll fluorescence characteristics of species can be influenced by different N:P ratios in the environment (Güsewell 2004; Li and Sun 2016). In a study by Jiao et al. (2017), reversible inactivation of PSII was observed in invasive Chlorella vulgaris under non-phosphorus control, as measured by chlorophyll fluorescence characteristics. These findings indicate that the performance of chlorophyll fluorescence in both introduced and native plants can reflect their ability to adapt to variations in resource availability, and may serve as a predictive tool in the case of new invasions.
Photosystem II is more sensitive to environmental conditions such as nutrient deficiency than PSI, which is considered relatively stable (Rochaix 2011; Tikkanen et al. 2014; Huang et al. 2015). Similar to PSII variables, PSI electron transfer (ETR(I)), PSI effective quantum yield (Y(I)) and PSI maximum photo-oxidizable P700 (Pm) suggest the improvement or inhibition of PSI electron transport may be due to environmental variables (Shimakawa and Miyake 2018). However, studies on introduced and native populations of invasive plants, particularly in terms of the simultaneous determination of PSI and PSII in response to different nutrient availabilities, are lacking.
Another important factor to consider with regard to electron transport in plants experiencing abiotic stresses, such as nutrient deficiency, is the excessive formation of reactive oxygen species (ROS) (Sharma et al. 2012; Bose et al. 2014; Mittler et al. 2022). Nutrient deficiency can disrupt plant growth and development by disturbing homeostasis and ion distribution within plant cells, causing ROS imbalance and affecting ROS production, accumulation, scavenging and transport (Mittler et al. 2022). Plants have developed several protective mechanisms to safeguard chloroplasts (Takahashi and Badger 2011; Huang et al. 2015). One such mechanism is enhancing qN, which is a physical process used to dissipate heat generated by excessive light energy and reduce ROS accumulation. Another mechanism is strengthening antioxidant substance activities or expression to scavenge ROS through chemical reactions. For instance, the superoxide anion radical ( ) is converted to hydrogen peroxide (H_2_O_2_) through the action of superoxide dismutase (SOD). This process can potentially lead to the formation of the hydroxyl radical (•OH) (Sharma et al. 2012; Mittler et al. 2022). SOD activity differs between native (S. microstachyum) and invasive (M. minutiflora) grasses under nutrient deficiency scenarios, suggesting that their oxidative responses may differ (Musso et al. 2021). Notably, when fertilized, SOD activity is higher for S. microstachyum than for the invasive M. minutiflora. Therefore, the ROS accumulation and scavenging ability accurately reflect the resistance and self-protection abilities against abiotic stress (Pintó-Marijuan and Munné-Bosch 2013; Mittler et al. 2022).
A number of studies have identified salt-induced reductions in photosynthesis as a result of negative effects on photosynthetic electron transport and the positive induction and production of ROS in plants (Pintó-Marijuan and Munné-Bosch 2013; Zhang et al. 2016; Pan et al. 2021). However, the effect of salinity on PS function is dependent on salt concentration, stress exposure time and plant species (Zahra et al. 2022). There have also been reports suggesting that mild salinity can act as an external stimulus, aiding plants in tolerating other stresses and promoting growth (Liu et al. 2023). Salinity may not only alter the Fv/Fm of plants but also help them resist low temperature stress by increasing the contents of chlorophyll and carotenoids (Liu et al. 2023), as well as enhancing low-temperature-induced antioxidant capacity (Li et al. 2015). Increased SOD activity in response to salinity has been documented in numerous invasive plants (Pintó-Marijuan and Munné-Bosch 2013; Zhang et al. 2016). Additionally, competition between salt ions and various nutrients can easily lead to mineral nutrient stress. However, further research is needed to clarify the roles of salt under different nutrient availability conditions in introduced versus native populations of invasive plants.
Chinese Tallow tree (T. sebifera), native to China, was first introduced to Georgia ~250 years ago and is now invasive throughout the southeastern USA (Pile et al. 2017). Common garden experiments showed that introduced populations of T. sebifera grow faster, with significantly larger shoot biomass and leaf area compared with plants from native populations (Siemann and Rogers 2003; Zou et al. 2007; Yang et al. 2015a, 2022; Li et al. 2020). Additionally, compared to native T. sebifera populations, invasive populations showed lower photosynthetic carbon cost and higher photosynthetic rates (Zou et al. 2007; Li et al. 2020). Studies also showed that the growth advantages of plants from introduced populations persist under saline conditions (Yang et al. 2015b, 2022). However, the physiological adaptability of introduced versus native populations to salinity and diverse nutritional environments remains unexplored. This knowledge gap hinders our comprehensive understanding of the invasion mechanisms.
Here, we measured chlorophyll fluorescence characteristics and antioxidant parameters in introduced and native populations of T. sebifera. Our aim was to determine if these traits vary among introduced and native populations under different nutrient environmental conditions. Specifically, we addressed the following questions: (i) How do the chlorophyll fluorescence characteristics and antioxidant capacity of T. sebifera respond to nutrient deficiency or high N:P ratio? (ii) How does salinity change these responses? (iii) Are these traits associated with the adaptations of introduced populations? The research findings will reveal the superior physiological traits that invasive plants have evolved, and by utilizing these characteristics, we can make preliminary assessments of a plant’s invasive availability.
Materials and Methods
Material selection and cultivation
In the fall of 2018, we collected seeds from healthy adult trees in eight populations within the native range and eight populations within the introduced range [**see Supporting Information—**Table S1]. We randomly combined mature seeds from several trees (6–10, widely spaced) within each population. We removed the waxy coatings on the seeds by soaking them in soapy water and scrubbing them. Then we surface sterilized them with dilute bleach and placed them in moist sand at 4 °C for 2–3 months. For a more detailed description, please refer to Li et al. (2020).
In May 2019, we sowed ~200 seeds from each population in a tray filled with a mixture of vermiculite and commercial topsoil that we placed in an unheated, open-sided greenhouse located in Kaifeng, China. We kept seeds and seedlings well watered.
Once seedlings had four leaves, we transferred them individually to PVC tubes (height = 24.5 cm, diameter = 6.3 cm) filled with 1000 g of dry, low-nutrient soil (total carbon: 6.43 g kg^−1^; total nitrogen: 0.002 g kg^−1^; available phosphorus: 0.82 mg kg^−1^). We placed the PVC tubes within the experimental area and repositioned them every 2 weeks during the growth period to ensure they received sufficient and uniform light.
Experimental designs
The nutrient deficiency and salinity experiment investigated the effects of nutrient levels (normal vs. deficient) and salinity (saline or not) on introduced vs. native tallow populations (eight of each) in a factorial experiment. We watered normal nutrient seedlings with 1/2 Hoagland’s nutrient solution (N = 7.5 mM, P = 1 mM, K = 3.5 mM plus micronutrients) and the nutrient-deficient seedlings with water. We added 5 g L^−1^ of NaCl to seedlings in saline treatments. In total, there were 448 seedlings (8 introduced populations and 8 native populations × 2 nutrient levels × 2 salinity levels × 7 replicates).
The N:P and salinity experiment investigated the effects of N:P ratios (15:2 vs. 15:0.2) and salinity (saline or not) on introduced vs. native tallow populations (8 of each) in a factorial experiment. We watered 15:2 nutrient (N = 15 mM, P = 2 mM, K = 7 mM plus micronutrients) and 15:0.2 nutrient seedlings (N = 15 mM, P = 0.2 mM, K = 7 mM plus micronutrients) with modified Hoagland’s nutrient solutions. We added 5 g L^−1^ of NaCl to seedlings in saline treatments. In total, there were 448 seedlings (8 introduced populations and 8 native populations × 2 N:P levels × 2 salinity levels × 7 replicates).
In each of the experiments, we used four replicates to measure biomass and leaf area. We used three of these four replicates to also measure chlorophyll fluorescence characteristics. We used the remaining three replicates to measure antioxidant defenses.
PS II and PS I parameter measurements
Three days prior to harvest, from 8:00 to 15:00, we determined chlorophyll fluorescence parameters using a portable modulated chlorophyll fluorometer (DUAL-PAM-100, Heinz Walz GmbH, Effeltrich, Germany) on the top 3 or 4 fully expanded leaves. Before measurement, we performed a dark adaptation treatment on the leaves for 30 min. We measured chlorophyll fluorescence parameters using the ‘SP-Analysis’ and ‘P700+Fluor’ Dual Channel modes, following the methods outlined by Huang et al. (2015).
To estimate the activity of photosystem II (PSII), we turned the measuring light on (less than 1 μmol m^−2^ s^−1^) and recorded the minimum fluorescence (F0) after dark adaptation. This was followed by a saturation pulse (300 ms and 10 000 μmolm^−2^ s^−1^), which interrupted the PSII reaction, and we recorded the maximum fluorescence (Fm) after dark adaptation. We calculated PSII maximum photochemical efficiency (Fv/Fm) using the formula Fv/Fm = (Fm−F0)/Fm, as described by Kitajima and Butler, (1975).
Next, we turned on the actinic light irradiation and gave a saturation pulse (300 ms and 10 000 μmol m^−2^ s^−1^) to record the chlorophyll fluorescence peak ( ) and steady-state fluorescence after light adaptation (F). Simultaneously, fluorescence quenching occurs and we obtained the photochemical quenching coefficient (qP = ) and non-photochemical quenching coefficient (qN = ) according to van Kooten and Snel (1990). We calculated the PSII photochemical quantum yield (Y(II)) and PSII electron transfer rate (ETR(II)) according to Y(II) = (Harbinson et al. 1989) and ETR(II) = PAR (photosynthetic active radiation, 962 μmol m^−2^ s^−1^) × 0.85 × 0.5 × Y(II), respectively. Here, 0.5 represents the proportion of absorbed light reaching photosystem I (PSI) or PSII, and 0.85 is the absorbed irradiance considered as 0.85 of the incident irradiance (Huang et al. 2015).
We first recorded the PSI maximum fluorescence signal (Pm) after dark adaptation to estimate the amount of photo-oxidizable PSI reaction centres. We then determined using a saturation pulse (300 ms and 10 000 μmol m^−2^ s^−1^) and actinic light irradiation (962 μmol m^−2^ s^−1^), similar to the process used for Pm. We recorded or calculated the parameters for PSI photochemical quantum yield (Y(I)), and PSI electron transfer rate (ETR(I)) in a similar way as Y(II) or ETR(II), as described by Tikkanen et al. (2014) and Huang et al. (2015).
Mass and leaf area
We removed the leaves of the seedlings and weighed them immediately. We determined the leaf area using a portable leaf area instrument (CI-203, CID, USA). We cut stems at ground level and weighed them to obtain the stem biomass.
Antioxidant parameters
We removed the top fully expanded 3–6 leaves from the set of plants, immediately put them into liquid nitrogen, took them back to the laboratory and stored them in a −80 °C refrigerator for determination of enzyme activity and ROS contents, scavenging rate and other antioxidant parameters. We determined the total antioxidant capacity (T-AOC), SOD activity, H_2_O_2_ contents, contents and scavenging rate of hydroxyl radical ( ) using Comin Biochemical Test Kits (Comin Biotechnology Co., Ltd., Suzhou, China) following the manufacturer’s instructions.
Statistical analyses
We conducted ANOVAs (PROC Mixed, SAS 9.4) to analyse the effects of treatments, as well as the interactions between treatments, on various parameters including biomass, leaf area, chlorophyll fluorescence characteristics and antioxidant parameters. The fixed factors considered in this analysis were treatments for nutrient deficiency/low phosphorus, salinity stress and population origin. The population nested in origin was considered as a random factor. To elucidate the relationship between antioxidant parameters and chlorophyll fluorescence parameters of PSI and PSII, we employed Pearson correlation and linear regression fitting. For all measurement values, we performed Pearson correlation, while for mean values, linear regression fitting was used. This was done to differentiate the adaptive strategies between native and introduced populations under distinct treatment conditions.
Results
Nutrient deficiency and salinity experiment
Mass parameters.
Leaf, stem and aboveground mass depended on the interaction of origin, nutrients and salinity with leaf mass for US populations higher in high nutrients but lower compared to China populations in low nutrients along with a negative effect of salinity (Table 1, Supporting Information—Fig. S1A). US populations always had higher stem mass, aboveground mass and leaf area with the greatest differences in high nutrients, especially in well-watered treatments when plants were the largest (Supporting Information—Fig. S1B–D).
PSI parameters.
US populations had higher Pm at high nutrients but lower Pm at low nutrients than China populations because nutrient deficiency only strongly decreased Pm of US populations (Table 1, origin × nutrients; Fig. 1A and Fig. 2A). The rest of the PSI parameters all depended on the interaction of origin, nutrients and salinity (Table 1). For Y(I) and ETR(I), this reflected decreases with low nutrients coupled with a switch from China populations greater than US ones in well water or salinity and low nutrients to US populations higher than China populations in salinity and high nutrients (Fig. 1B and C).
The Pm (A and D), Y(I) (B and E) and ETR(I) (C and F) in introduced (US, dark) and native (CH, light) populations in nutrient deficiency and water treatment experiment (experiment 1) (A–C) and N:P and water treatment experiment (experiment 2) (D–F). Asterisk represents significant differences between USA (introduced) and CH (native) populations at the same treatment level. Fig. A, D, E and F unmarked the letters because the interactions between treatments were not significant.
Effect of origin and nutrient treatment on Pm (A) and Fv /Fm (B) in introduced and native populations in nutrient deficit and water treatment experiment (experiment 1).
PSII parameters.
F v/Fm was higher for US populations in high nutrients compared to other origins × nutrient treatment combinations (Fig. 2A) and it was highest with high nutrients in water, lowest with low nutrients in water and intermediate with salinity (Table 1, Fig. 3A). Y(II) and ETR(II) each depended on origin × nutrients × salinity with the same patterns for means as these parameters in PSI (Table 1; Fig. 3B and C) and qP also had this pattern (Fig. 3E). qN was higher for USA vs. native populations (0.75 ± 0.01 vs. 0.72 ± 0.01) and it was lower with low nutrients in saline or high nutrients with water compared to the other nutrient × salinity treatment combinations (Table 1, Fig. 3D).
The Fv/Fm (A and F), Y(II) (B and G), ETR(II) (C and H), qN (D and I) and qP (E and J) in introduced (US, dark) and native (CH, light) populations in nutrient deficit and water treatment experiment (experiment 1) (A–E) and N:P and water treatment experiment (experiment 2) (F–J). Asterisk represents significant differences between USA (introduced) and CH (native) populations at the same treatment level. Fig. 3A, D, F, G, H, I and J unmarked the letters because the interactions between treatments were not significant.
AOX parameters.
T-AOC increased with low nutrients or salinity (Table 1, Fig. 4A). SOD increased with low nutrients (Table 1, Fig. 4B). H_2_O_2_ was higher for China populations (27.95 ± 1.22 vs. 23.54 ± 0.90 mol g^−1^ FW), at low nutrients or salinity (Table 1, Fig. 4C). increased with salinity, especially with low nutrients (Table 1, nutrients × salinity; Fig. 4D). was higher with high nutrients and for US populations (China: 10.41 ± 0.38 %, USA: 12.82 ± 0.56 %) (Table 1, Fig. 4E).
The T-AOC (A and F), SOD (B and G), H2O2 (C and H), O2−⋅ (D and I) and S⋅OH (E and J) in introduced (US, dark) and native (CH, light) populations in nutrient deficit and water treatment experiment (experiment 1) (A–E) and N:P and water treatment experiment (experiment 2) (F–J). Asterisk represents significant differences between USA (introduced) and CH (native) populations at the same treatment level. Fig. 4A–J unmarked the letters because the interactions between treatments were not significant.
Correlations among variables.
All the mass variables were strongly positively correlated with each other. Mass variables were most strongly positively correlated with PSI variables Y(I) and ETR(I), PSII variables Fv/Fm, Y(II), ETR(II) and qP. Mass variables were most strongly negatively correlated with the antioxidant variables T-AOC, H_2_O_2_ and Y(I) and ETR(I) were all strongly positively correlated. Fv/Fm, Y(II) and ETR(II) were strongly positively correlated. The antioxidant variables, T-AOC, SOD, H_2_O_2_ and were generally negatively correlated with PSI and PSII variables.
N:P and salinity experiment
Mass parameters.
Leaf, stem and aboveground mass plus leaf area all depended on the interaction of origin, nutrients and salinity with leaf mass for US populations always higher (Table 2, Supporting Information—Fig. S1E–H). All of these variables were lower at NP 15:0.2 or salinity for the USA but they were always low for China populations so the differences between US and China populations were highest at NP 15:2 in water and lowest at NP 15:0.2 with salinity (Supporting Information—Fig. S1E–H).
PSI parameters.
P m was higher for US populations at NP 15:2 but US populations tended to decrease and China populations tended to increase at NP 15:0.2 so they were comparable with lower P (Table 2, Fig. 1D, Fig. 5A). Pm also increased with salinity. Y(I) and ETR(I) tended to be higher for China populations at NP 15:2 but US populations were significantly higher at NP 15:0.2 (Table 2, Fig. 1E and F). Y(I) and ETR (I) also depended on NP × salinity with each being highest at NP 15:0.2 and water, intermediate at NP 15:2 and saline and lower in the other two combinations (Fig. 5B and C).
Effect of origin and nutrient treatment on Pm (A), Y(I) (B), ETR(I)(C), qN(D) and qP (E) in introduced and native populations in N:P and water treatment experiment (experiment 2).
PSII parameters.
F v/Fm was low for China populations in water compared to other combinations of origin and salinity (Table 2, Fig. 3A, Fig. 6A). Y(II) and ETR(II) depended on NP × salinity with each being highest at NP 15:0.2 and water, intermediate at NP 15:2 and saline and lower in the other two combinations (Fig. 3G and H). US and China populations both had lower qN at NP 15:2 but US populations increased more at NP 15:0.2 so they were higher than China populations (Table 2, Fig. 3I, Fig. 5D). US populations in water had higher qN than other origin × salinity combinations (Fig. 6B). US populations had high qP at NP 15:0.2 with salinity and low qP in NP 15:2 and water with China populations intermediate (Table 2, Fig. 3J, Fig. 5E). qP also depended on NP × salinity in a pattern similar to Y(II) and ETR(II).
Effect of origin and salt stress on Fv/Fm (A) and qN (B) in introduced and native populations in N:P and water treatment experiment(experiment 2).
AOX parameters.
T-AOC, H_2_O_2_, and all were higher at NP 15:0.2 with saline (Table 2, Fig. 4F–J). SOD did not depend on any factors (Table 2, Fig. 4G).
Correlations among variables.
All the mass variables were strongly positively correlated with each other. Mass variables were most positively correlated with PSI variables Pm, PSII variables Fv/Fm and the antioxidant variables . The PSI variables Y(I) and ETR(I) were strongly positively correlated. The PSII variables Y(II), ETR(II) and qP were strongly positively correlated. The antioxidant variables T-AOC and H_2_O_2_ were strongly positively correlated.
Discussion
Previous studies have reported the detrimental effects of nutrient deficiency and salinity on invasive plants, particularly in terms of their growth and photosynthetic phenotype characteristics (Funk and Vitousek 2007; Funk 2013; Pintó-Marijuan and Munné-Bosch 2013; Yang et al. 2015a, b, 2022; Guo et al. 2023). They also indicated that an appropriate amount of salt has a promoting effect on the growth and development of plants, enhancing their stress resistance (Li et al. 2015; Liu et al. 2023). This research in seedlings emphasizes how the better-photosynthetic-tolerant introduced populations outperform the native populations using chlorophyll fluorescence and antioxidant performance under different nutrient availability or combined with mild salinity conditions. We found that the chlorophyll fluorescence performance of T. sebifera depended on origin, nutrient levels and salinity. However, although the introduced populations showed obvious growth advantages with higher Fv/Fm and Pm, it did not demonstrate significant antioxidant advantages except demonstrating less accumulation of H_2_O_2_, when faced with nutrient deficiency/high N:P or mild salinity compared with native populations. Therefore, this research provides a valuable dataset for investigating adaptive strategies to nutrient deficiency/NP ratio or salinity habits associated with plant invasions.
Introduced populations exhibit stronger nutrient deficiency inhibition without salinity, but with less H2O2 accumulating
Biomass accumulation and leaf area enlargement were inhibited significantly in both introduced and native populations by nutrient deficiency. However, biomass and leaf area in introduced populations were obviously greater than those in native populations regardless of treatments. These results are consistent with the findings of Funk (2013) and supported by other studies on T. sebifera (Yang et al. 2015a; Deng et al. 2019). A lack of sufficient macro- and micronutrients may decrease chlorophyll contents and inhibit the number of photosynthetic apparatus (Qi et al. 2013; Li and Sun 2016), which, in turn, reduces the photochemical efficiency and quantum yield of PSII and PSI by changing electron transfer pathway (such as from cyclic to pseudocyclic electron transport) or hindering electron transfer to the electron transport chain (Misra et al. 2012; Li and Sun 2016; Latifinia and Eisvand 2022), as shown in Fig. 1 and Fig. 3, subsequently leading to a decrease in biomass. Notably, there was a considerable decrease in Fv/Fm and Pm caused by nutrient deficiency in introduced populations but not in native populations, indicating that introduced populations experienced greater inhibition (Fig. 2). On the other hand, the changing of electron transport may result in excessive production of , which is converted to H_2_O_2_, ultimately leading to H_2_O_2_ accumulation (Zahra et al. 2022). Nevertheless, there was less H_2_O_2_ accumulation in introduced populations. It is probably because they were able to compensate for the negative effects by generating a greater thermal dissipation (qN, Fig. 3D) and faster or more efficient removal of H_2_O_2_, such as higher in an introduced population (Fig. 4E), which strengthened self-protection and reduced damage to the photosynthetic membrane, and allowed for larger relative growth (Takahashi and Badger 2011; Pintó-Marijuan and Munné-Bosch 2013). Simultaneously, a similar increase in T-AOC, SOD and between introduced and native populations suggests that introduced and native T. sebifera plants employ similar SOD strategies but different H_2_O_2_ scavenge pathways when faced with nutrient deficiency.
Introduced populations were more adapted to NP15:2, while native populations were more adapted to NP15:0.2 without salinity
When there was no salinity, compared with NP15:2, NP15:0.2 promoted a significant increase in the biomass and leaf area of native populations, but brought about a significant decrease in leaf area for introduced populations, although NP15:0.2 increased the photosynthetic quantum yield and electron transfer rate for both populations. This suggests that introduced populations were better adapted to NP15:2, while native populations were better adapted to NP15:0.2. The slight increase in T-AOC, H_2_O_2_ and under NP15:0.2 and increased qN reflected a self-protective mechanism against phosphorus deficiency in plants for both populations (Goussi et al. 2021). Unutilized light energy is dissipated through heat, and electrons are unable to fully transfer to the corresponding acceptor, such as NADPH, leading to pseudocyclic electron transport or other electron transport types, and subsequent accumulation of ROS (H_2_O_2_ and ) under NP15:0.2 (Asada 2006; Sharma et al. 2012; Bose et al. 2014; Rajput et al. 2021), especially for native population because of their slight lower (Fig. 4J). The increased photosynthetic quantum yield and electron transfer rate under NP15:0.2 may be due to an increase in chlororespiration (Wiciarz et al. 2015) stimulated by less phosphorus. Simultaneously, NP15:2 may provide additional phosphorus to support RNA synthesis in introduced populations. This preference for phosphorus can aid in the maintenance of introduced plant mass and larger leaf area (Rivas-Ubach et al. 2012; Esterhuizen et al. 2020).
Introduced populations subjected to growth inhibition induced by mild salinity show lower H_2_O_2_ accumulation and better growth than native populations.
Our results are in agreement with those of previous studies showing inhibition of T. sebifera mass accumulation and leaf area expansion under salt stress regardless of nutrient/N:P level (Chen et al. 2013; Yang et al. 2015a, b, 2022). This could be attributed to a decrease in cell growth expansion caused by a reduction in turgor pressure resulting from decreased water availability to the roots (Goussi et al. 2021). These studies also demonstrated a high tolerance of introduced populations of Chinese tallow tree to mild salinity (Chen et al. 2013; Yang et al. 2015a, b, 2022), since salinity can enhance the net positive effects of this species on soil, particularly in introduced populations. In the two experiments here, the lower H_2_O_2_ accumulation and slightly higher of introduced populations, suggesting better ROS scavenging and better growth, especially in high nutrient conditions, further support this conclusion. The results are similar to those of an interspecific study by Musso et al. (2021) in which an invasive species (M. minutiflora) showed a higher effect of water than a native species (S. microstachyum) when soil nutrients were more abundant. However, chlorophyll fluorescence performance of T. sebifera under salinity depended on origin and nutrient/N:P, as discussed below.
Mild salt induces more limited chlorophyll fluorescence changes in introduced populations than in native ones under high nutrient levels
Under high nutrient conditions, mild salinity stimulated photosynthetic electron transport and photosynthetic quantum yield for both introduced and native populations, possibly due to pronounced ROS production (particularly H_2_O_2_) from the plastoquinone pool and increased chlororespiration (Wiciarz et al. 2015; Manaa et al. 2019; Goussi et al. 2021) or slight incline of the rates of energy capture and dissipated energy flux (Goussi et al. 2021). Simultaneously, mild salt did not alter Fv/Fm of introduced populations but it decreased Fv/Fm of native populations. This may be due to salinity causing greater accumulation of H_2_O_2_ (Fig.4H), weaker (Fig. 4J) and inhibiting PSII repair in native populations compared with introduced populations (Bose et al. 2014). Together with unchanged heat dissipation (qN, Fig. 3I) in introduced populations, these changes may reflect a physiological response of introduced plants to adapt to saline environments and maintain the stability of PSII and PSI (Goussi et al. 2021). By contrast, this suggests salt-induced more severe impact on plants of native population in nutrient-rich environments than on plants from introduced populations.
Mild salt does not exacerbate the growth inhibition induced by low nutrients in both introduced and native populations
The responses of plants to combinations of stress factors are highly complex (Goussi et al. 2021). Compared with low-nutritve treatments, our experiment showed that salinity did not further enhance the growth inhibition caused by low nutrients. The increased Pm, while other chlorophyll fluorescence parameters were unchanged in both introduced and native populations, suggests that electron transport to PSI was strengthened without affecting the photochemical ability of PSII (Huang et al. 2015). This may be caused by slight damage to the photosynthetic process due to an imbalance in Na^+^ ions (Acosta-Motos et al. 2017). It may also indicate why the plants still showed a slight increase in T-AOC and accumulation of and H_2_O_2_, especially in the native population. Other scavengers may function in mesophyll cells (Morais et al. 2012). Previous research on native vs. invasive species confirmed that under salt stress, invasive Acacia longifolia was more effective than native Ulex europaeus in improving adaptability to adverse environments (Morais et al. 2012). However, in our intraspecific study, introduced populations did not exhibit better performance under salt stress and nutrient deficiency except for lower H_2_O_2_ accumulation. Therefore, we speculate that a similar antioxidant strategy in both populations may explain why mild salinity did not further exacerbate the low nutrient-induced inhibition.
Mild salt-induced a negative effect only in native populations under NP15:0.2
Under NP15:2, salt treatment only increased Pm and caused fluctuations in Fv/Fm in native populations while all other chlorophyll fluorescence parameters were unaffected. The increase in Pm might be due to the enlargement of the active reaction centre antennae induced by salinity, as discussed above (salt treatment under high nutrients; Goussi et al. 2021). In addition, salt ions such as Na^+^ have different effects on the degree of opening of the PSII reaction centre, and can decrease F0 (from 0.203 ± 0.004 to 0.188 ± 0.003) in native populations.
On the other hand, Oliveira et al. (2014) reported that native Anadenanthera colubrina and invasive Prosopis juliflflora showed different responses to leaf phosphorus supply under water stress for several measured variables. In our experiment, only under NP15:0.2 were similar conclusions obtained for both native and introduced populations of Chinese tallow trees. Under NP15:0.2, the decrease in photosynthetic electron transport rate and photosynthetic quantum yield only in native population plants induced by salinity suggests that salinity has a stronger negative effect on native populations than introduced populations. Slightly less H_2_O_2_ and contents and higher in introduced populations, meaning less damage by salinity, further supports this conclusion (Mittler et al. 2022). Together, these findings indicate that introduced populations were adapted better to salinity under NP15:0.2, which might also be related to stronger symbiosis with arbuscular mycorrhizal fungi (AMF), as demonstrated for introduced T. sebifera in which salt promoted symbiosis with AMF and improved resistance (Yang et al. 2015a, b).
Conclusion
Our results indicate that nutrient deficiency caused more severe growth inhibition in both introduced and native T. sebifera populations compared with mild salinity, though both nutrient deficiency and salinity lowered ETR and photochemical quantum yield (Yield), while high N:P (15.0.2) had no such effect. Introduced population plants were larger, partly due to their higher Fv/Fm and Pm, especially under high nutrient and either N:P conditions. Increased ETR and Yield of introduced population plants under combined treatment of salinity with high nutrient or high N:P (15.0.2) might be responsible for its better growth. However, introduced populations appear to have a better capacity for resisting salinity rather than nutrient shortage. Furthermore, total antioxidant capacity was similar between introduced and native populations apart from lower H_2_O_2_ in introduced population plants, which seems to be a key factor for the better adaptation. Though qN was higher in introduced populations implying stronger heat dissipation capacity, it did not have a significant relationship with biomass. These findings suggest that chlorophyll fluorescence and H_2_O_2_ advantages in introduced seedlings might contribute to their better growth when invading nutrient-rich or low N:P conditions or in combination with mild salinity environments. So the stronger photosynthetic capacity in the seedlings of the introduced T. sebifera, coupled with low levels of oxidative damage, can provide a solid physiological foundation for being tree.
Supporting Information
The following additional information is available in the online version of this article –
Figure S1. Mass on introduced and native populations under nutrient deficit and water treatment experiment (experiment 1, A-D) and N:P and water treatment experiment (experiment 2, E-H). Asterisk represents significant differences between US and CH populations at the same treatment level. Fig E-H unmarked the letters because the interactions between treatments were not significant.
Figure S2. Correlations between parameters in nutrient deficit and water treatment experiment (experiment 1) (A) and N:P and water treatment experiment (experiment 2) (B).
Table S1. Populations used in two experiments.
Data files supporting the findings of this study
plae024_suppl_Supplementary_Table_S1_Figures_S1-S2
plae024_suppl_Supplementary_Data
The reference list from the paper itself. Each links out to its DOI / PubMed record.
- 1Acosta-Motos JR, Ortuño MF, Bernal-Vicente A, Diaz-Vivancos P, Sanchez-Blanco MJ, Hernandez JA. 2017. Plant responses to salt stress: adaptive mechanisms. Agronomy 7:18.
- 2Bihmidine S, Bryan NM, Payne KR, Parde MR, Okalebo JA, Cooperstein SE, Awada T. 2010. Photosynthetic performance of invasive Pinus ponderosa and Juniperus virginiana seedlings under gradual soil water depletion. Plant biology (Stuttgart, Germany) 12:668–675.20636910 10.1111/j.1438-8677.2009.00251.x · doi ↗ · pubmed ↗
- 3Bose J, Rodrigo-Moreno A, Shabala S. 2014. ROS homeostasis in halophytes in the context of salinity stress tolerance. Journal of Experimental Botany 65:1241–1257.24368505 10.1093/jxb/ert 430 · doi ↗ · pubmed ↗
- 4Chen L, Tiu CJ, Peng S, Siemann E. 2013. Conspecific plasticity and invasion: invasive populations of Chinese tallow (Triadica sebifera) have performance advantage over native populations only in low soil salinity. P Lo S One 8:e 74961.24040366 10.1371/journal.pone.0074961 PMC 3764045 · doi ↗ · pubmed ↗
- 5Deng B, Liu X, Zheng L, Liu Q, Guo X, Zhang L. 2019. Effects of nitrogen deposition and UV-B radiation on seedling performance of Chinese tallow tree (Triadica sebifera): a photosynthesis perspective. Forest Ecology and Management 433:453–458.
- 6Esterhuizen N, Forrester J, Esler KJ, Wigley-Coetzee C, Morcillo RJ, Kleinert A, Pérez-Fernández M, Valentine AJ. 2020. Nitrogen and phosphorus influence Acacia saligna invasiveness in the fynbos biome. Plant Ecology 221:309–320.
- 7Funk JL. 2013. The physiology of invasive plants in low-resource environments. Conservation Physiology 1:cot 026–cot 026.27293610 10.1093/conphys/cot 026PMC 4806624 · doi ↗ · pubmed ↗
- 8Funk JL, Vitousek PM. 2007. Resource-use efficiency and plant invasion in low-resource systems. Nature 446:1079–1081.17460672 10.1038/nature 05719 · doi ↗ · pubmed ↗