Correction: Huang et al. Identification of Unique and Conserved Neutralizing Epitopes of Vestigial Esterase Domain in HA Protein of the H9N2 Subtype of Avian Influenza Virus. Viruses 2022, 14, 2739
Xiangyu Huang, Guihu Yin, Yiqin Cai, Jianing Hu, Jingwen Huang, Qingtao Liu, Xiuli Feng

Abstract
Genes, proteins, chemicals, diseases, species, mutations and cell lines named across the full text — each resolved to its canonical identifier and authoritative record.
Click any figure to enlarge with its caption.
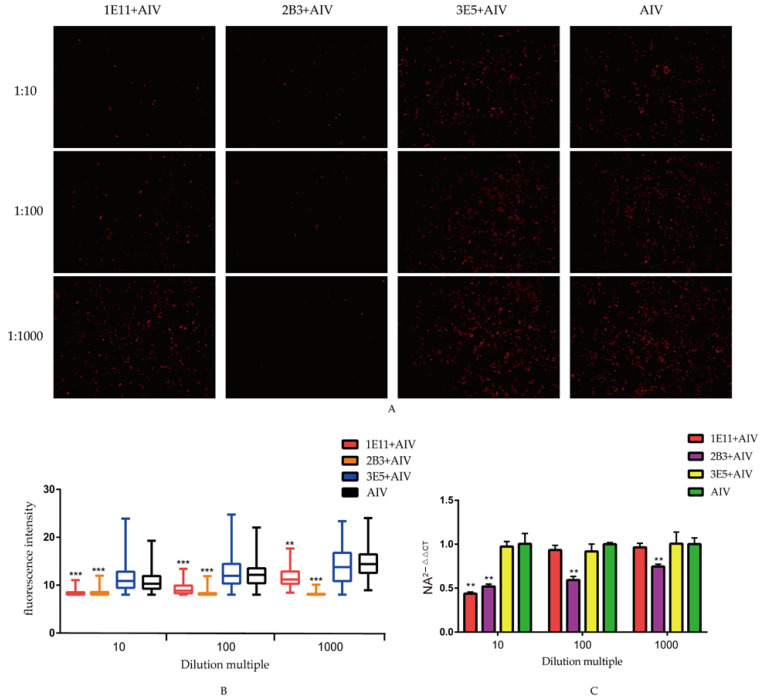 Figure 4
Peer Reviews
No public reviews on file for this paper yet. If you reviewed it on a platform where reviews are public (OpenReview, ICLR, NeurIPS, ICML), you can paste yours below so the community can read it here.
Videos
No videos yet. Explain this paper in a talk, walkthrough, or lecture? Add one.
Taxonomy
TopicsInfluenza Virus Research Studies · Respiratory viral infections research · Animal Virus Infections Studies
Error in Figure 4A
In the original publication [1], the images of 3E5+AIV at 1:10 and 1:100 in “Figure 4A” were duplicated. “Due to an oversight, the manuscript was published with two duplicated images. Given the importance of this information and that the updated image of 3E5+AIV at 1:10 in Figure 4A is provided by the authors, an update of this data is hereby requested”. The corrected “Figure 4” appears below. This correction was approved by the Academic Editor. The original publication has also been updated.
Neutralization assay: (A) neutralization effect of the screen mAbs. AIV were co-incubated with three mAbs and infected MDCK cells for 36 h. AIV proliferation in cells was analyzed by the indirect immunofluorescence to analyze the neutralization effect of mAbs; (B) the fluorescence intensity in the infected MDCK cells. The software ImageJ was used to quantify the fluorescence intensity of the indirect immunofluorescence images, and the data were represented in Graphpad for the differential analysis; and (C) the mRNA levels of NA in MDCK cells. Cells and supernatant total RNA were extracted for real-time fluorescent quantitative PCR, followed by differential analysis using Graphpad. All data were presented as mean ± SD. ** p < 0.01, and *** p < 0.001.
The reference list from the paper itself. Each links out to its DOI / PubMed record.