Chromosomal-level genome assembly and single-nucleotide polymorphism sites of black-faced spoonbill Platalea minor
Jerome H. L. Hui, Jerome H. L. Hui, Ting Fung Chan, Leo Lai Chan, Siu Gin Cheung, Chi Chiu Cheang, James Kar-Hei Fang, Juan Diego Gaitan-Espitia, Stanley Chun Kwan Lau, Yik Hei Sung, Chris Kong Chu Wong, Kevin Yuk-Lap Yip, Yingying Wei, Wai Lok So, Wenyan Nong, Sean Tsz Sum Law

TL;DR
This paper presents the first detailed genome assembly of the black-faced spoonbill, an endangered bird, to aid in understanding its biology and conservation.
Contribution
The study provides the first chromosomal-level genome assembly and SNP data for the black-faced spoonbill.
Findings
A chromosomal-level genome assembly of 1.24 Gb was created with 95.33% sequences anchored to 31 pseudomolecules.
The assembly includes 18,780 predicted protein-coding genes and a high BUSCO score of 97.3%.
Over 6 million bi-allelic SNPs were identified, covering ∼5% of the genome.
Abstract
Platalea minor, or black-faced spoonbill (Threskiornithidae), is a wading bird confined to coastal areas in East Asia. Due to habitat destruction, it was classified as globally endangered by the International Union for Conservation of Nature. However, the lack of genomic resources for this species hinders the understanding of its biology and diversity, and the development of conservation measures. Here, we report the first chromosomal-level genome assembly of P. minor using a combination of PacBio SMRT and Omni-C scaffolding technologies. The assembled genome (1.24 Gb) contains 95.33% of the sequences anchored to 31 pseudomolecules. The genome assembly has high sequence continuity with scaffold length N50 = 53 Mb. We predicted 18,780 protein-coding genes and measured high BUSCO score completeness (97.3%). Finally, we revealed 6,155,417 bi-allelic single nucleotide polymorphisms,…
Genes, proteins, chemicals, diseases, species, mutations and cell lines named across the full text — each resolved to its canonical identifier and authoritative record.
Click any figure to enlarge with its caption.
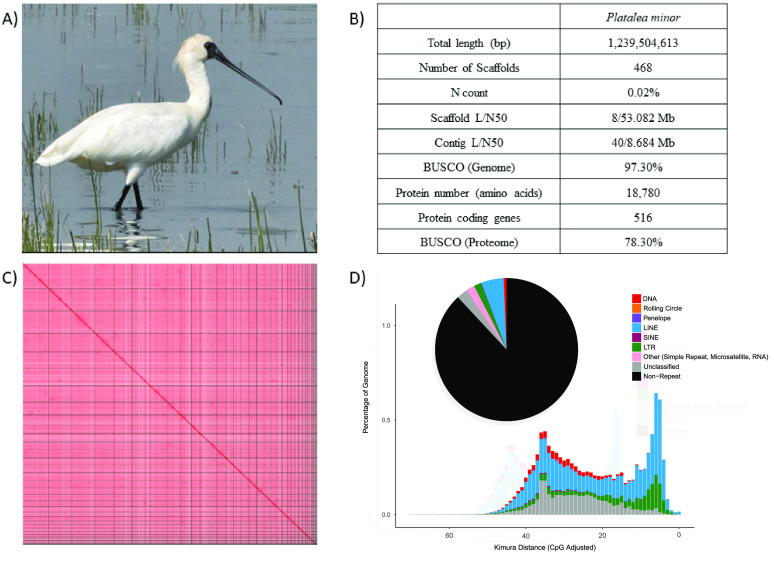 Figure 1
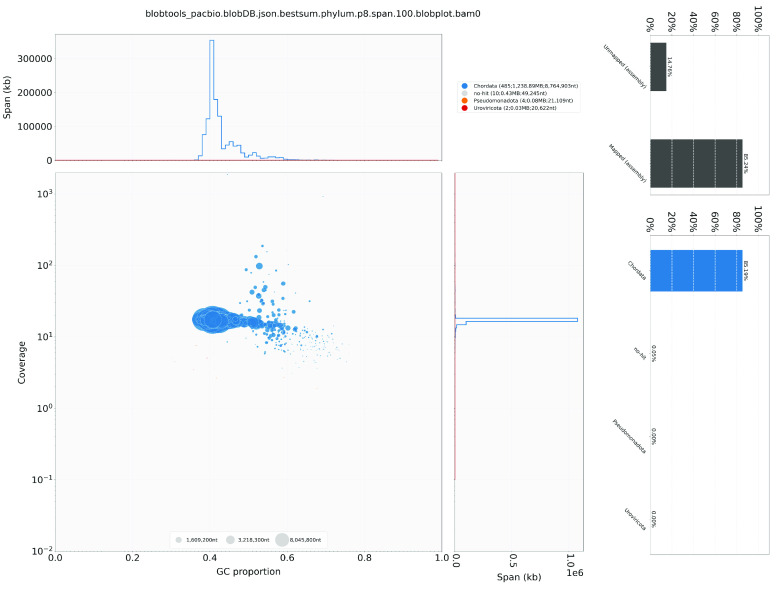 Figure 2
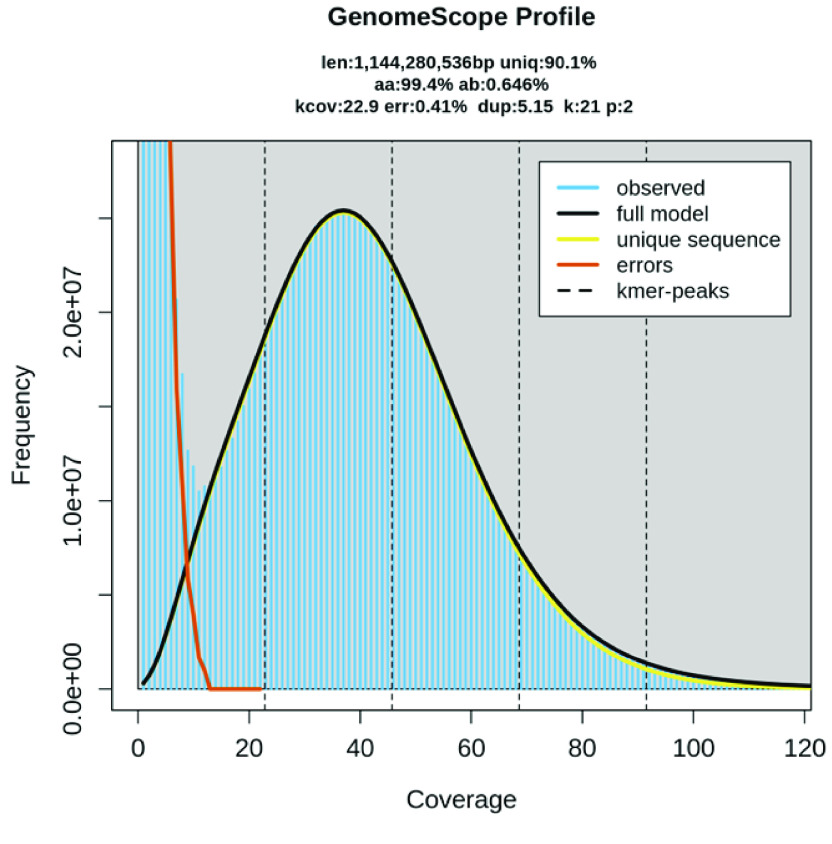 Figure 3
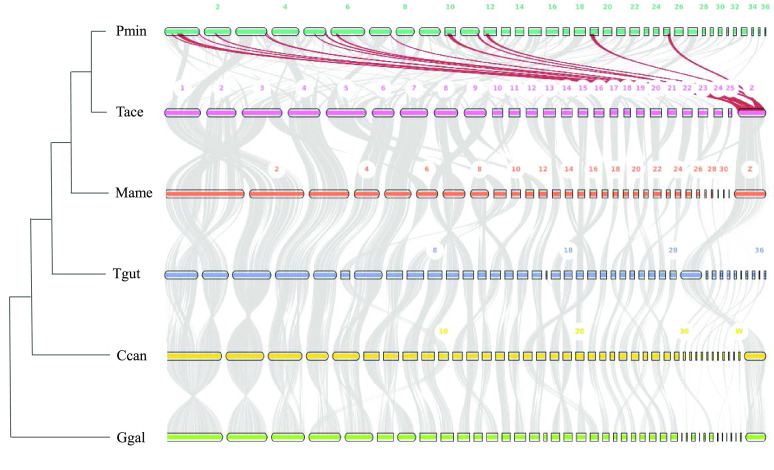 Figure 4
| Sample | No. of reads | No. of bases | Coverage (×) | Accession number | KFBG reference number | Provenance details | Date specimen acquired at KFBG | Specimen type |
|---|---|---|---|---|---|---|---|---|
|
| ||||||||
| PacBio HiFi | 2,707,085 | 25,352,990,722 | 20 |
| K14352 | Mai Po | 15/02/2020 | Tissue in 95% ethanol |
| Omni-C | 518,587,164 | 77,788,074,600 | 63 |
| B0181-2004 | Lok Ma Chau | 26/01/2004 | Tissue sample to be taken from carcass |
|
| ||||||||
| BFS1 | 39,968,142 | 5,995,204,753 | 4.8 |
| K7366 | Mai Po fishpond | 23/02/2015 | Tissue in 95% ethanol |
| BFS2 | 41,230,936 | 6,184,622,630 | 5.0 |
| K7388 | Lok Ma Chau fishpond | 13/04/2015 | Portion of toe in 95% ethanol |
| BFS3 | 40,776,316 | 6,116,429,712 | 4.9 |
| K8627 | Ma Cho Lung fishpond | 11/02/2016 | Tissue in 95% ethanol |
| BFS4 | 39,063,262 | 5,859,473,834 | 4.7 |
| K11131 | Mai Po Gei Wai | 26/02/2018 | Tissue in 95% ethanol |
| BFS5 | 44,638,096 | 6,695,693,640 | 5.4 |
| K11194 | Lut Chau, Nam San Wai | 10/04/2018 | Tissue in 95% ethanol |
| BFS6 | 41,890,130 | 6,283,502,065 | 5.1 |
| K12542 | Lok Ma Chau pond | 18/12/2018 | Blood in 95% ethanol |
| BFS7 | 41,319,808 | 6,197,954,720 | 5.0 |
| K12611 | Lok Ma Chau pond | 17/01/2019 | Tissue in 95% ethanol |
| BFS8 | 42,068,480 | 6,310,254,770 | 5.1 |
| K12706 | Lok Ma Chau | 03/03/2019 | Blood in 95% ethanol |
| BFS9 | 42,539,460 | 6,380,900,668 | 5.1 |
| K14133 | Lok Ma Chau | 26/11/2019 | Tissue in 95% ethanol |
| BFS10 | 40,359,264 | 6,053,871,746 | 4.9 |
| K14208 | Lok Ma Chau | 25/12/2019 | Tissue in 95% ethanol |
| BFS11 | 41,496,386 | 6,224,440,405 | 5.0 |
| K14366 | Mai Po | 20/02/2020 | Portion of feather in 95% ethanol |
| BFS12 | 39,361,374 | 5,904,189,803 | 4.8 |
| K14401 | Tin Shui Wai Wetland Park | 12/03/2020 | Tissue in 95% ethanol |
| BFS14 | 41,319,546 | 6,197,915,065 | 5.0 |
| K14324 | Tin Shui Wai Wetland Park | 03/02/2020 | Portion of feather in 95% ethanol |
| Property | min | max |
|---|---|---|
| Homozygous (aa) | 99.34% | 99.37% |
| Heterozygous (ab) | 0.63% | 0.66% |
| Genome Haploid Length (bp) | 1,141,324,739 | 1,144,280,536 |
| Genome Repeat Length (bp) | 112,880,770 | 113,173,108 |
| Genome Unique Length (bp) | 1,028,443,969 | 1,031,107,427 |
| Model Fit | 93.18% | 99.52% |
| Read Error Rate | 0.41% | 0.41% |
| Platalea minor | |
|---|---|
| Total length (bp) | 1,239,504,613 |
| Number | 468 |
| Mean length (bp) | 2,648,514 |
| Longest scaffold length (bp) | 108,170,464 |
| Shortest scaffold length (bp) | 1,000 |
| N_count | 0.02% |
| Gaps | 998 |
| N50 | 53,081,851 |
| N50n | 8 |
| N70 | 31,851,659 |
| N70n | 15 |
| N90 | 14,707,644 |
| N90n | 25 |
| BUSCO (Geno, metazoa_odb10) | C:93.7%[S:93.4%,D:0.3%],F:1.6%,M:4.7%,n:954 |
| BUSCO (Geno, aves_odb10) | C:97.3%[S:97.0%,D:0.3%],F:0.5%,M:2.2%,n:8338 |
| Protein total length (amino acids) | 9,684,019 |
| Protein number (amino acids) | 18,780 |
| Protein mean length (amino acids) | 516 |
| BUSCO (Prot, metazoa_odb10) | C:88.4%[S:72.5%,D:15.9%],F:1.7%,M:9.9%,n:954 |
| BUSCO (Prot, aves_odb10) | C:78.3%[S:59.9%,D:18.4%],F:1.9%,M:19.8%,n:8338 |
| Scaffold ID | Scaffold length (bp) | Cumulative % of the whole genome |
|---|---|---|
| scaffold_1 | 108,170,464 | 8.73% |
| scaffold_2 | 94,402,276 | 16.34% |
| scaffold_3 | 92,629,600 | 23.81% |
| scaffold_4 | 79,211,724 | 30.20% |
| scaffold_5 | 73,048,200 | 36.10% |
| scaffold_6 | 72,537,701 | 41.95% |
| scaffold_7 | 69,784,815 | 47.58% |
| scaffold_8 | 53,081,851 | 51.86% |
| scaffold_9 | 44,005,081 | 55.41% |
| scaffold_10 | 36,492,200 | 58.35% |
| scaffold_11 | 35,351,409 | 61.20% |
| scaffold_12 | 34,190,505 | 63.96% |
| scaffold_13 | 33,557,343 | 66.67% |
| scaffold_14 | 33,263,400 | 69.35% |
| scaffold_15 | 31,851,659 | 71.92% |
| scaffold_16 | 31,385,420 | 74.45% |
| scaffold_17 | 30,450,346 | 76.91% |
| scaffold_18 | 30,280,111 | 79.35% |
| scaffold_19 | 26,443,200 | 81.49% |
| scaffold_20 | 25,001,000 | 83.50% |
| scaffold_21 | 23,104,878 | 85.37% |
| scaffold_22 | 18,730,967 | 86.88% |
| scaffold_23 | 17,395,620 | 88.28% |
| scaffold_24 | 15,031,567 | 89.49% |
| scaffold_25 | 14,707,644 | 90.68% |
| scaffold_26 | 14,565,521 | 91.86% |
| scaffold_27 | 13,184,709 | 92.92% |
| scaffold_28 | 9,343,000 | 93.67% |
| scaffold_29 | 7,143,856 | 94.25% |
| scaffold_30 | 6,869,713 | 94.80% |
| scaffold_31 | 6,476,723 | 95.33% |
| scaffold_32 | 4,846,626 | 95.72% |
| scaffold_33 | 4,355,004 | 96.07% |
| scaffold_34 | 2,327,616 | 96.26% |
| scaffold_35 | 2,194,594 | 96.43% |
| scaffold_36 | 1,422,971 | 96.55% |
| scaffold_37 | 1,263,285 | 96.65% |
| scaffold_38 | 1,176,292 | 96.74% |
| scaffold_39 | 1,115,873 | 96.83% |
| Classification | Coverage length (bp) | Count | Proportion (%) | No. of distinct classifications |
|---|---|---|---|---|
| DNA | 7,812,155 | 25,610 | 0.63 | 3,780 |
| LINE | 63,189,657 | 102,036 | 5.10 | 5,652 |
| LTR | 20,129,006 | 29,922 | 1.62 | 3,928 |
| Other (Simple Repeat, Microsatellite, RNA) | 23,864,680 | 3,875 | 1.93 | 1,118 |
| Penelope | 690,955 | 1,966 | 0.06 | 646 |
| Rolling Circle | 287,526 | 744 | 0.02 | 404 |
| SINE | 1,165,920 | 4,910 | 0.09 | 885 |
| Unclassified | 30,908,397 | 60,141 | 2.49 | 5,695 |
|
|
|
|
|
|
| Sample ID | No. of sites with observed heterozygosity |
|
|
|---|---|---|---|
| BFS1 | 1,015,586 | 0.168 | 0.382 |
| BFS2 | 673,637 | 0.111 | 0.590 |
| BFS3 | 654,457 | 0.108 | 0.602 |
| BFS4 | 1,013,752 | 0.168 | 0.383 |
| BFS5 | 700,877 | 0.116 | 0.573 |
| BFS6 | 1,076,231 | 0.178 | 0.345 |
| BFS7 | 1,080,566 | 0.179 | 0.342 |
| BFS8 | 1,055,650 | 0.175 | 0.357 |
| BFS9 | 463,725 | 0.077 | 0.718 |
| BFS10 | 997,870 | 0.165 | 0.393 |
| BFS11 | 700,069 | 0.116 | 0.574 |
| BFS12 | 652,122 | 0.108 | 0.603 |
| BFS14 | 1,109,354 | 0.183 | 0.325 |
- —Hong Kong Research Grant Council Collaborative Research Fund
- —CUHK Strategic Seed Funding for Collaborative Research Scheme
- —CUHK Group Research Scheme
Peer Reviews
No public reviews on file for this paper yet. If you reviewed it on a platform where reviews are public (OpenReview, ICLR, NeurIPS, ICML), you can paste yours below so the community can read it here.
Videos
No videos yet. Explain this paper in a talk, walkthrough, or lecture? Add one.
Taxonomy
TopicsGenomics and Phylogenetic Studies · Genetic diversity and population structure · Identification and Quantification in Food
Introduction
The black-faced spoonbill Platalea minor (Threskiornithidae) (NCBI:txid259913, Figure 1A) is confined to coastal areas in East Asia, including Hong Kong, Macau, Taiwan, Vietnam, North Korea, South Korea, and Japan. The natural habitats of P. minor have been disturbed by human activities and industrialization, leading to the decline in the bird population over the last century [1, 2]. With an estimation of more than 6,000 individuals worldwide, the International Union for Conservation of Nature (also known as IUCN) has categorised the black-faced spoonbill as a globally endangered species. A quarter of the worldwide population of P. minor can be found in Hong Kong, and it is protected locally under the Wild Animals Protection Ordinance Cap 200. Genetic methods, including studies on genetic diversity and population structure, have been used to help retain this species with high conservation value [3, 4]. Nevertheless, a reference genome of this species was missing.
(A) Picture of Platalea minor; (B) Statistics of the genome assembly generated in this study; (C) Hi-C contact map of the assembly visualised using Juicebox (v1.11.08); (D) Repetitive elements distribution.
Methods
Sample collection
Tissue samples of 14 P. minor individuals were collected from the north and northwestern parts of the New Territories, Hong Kong, between February 2015 and February 2020, with help from Kadoorie Farm and Botanic Garden. These samples were stored in 95% ethanol. Details of the sample collection are listed in Table 1.
Isolation of high molecular weight genomic DNA
High molecular weight (HMW) genomic DNA was extracted from a single individual, labelled “BFS13”. The tissue sample was first ground into a powder with liquid nitrogen and then processed with the Qiagen MagAttract HMW kit (Qiagen Cat. No. 67563), following the manufacturer’s protocol. The final DNA sample was eluted with 120 μL of elution buffer (PacBio Ref. No. 101-633-500) and subjected to quality checks using the NanoDrop™ One/OneC Microvolume UV–Vis Spectrophotometer, Qubit^®^ Fluorometer, and overnight pulse-field gel electrophoresis.
DNA shearing, PacBio library preparation, and sequencing
Approximately 4.4 μg of HMW DNA was processed with DNA shearing through six centrifugation steps in a g-tube (Covaris Part No. 520079) at 2,000 × g for 2 min. The sheared DNA was transferred to a 2 mL DNA LoBind^®^ Tube (Eppendorf Cat. No. 022431048) and stored at 4 °C. Overnight pulse-field gel electrophoresis was used to assess the fragment size distribution of the sheared DNA. Next, an SMRT bell library was constructed using the SMRTbell^®^ prep kit 3.0 (PacBio Ref. No. 102-141-700), following the manufacturer’s instructions. Briefly, the sheared DNA was processed with DNA repair, followed by polishing and tailing with A-overhang at both ends of each DNA strand. T-overhang SMRTbell adapters were then ligated to the polished ends to form SMRTbell templates, which were purified with SMRTbell^®^ cleanup beads (PacBio Ref. No. 102158-300). The quantity and fragment size of the SMRTbell library were inspected with Qubit^®^ Fluorometer and overnight pulse-field gel electrophoresis, respectively. A nuclease treatment was conducted to remove any non-SMRTbell structures, and a subsequent size-selection step with 35% AMPure PB beads was used to remove short fragments. The final preparation of the library was performed using the Sequel^®^ II binding kit 3.2 (PacBio Ref. No. 102-194-100). In brief, Sequel II primer 3.2 and Sequel II DNA polymerase 2.2 were added to anneal and bind to the SMRTbell templates, respectively. An internal control provided by the kit was also added. Finally, the library was loaded on the PacBio Sequel IIe System at an on-plate concentration of 90 pM with the diffusion loading mode. The sequencing was run in 30-h movies, with 120 min pre-extension. In total, one SMRT cell was used to output high-fidelity (HiFi) reads, and the sequencing data details are listed in Table 1.
Omni-C library preparation and sequencing
An Omni-C library was constructed using the Dovetail^®^ Omni-C^®^ Library Preparation Kit (Dovetail Cat. No. 21005), following the manufacturer’s protocol. A total of 80 mg of tissue was ground into a powder with liquid nitrogen, transferred to 1 mL 1× PBS, and then subjected to crosslinking with formaldehyde and digestion with endonuclease DNase I. An aliquot of 2.5 μL lysate was used for assessing lysate quantification and fragment size distribution using Qubit^®^ Fluorometer and TapeStation D5000 HS Screen Tape, respectively. Then, end polishing, bridge ligation, and proximity ligation were carried out in the crosslinked DNA fragments. Next, crosslink reversal was performed, followed by DNA purification and size selection with SPRIselect™ Beads (Beckman Coulter Product No. B23317). The library preparation was continued with end repair and adapter ligation using the Dovetail™ Library Module for Illumina (Dovetail Cat. No. 21004), followed by DNA purification with SPRIselect™ Beads. The DNA fragments were then captured with Streptavidin Beads and Universal and Index PCR Primers from the Dovetail™ Primer Set for Illumina (Dovetail Cat. No. 25005) were added to amplify the DNA library. A final size selection was carried out using SPRIselect™ Beads to retain DNA fragments ranging between 350 bp and 1000 bp. The quantity and fragment size distribution of the library were inspected by the Qubit^®^ Fluorometer and the TapeStation D5000 HS ScreenTape, respectively. The final library was sequenced on an Illumina HiSeq-PE150 platform at Novogene. The details of the sequencing data are listed in Table 1.
Genome assembly and gene model prediction
De novo genome assembly was performed using Hifiasm (RRID:SCR_021069) [5]. Haplotypic duplications were identified and removed using purge_dups (RRID:SCR_021173) based on the depth of HiFi reads [6]. Proximity ligation data from the Omni-C library was used to scaffold genome assembly by YaHS (RRID:SCR_022965) [7]. Transposable elements (TEs) were annotated using the automated Earl Grey TE annotation pipeline (version 1.2) as previously described [8]. Genome annotation was performed using Braker (v3.0.8) (RRID:SCR_018964) [9] with default parameters. Briefly, the genome was soft-masked using redmask (v0.0.2) [10]. A total of 2,468,534 aves reference protein sequences were downloaded from NCBI as protein references. A blood RNA-Seq dataset (SRR6650848) [11] was also downloaded from NCBI and aligned to the soft-masked genome using hisat2 (RRID:SCR_015530) [12] to generate the bam file. The protein and bam files were used as input to Braker for genome annotation.
Platalea minor resequencing and single nucleotide polymorphism analysis
Genomic DNA from 13 P. minor individuals were isolated using the PureLink™ Genomic DNA Mini Kit (Invitrogen Cat no. K182002), following the manufacturer’s instructions. The quality of DNA samples was assessed with the NanoDrop™ One/OneC Microvolume UV–Vis Spectrophotometer and 1% gel electrophoresis. Next, the samples were sent to Novogene for sequencing on an Illumina HiSeq-PE150 platform at approximately 6× coverage. The sequenced raw reads were then trimmed by Trimmomatic (v0.39, RRID:SCR_011848) [13] and cleaned with Kraken 2 (RRID:SCR_005484) [14]. The cleaned reads were aligned to large scaffolds (>500 kb, n = 234), accounting for 97.1% of the P. minor reference genome, with BWA-MEM (RRID:SCR_022192) [15] using the parameters “-t 30 -M -R”. Variant calling was performed using “HaplotypeCaller” and “GenotypeGVCFs” commands from the Genome Analysis Toolkit (GATK, RRID:SCR_001876, v4.1.2.0) [16]. Hard filtering was employed to filter out single nucleotide polymorphisms (SNPs) with the following criteria: quality by depth <2.0, Fisher strand bias >60.0, mapping quality <40.0, mapping quality rank sum test <−12.5, and read position rank sum test <−8.0. The remaining SNPs were further filtered for bi-allelic (“--min-alleles 2 --max-alleles 2”), no missing data (“--max-missing 1”), minimum summed site-depth (sumDP) of 20 and maximum sumDP of 130 to remove sites that were below one-third and above three-fold of the average sumDP, respectively, using the “--site-depth” and “--positions” options in VCFtools (v0.1.16, RRID:SCR_001235) [17]. The heterozygosity and inbreeding coefficient were estimated using VCFtools (v0.1.16) [17]. Details of the resequencing data are listed in Table 1.
Data validation and quality control
During DNA extraction and PacBio library preparation, the samples were subjected to quality control with NanoDrop™ One/OneC Microvolume UV–Vis Spectrophotometer, Qubit^®^ Fluorometer, and overnight pulse-field gel electrophoresis. The Omni-C library was inspected by Qubit^®^ Fluorometer and TapeStation D5000 HS ScreenTape.
Regarding the genome assembly, the Hifiasm output was blast to the NT database, and the resulting output was used as input for Blobtools (v1.1.1, RRID:SCR_017618) [18]. Scaffolds identified as possible contaminations were removed from the assembly manually (Figure 2). A statistical kmer-based approach was applied to estimate the heterozygosity of the assembled genome. The repeat content and the corresponding sizes were analysed with k-mer 21 using Jellyfish (RRID:SCR_005491) [19] and GenomeScope (RRID:SCR_017014) [20] (Figure 3; Table 2). BUSCO (v5.5.0) [21] was used to assess the completeness of the genome assembly and gene annotation with a metazoan dataset (aves_odb10). HiC contact maps were generated using Juicer tools (version 1.22.01, RRID:SCR_017226) [22], following the Omni-C manual [23].
Genome assembly quality control and contaminant/cobiont detection. The upper panel shows the BlobPlot of the assembly. Each circle represents a scaffold with its size scaled according to its scaffold length, while the colour of the circle indicates the taxonomic assignment from BLAST similarity search results. The lower panel reveals the ReadCovPlot of the assembly, illustrating the proportion of unmapped and mapped sequences in the BLAST similarity search results on the left. The latter is further dissected according to the rank of phylum on the right.
The GenomeScope profile with kmer 21.
Omni-C reads and PacBio HiFi reads were used to measure the assembly completeness and the consensus quality (QV) using Merqury (v1.3, RRID:SCR_022964) [24] with kmer 20, resulting in 95.0738% kmer completeness for the Omni-C data and 59.746 QV scores for the HiFi reads, corresponding to 99.999% accuracy.
The black-faced spoonbill genome assembly was also compared to five other avian genomes with chromosome-level assemblies and genome annotations, including Gallus gallus (Ggal: GCF_016699485.2), Cuculus canorus (Ccan: GCF_017976375.1), Mycteria americana (Mame: GCA_035582795.1), Taeniopygia guttata (Tgut: GCF_003957565.2), and Theristicus caerulescens (Tcae: GCA_020745775.1), which were downloaded from NCBI [25] and UCSC [26], respectively [27–29]. Macrosynteny was performed using MCScan (RRID:SCR_017650) with default parameters [30]. It is worth noting that some parts of the largest scaffold in P. minor mapped to several T. caerulescens chromosomes, while genomes in other birds show relatively high syntenic conservation [31], which may warrant further investigation (Figure 4).
Macrosynteny between P. minor (Pmin), Theristicus caerulescens (Tcae), Mycteria americana (Mame), Taeniopygia guttata (Tgut), Cuculus canorus (Ccan), and Gallus gallus (Ggal).
Results and discussion
Genome assembly of P. minor
A total of 25.35 Gb of HiFi bases was generated with an average HiFi read length of 9,365 bp with 20× data coverage (Table 1). After scaffolding with 77.79 Gb Omni-C sequencing data, the assembled genome size was 1.24 Gb in 468 scaffolds, with a scaffold N50 of 53 Mb and L50 of 8 (Tables 1, 3 and 4; Figures 1B and C). The genome size is comparable to those of other bird species in the family Threskiornithidae, which have genome sizes around 1.0–1.3 Gb, according to the data available in the NCBI Genbank, such as Theristicus caerulescens (1.20 Gb, GCA_020745775.1), Nipponia nippon (1.31 Gb, GCA_035839065.1), and Mesembrinibis cayennensis (1.19 Gb, GCA_013399675.1). The genome completeness was estimated by BUSCO (RRID:SCR_015008) with a value of 97.3% (aves_odb10) (Table 3; Figure 1B). The GC content was 42.98%. A total of 14,673 gene models were generated with 18,780 predicted protein-coding genes, having a mean coding-sequence length of 516 amino acids and a complete protein BUSCO value of 78.3% (Table 3).
Repeat content
A total repeat content of 11.94% was found in the genome, which contained a lower level of repeat elements, similar to other avian genomes [32], with 2.49% unclassified elements. Of the remaining repeats, long interspersed nuclear elements (LINE) were the most abundant (5.10%), followed by long terminal repeats (LTR) (1.62%). In contrast, DNA, short interspersed nuclear elements (SINE), Penelope, and rolling circle were only present in low proportions (DNA: 0.63%, SINE: 0.09%, Penelope: 0.06%, rolling circle: 0.02%). A complete catalogue of the repeat content of the genome can be found in Table 5 and Figure 1D.
Single nucleotide polymorphism sites
A total of 6,046,878 bi-allelic SNPs were called from 13 P. minor individuals, accounting for ∼0.5% of the genome. The mean individual heterozygosity was 0.142%. The lowest individual heterozygosity (0.077%) was close to other endangered bird species, such as Pelecanus crispus (0.60%) and Nestor notabilis (0.91%) [33]. The heterozygosity levels (0.108% to 0.116%) from five individuals were comparable to previous reports on spoonbills - black-faced spoonbill (0.101%–0.116%, mean 1.09%, n = 11) and royal spoonbill (0.098%–0.109%, mean 0.105%, n = 9) [4]. The remaining heterozygosity levels observed in this study were below the mean (0.221%) and median (0.213%) of heterozygosity reported from 40 avian species [33]. Signals of inbreeding were observed among the samples, with the inbreeding coefficient (F IS) ranging from 0.331 to 0.720 (Table 6), providing additional evidence of a recent genetic bottleneck in the black-faced spoonbill population [4]. High levels of F IS have also been observed in other bird populations suffering from past bottlenecks [34]. These results highlighted the need for continuous efforts in monitoring P. minor.
Conclusion and reuse potential
This study presents the first chromosomal-level genome assembly and single-nucleotide polymorphism sites of black-faced spoonbill Platalea minor. These are useful and valuable resources for future population genomic studies aimed at better understanding spoonbill species numbers and conservation.
The reference list from the paper itself. Each links out to its DOI / PubMed record.
- 1Takano S, Henmi Y. The influence of constructing a Shinkansen bridge on Black-faced Spoonbills Platalea minor wintering in Kyushu, Japan. Ornithol. Sci., 2012; 11: 21–28. doi:10.2326/osj.11.21. · doi ↗
- 2Guo-An W, Fu-Min L, Zuo-Hua Y Nesting and disturbance of the Black-faced Spoonbill in Liaoning Province, China. Waterbirds, 2005; 28: 420–425. doi:10.1675/1524-4695(2005)28[420:NADOTB]2.0.CO;2. · doi ↗
- 3Lee M-Y, Kwon I-K, Lee K Genetic diversity and population structure of the Black-faced Spoonbill (Platalea minor) among its breeding sites in South Korea: implication for conservation. Biochem. Syst. Ecol., 2017; 71: 106–113. doi:10.1016/j.bse.2017.01.014. · doi ↗
- 4Li S-H, Liu Y, Yeh C-F Not out of the woods yet: signatures of the prolonged negative genetic consequences of a population bottleneck in a rapidly re-expanding wader, the black-faced spoonbill Platalea minor . Mol. Ecol., 2022; 31: 529–545. doi:10.1111/mec.16260.34726290 · doi ↗ · pubmed ↗
- 5Cheng H, Concepcion GT, Feng X Haplotype-resolved de novo assembly using phased assembly graphs with hifiasm. Nat. Methods, 2021; 18: 170–175. doi:10.1038/s 41592-020-01056-5.33526886 PMC 7961889 · doi ↗ · pubmed ↗
- 6Guan D, Guan D, Mc Carthy SA Identifying and removing haplotypic duplication in primary genome assemblies. Bioinformatics, 2020; 36: 2896–2898. doi:10.1093/BIOINFORMATICS/BTAA 025.31971576 PMC 7203741 · doi ↗ · pubmed ↗
- 7Zhou C, Mc Carthy SA, Durbin R. Ya HS: yet another Hi-C scaffolding tool. Bioinformatics, 2023; 39: btac 808. doi:10.1093/bioinformatics/btac 808.36525368 PMC 9848053 · doi ↗ · pubmed ↗
- 8Baril T, Galbraith J, Hayward A. Earl Grey: a fully automated user-friendly transposable element annotation and analysis pipeline. Mol. Biol. Evol., 2024; 41(4): msae 068. doi:10.1093/molbev/msae 068.38577785 PMC 11003543 · doi ↗ · pubmed ↗