Association of Carotid-Femoral Pulse Wave Velocity and Ejection Duration with Target Organ Damage
Yaya Bai, Huiying Jia, Alberto Avolio, Yi Qian, Junli Zuo

TL;DR
This study shows that carotid-femoral pulse wave velocity and ejection duration have distinct effects on heart and kidney damage in patients.
Contribution
The study reveals how cfPWV and ED independently and jointly influence target organ damage, particularly in cardiac and renal systems.
Findings
cfPWV was positively linked to left ventricular mass index and kidney damage markers.
ED was negatively associated with left ventricular mass index and positively with kidney function.
High cfPWV and low ED were linked to significantly higher risk of left ventricular hypertrophy.
Abstract
Carotid-femoral pulse wave velocity (cfPWV) and ejection duration (ED) have different impacts on target organ damage (TOD). The aim of this study was to determine the relationship of cfPWV and ED with TOD. A total of 1254 patients (64.27% males) from Ruijin Hospital were enrolled in this study from December 2018 to August 2022. Medical records, blood samples and urine samples were collected. The cfPWV was measured and ED was generated using SphygmoCor software (version 8.0, AtCor Medical, Sydney, Australia). TOD including left ventricular hypertrophy (LVH), microalbuminuria, chronic kidney disease (CKD), and abnormality of carotid intima-media thickness (CIMT) were evaluated. Multiple stepwise linear regression models of cfPWV and ED (individually or together) showed that cfPWV was positively correlated with left ventricular mass index (LVMI) (β= 0.131, p = 0.002) and Log…
Genes, proteins, chemicals, diseases, species, mutations and cell lines named across the full text — each resolved to its canonical identifier and authoritative record.
Click any figure to enlarge with its caption.
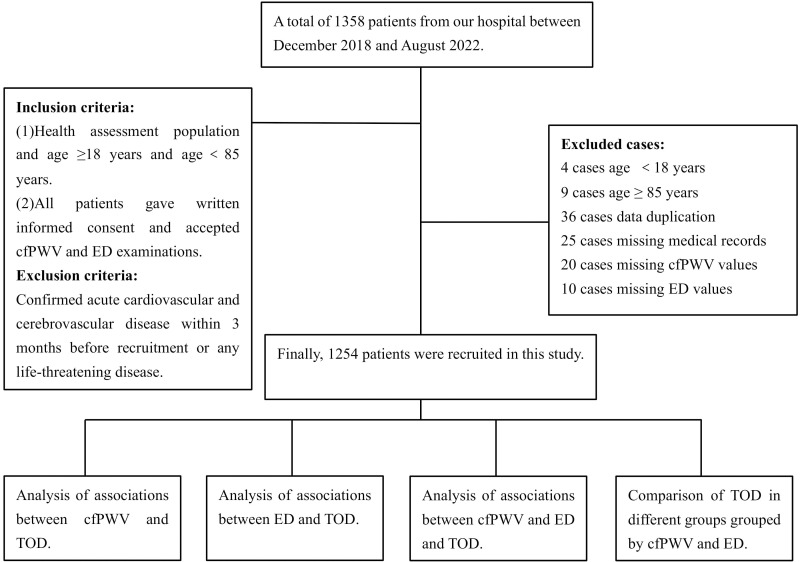 Fig. 1
| Variable | Overall | Male | Female | |
| N = 1254 | N = 806 | N = 448 | ||
| Age (years) | 53.13 | 52.11 | 54.95 | |
| Sex, n (%) | NA | 806/1254 (64.27) | 448/1254 (35.73) | NA |
| Height (cm) | 167.41 | 171.41 | 160.22 | |
| BMI (Kg/ | 25.32 | 25.93 | 24.23 | |
| Smoking history, n (%) | 215/1254 (17.15) | 199/806 (24.69) | 16/448 (3.57) | |
| Antihypertensive agents, n (%) | 391/1254 (31.18) | 291/806 (36.10) | 100/448 (22.32) | |
| Serum uric acid ( | 365.19 | 394.99 | 311.68 | |
| TG (mmol/L) | 1.93 | 2.09 | 1.64 | |
| TC (mmol/L) | 4.81 | 4.71 | 4.99 | |
| HDL-c (mmol/L) | 1.15 | 1.08 | 1.27 | |
| LDL-c (mmol/L) | 3.13 | 3.08 | 3.22 | 0.005 |
| FBG (mmol/L) | 5.78 | 5.85 | 5.65 | 0.055 |
| HbA1c (%) | 6.16 | 6.17 | 6.12 | 0.556 |
| pSBP (mmHg) | 130.68 | 131.45 | 129.28 | 0.058 |
| pDBP (mmHg) | 76.71 | 78.14 | 74.14 | |
| pMAP (mmHg) | 94.70 | 95.91 | 92.52 | |
| cSBP (mmHg) | 119.68 | 119.95 | 119.19 | 0.492 |
| cDBP (mmHg) | 77.81 | 79.23 | 75.26 | |
| cMAP (mmHg) | 95.52 | 96.53 | 93.71 | 0.001 |
| cAP | 12.61 | 11.58 | 14.46 | |
| cAIX | 28.81 | 27.13 | 31.83 | |
| cAIX@HR75 | 25.31 | 23.54 | 28.49 | |
| HR (beat/min) | 69.24 | 69.20 | 69.32 | 0.837 |
| cfPWV (m/s) | 8.24 | 8.35 | 8.05 | 0.012 |
| LVMI (g/ | 103.44 | 106.45 | 96.88 | |
| eGFR (mL/min/1.73 | 90.28 | 92.44 | 86.39 | |
| LogACR (mg/mmol) | 0.39 | 0.39 | 0.38 | 0.685 |
| CIMT (mm) | 0.74 | 0.75 | 0.73 | 0.036 |
| LVH, n (%) | 298/836 (35.65) | 173/573 (30.19) | 125/263 (47.53) | |
| CKD, n (%) | 36/1191 (3.02) | 17/765 (2.22) | 19/426 (4.46) | 0.031 |
| ACR abnormality, n (%) | 129/754 (17.11) | 94/520 (18.08) | 35/234 (14.96) | 0.293 |
| CIMT abnormality, n (%) | 386/791 (48.80) | 270/524 (51.53) | 116/267 (43.45) | 0.032 |
| ED (ms) | 318.68 | 314.83 | 325.62 | |
| SEVR (%) | 144.72 | 148.89 | 137.21 |
| Variable | LVMI | eGFR | LogACR | CIMT | ||||
| r |
| r |
| r |
| r |
| |
| cfPWV | 0.325** | –0.234 | 0.188** | 0.283** | ||||
| ED | –0.132** | –0.045 | 0.118 | –0.052 | 0.184 | –0.015 | 0.672 | |
| Variable | B | SE |
| t | 95% CI | VIF | |||
| LL | UL | ||||||||
| cfPWV | Constant | –6.648 | 1.129 | –5.890 | 0.000 | –8.863 | –4.433 | ||
| Age | 0.081 | 0.004 | 0.504 | 20.589 | 0.000 | 0.073 | 0.089 | 1.173 | |
| pMAP | 0.053 | 0.004 | 0.343 | 14.282 | 0.000 | 0.045 | 0.060 | 1.130 | |
| FBG | 0.114 | 0.026 | 0.102 | 4.346 | 0.000 | 0.062 | 0.165 | 1.071 | |
| HR | 0.018 | 0.004 | 0.093 | 4.013 | 0.000 | 0.009 | 0.027 | 1.063 | |
| Height | 0.017 | 0.006 | 0.071 | 2.942 | 0.003 | 0.006 | 0.029 | 1.135 | |
| Antihypertensive treatment | 0.220 | 0.099 | 0.052 | 2.222 | 0.026 | 0.026 | 0.415 | 1.072 | |
| BMI | 0.027 | 0.013 | 0.053 | 2.181 | 0.029 | 0.003 | 0.052 | 1.172 | |
| ED | Constant | 438.901 | 6.736 | 65.158 | 0.000 | 425.684 | 452.118 | ||
| HR | –1.620 | 0.054 | –0.644 | –30.024 | 0.000 | –1.726 | –1.514 | 1.034 | |
| Sex | 8.700 | 1.227 | 0.159 | 7.090 | 0.000 | 6.292 | 11.107 | 1.123 | |
| BMI | –0.425 | 0.152 | –0.063 | –2.799 | 0.005 | –0.722 | –0.127 | 1.148 | |
| HDL-c | 5.632 | 1.835 | 0.068 | 3.070 | 0.002 | 2.032 | 9.232 | 1.119 | |
| pMAP | –0.123 | 0.045 | –0.062 | –2.750 | 0.006 | –0.211 | –0.035 | 1.130 | |
| FBG | –0.646 | 0.315 | –0.044 | –2.052 | 0.040 | –1.263 | –0.028 | 1.044 | |
| Variable | Covariates + cfPWV | Covariates + ED | Covariates + cfPWV and ED | |||||
| cfPWV ( | ED ( | cfPWV ( | ED ( | |||||
| LVMI | 0.131 | 0.002 | –0.244 | 0.131 | 0.002 | –0.239 | ||
| eGFR | NA | 0.115 | 0.003 | NA | 0.115 | 0.003 | ||
| LogACR | 0.123 | 0.004 | NA | 0.123 | 0.004 | NA | ||
| CIMT | NA | NA | NA | NA | ||||
| Variable | B | SE | Wals | df | OR | 95% CI | ||||
| LL | UL | |||||||||
| Covariates + cfPWV | ||||||||||
| CKD | cfPWV | 0.215 | 0.083 | 6.806 | 1.000 | 0.009 | 1.240 | 1.055 | 1.458 | |
| Covariates + ED | ||||||||||
| LVH | ED | –0.017 | 0.005 | 14.005 | 1.000 | 0.000 | 0.983 | 0.975 | 0.992 | |
| Covariates + cfPWV + ED | ||||||||||
| LVH | ED | –0.017 | 0.005 | 14.005 | 1.000 | 0.000 | 0.983 | 0.975 | 0.992 | |
| CKD | cfPWV | 0.215 | 0.083 | 6.806 | 1.000 | 0.009 | 1.240 | 1.055 | 1.458 | |
| Variable | B | SE | Wals | df | OR | 95% CI | |||
| LL | UL | ||||||||
| LVH | Age | 0.051 | 0.008 | 43.228 | 1.000 | 0.000 | 1.052 | 1.036 | 1.068 |
| Sex | 1.054 | 0.195 | 29.344 | 1.000 | 0.000 | 2.869 | 1.959 | 4.201 | |
| BMI | 0.049 | 0.023 | 4.426 | 1.000 | 0.035 | 1.050 | 1.003 | 1.099 | |
| HDL-c | –0.658 | 0.322 | 4.181 | 1.000 | 0.041 | 0.518 | 0.276 | 0.973 | |
| pMAP | 0.020 | 0.007 | 8.206 | 1.000 | 0.004 | 1.020 | 1.006 | 1.034 | |
| HR | –0.046 | 0.011 | 17.716 | 1.000 | 0.000 | 0.955 | 0.935 | 0.976 | |
| Group (control) | 15.464 | 5.000 | 0.009 | ||||||
| Group (low ED) | 0.728 | 0.406 | 3.219 | 1.000 | 0.073 | 2.071 | 0.935 | 4.588 | |
| Group (high ED) | –0.555 | 0.219 | 6.420 | 1.000 | 0.011 | 0.574 | 0.374 | 0.882 | |
| Group (high PWV) | 0.234 | 0.332 | 0.496 | 1.000 | 0.481 | 1.263 | 0.659 | 2.422 | |
| Group (high PWV low ED) | 1.917 | 0.842 | 5.180 | 1.000 | 0.023 | 6.799 | 1.305 | 35.427 | |
| Group (high PWV high ED) | –0.016 | 0.349 | 0.002 | 1.000 | 0.963 | 0.984 | 0.497 | 1.950 | |
| CKD | Age | 0.073 | 0.016 | 19.393 | 1.000 | 0.000 | 1.075 | 1.041 | 1.111 |
| ACR abnormality | Antihypertensive treatment | 0.754 | 0.222 | 11.490 | 1.000 | 0.001 | 2.126 | 1.375 | 3.288 |
| FBG | 0.145 | 0.047 | 9.392 | 1.000 | 0.002 | 1.157 | 1.054 | 1.269 | |
| pMAP | 0.038 | 0.008 | 20.506 | 1.000 | 0.000 | 1.039 | 1.022 | 1.056 | |
| CIMT abnormality | Age | 0.085 | 0.008 | 102.612 | 1.000 | 0.000 | 1.089 | 1.071 | 1.107 |
| Sex | –0.696 | 0.189 | 13.499 | 1.000 | 0.000 | 0.499 | 0.344 | 0.723 | |
| BMI | –0.062 | 0.025 | 6.296 | 1.000 | 0.012 | 0.940 | 0.896 | 0.987 | |
| Antihypertensive treatment | 0.582 | 0.176 | 10.970 | 1.000 | 0.001 | 1.789 | 1.268 | 2.524 | |
| FBG | 0.114 | 0.056 | 4.183 | 1.000 | 0.041 | 1.121 | 1.005 | 1.250 | |
| pMAP | 0.016 | 0.007 | 4.980 | 1.000 | 0.026 | 1.016 | 1.002 | 1.030 | |
- —National Natural Science Foundation of China
- —Clinical Science and Shanghai Municipal Hospital New Frontier Technology Joint Project
- —Shanghai Municipal Commission of Health and Family Planning
Peer Reviews
No public reviews on file for this paper yet. If you reviewed it on a platform where reviews are public (OpenReview, ICLR, NeurIPS, ICML), you can paste yours below so the community can read it here.
Videos
No videos yet. Explain this paper in a talk, walkthrough, or lecture? Add one.
Taxonomy
TopicsCardiovascular Health and Disease Prevention · Blood Pressure and Hypertension Studies · Cerebrovascular and Carotid Artery Diseases
1. Introduction
Carotid-femoral pulse wave velocity (cfPWV) is a gold standard measure of arterial stiffness. cfPWV is associated with target organ damage (TOD) such as left ventricular hypertrophy (LVH), chronic kidney disease (CKD), microalbuminuria, abnormality in carotid intima-medium thickness (CIMT), as well as cardiovascular events [1, 2, 3].
Ejection duration (ED) is defined as the time interval from opening to closure of the aortic valve [4], and is closely related to cardiac physiology and function [5]. The methods used to measure ED have changed over the years [6, 7, 8]. The main factor that shortens left ventricular ejection time (LVET) is the relative lengthening of the pre-ejection period (PEP), thereby delaying the onset of ejection. Further shortening of the LVET is associated with a decrease in stroke volume [4]. ED is associated with impairment of cardiac function and is a strong predictor of cardiovascular outcomes in certain patients, including those with hypertension [9], heart failure [10, 11], or other ischemic cardiac diseases [12, 13]. It has also been shown that ED is an independent predictor of incident heart failure [14]. When the arterial elastic modulus is constant, LVET has a dominant effect on the calculated PWV compared to the heart rate (HR) and to peripheral resistance [15]. Moreover, LVET but not HR is independently correlated with aortic PWV [16]. However, clinical applications of ED measurement in the general population that is free of cardiac diseases remains unclear, and the interaction of ED and/or cfPWV with TOD and cardiovascular events requires further investigation.
Therefore, in the present study we analyzed the associations of cfPWV and/or ED with TOD. This allowed exploration of the interaction between arterial stiffness and LVET, with the long-term goal of achieving individualized clinical management of ED and cfPWV in general patients.
2. Materials and Methods
2.1 Study Population
A total of 1358 subjects who attended the Ruijin Hospital (affiliated with the Shanghai Jiao Tong University School of Medicine) from December 2018 to August 2022 were included in this study. The inclusion criteria were health assessment, age 18 years, and age 85 years. Written informed consent was given by all patients and all agreed to undergo cfPWV and ED examinations. Exclusion criteria included confirmed acute cardiovascular and cerebrovascular disease within 3 months of recruitment, any life-threatening disease such as hemorrhagic or ischemic stroke, severe arrhythmia, severe heart failure (New York Heart Association Class IV), acute coronary syndrome, and malignant tumor with a life expectancy of 5 years. Among the 1358 patients, 4 cases were excluded due to age 18 years and 9 cases due to age 85 years. In addition, 36 cases were excluded because of duplication of clinical data, 25 cases due to missing medical records, 20 cases because of missing cfPWV values, and 10 cases due to lack of ED values. This resulted in a final study cohort of 1254 patients. These were grouped according to cfPWV and ED values as follows: Group (control), Group (low ED), Group (high ED), Group (high cfPWV), Group (high cfPWV, low ED), Group (high cfPWV, high ED). “High cfPWV” was a cfPWV 10 m/s , while “normal cfPWV” was cfPWV 10 m/s. One of the high-risk factors for asymptomatic hypertensive TOD is cfPWV 10 m/s [17]. ED in the range of 281 ms to 321 ms was defined as “normal ED”, while ED 281 ms was defined as “low ED” and ED 321 ms as “high ED”. Clinical data including sex, age, height, body mass index (BMI), antihypertensive drugs (yes or no) and smoking history (yes or no) was collected using a standardized questionnaire. BMI was calculated as the ratio of body weight (kilograms) divided by the square of body height (meters). Venous blood and urine samples were collected after obtaining informed consent. Serum uric acid (UA), creatinine (Cr), triglyceride and total cholesterol (TC), low-density lipoprotein cholesterol (LDL-c), high-density lipoprotein cholesterol (HDL-c), fasting blood glucose (FBG) and hemoglobinA1c (HbA1c) were measured in the venous blood sample using standard methods. The urine sample was used to measure urinary albumin and creatinine. The research protocol for this study (Fig. 1) was approved by the Ethics Committee of Ruijin Hospital, Shanghai Jiao Tong University School of Medicine (Ethics No. 2011-30).
Flowchart of the research protocol.
2.2 Measurement and Pulse Wave Analysis
A high-fidelity SPT-304 micromanometer (20172216993, Millar Instruments, Houston, TX, USA) interfaced with a laptop computer was used to obtain radial waveforms and pulse wave analysis measurements by applanation tonometry. SphygmoCor software (version 8.0, AtCor Medical, Sydney, Australia) was used to generate a reconstructed aortic pulse waveform from radial waveforms using a transfer function [18]. ED, subendocardial viability ratio (SEVR) and other hemodynamic indices including the central augmentation index (cAIx), cAIx adjusted to a heart rate of 75 bpm (beats per minute) (AIx@HR75), central diastolic blood pressure (cDBP), central systolic blood pressure (cSBP) and central mean arterial blood pressure (cMAP) were derived from the reconstructed aortic waveform. For calibrating radial waveforms, triplicate recordings of left brachial blood pressure and a 10-s sample of brachial pulse waves were measured by a validated Omron 705 CP oscillometric device (HEM-705cp, Omron, Kyoto, Japan) [19]. For this measurement, the subject was in the supine position in a quiet room with stable temperature for at least 10 minutes of rest, and without caffeine, smoking or exercise for 30 minutes prior to examination [20]. ED was reported in milliseconds (ED ms) and as a percentage of the cardiac cycle (ED%). It was defined as beginning with the initial upstroke of the forward wave and ending with occurrence of the dicrotic notch [21]. Peripheral mean arterial blood pressure (pMAP) was calculated using the following formula: pMAP = peripheral diastolic blood pressure (pDBP) + 1/3 [peripheral systolic blood pressure (pSBP) – pDBP]. Recordings were discarded if the diastolic or systolic variability of consecutive waveforms exceeded 5%, or if the raw amplitude of the recorded pulse wave signal was 80 mV. All recordings entered into the software package met the manufacturer’s quality control standards.
2.3 Carotid-Femoral Pulse Wave Velocity
The carotid-femoral pulse wave velocity (cfPWV) was calculated using the formular: cfPWV (m/s) = [(the distance of the suprasternal notch to the femoral artery — the distance from the suprasternal notch to the carotid artery) (m)/the transit time of the pulse wave (s)]. Shortly after the measurement of office blood pressure, the right side carotid and femoral arterial waveforms were derived by applanation tonometry. Patients fasted overnight and no caffeine beverage or smoking was allowed within 3 hours of the measurement. PWV was measured using SphygmoCor (version 8.0, AtCor Medical, Sydney, Australia). For this study, “normal cfPWV” was defined as cfPWV 10 m/s, and “high cfPWV” as cfPWV 10 m/s.
2.4 Target Organ Damage (TOD)
2.4.1 Left Ventricular Hypertrophy (LVH)
LVH was defined as a left ventricular mass index (LVMI) 115 g/ in men and 95 g/ in women. It was calculated using echocardiography and performed according to a standardized reading protocol. All indices were estimated by an experienced sonographer or cardiologist and were based on recommendations of the American Society of Echocardiography [22].
2.4.2 Renal Abnormality
Spot morning urine samples obtained from participants were used to measure the urinary albumin-creatinine ratio (ACR). Abnormal albuminuria was defined as urine ACR 2.5 mg/mmol in males and 3.5 mg/mmol in females. As recommended in the Kidney Disease Outcomes Quality Initiative (K/DOQI) guidelines, the definition and diagnostic criteria for chronic kidney disease (CKD) was estimated glomerular filtration rate (eGFR) 60 mL/min/1.73 , as calculated by the Modification of Diet in Renal Disease (MDRD) formula [23].
2.4.3 Carotid Intima-Media Thickness (CIMT)
Carotid intima-media thickness was assessed bilaterally by high-resolution Doppler ultrasound (HD11EX Ultrasound, Philips Medical Systems, Andover, MA, USA) with a broadband linear array transducer, preferentially at frequencies 7 MHz. Intima-Media Thickness (IMT) was measured within a plaque-free region [24], preferably on the far wall of the common carotid artery and at least 5 mm below its end [25]. The average value of the three recordings measured separately at both the left and right carotid arteries during the diastolic portion of the cardiac cycle was calculated for each side. The average of the left CIMT and right CIMT [(Left CIMT + Right CIMT)/2] was calculated as the final CIMT. Plaques are focal structures that encroach into the arterial lumen by at least 0.5 mm or 50% of the surrounding IMT value, or show a thickness of 1.5 mm as measured from the intima-lumen interface to the media-adventitia interface [26]. A CIMT 0.9 mm and/or the presence of carotid plaques were defined as CIMT abnormality.
2.5 Statistics Analysis
All analyses were performed using SPSS 24.0 for Windows (SPSS Inc, Chicago, IL, USA). A two-sided p value of 0.05 was considered statistically significant. The distribution for normality of quantitative parameters was checked by nonparametric One Sample K-S test, with *p * 0.05 demonstrating the variable fits a normal distribution. Qualitative parameters were presented as numbers with the percentage in parentheses, and quantitative parameters as the mean standard deviation. These were compared between genders by the chi-squared test and by the two-independent sample student’s test, respectively. Correlations of cfPWV and ED with TOD were investigated by Pearson’s correlation analysis. Multivariate stepwise linear or logistic regressions analyses [forward likelihood ratio (LR)] were performed to evaluate the association of risk factors with TOD. cfPWV and ED were included either separately or together in the regression models, and in different groups classified according to cfPWV and ED values. Adjustment was made for covariates including sex, age, height, BMI, smoking history, antihypertensive drugs (yes or no), HDL-c, LDL-c, FBG, heart rate (HR), and pMAP. Only variables that remained statistically significant in the final model were presented.
3. Results
3.1 Baseline Clinical Characteristics of the
Study Population
A total of 1254 patients (mean age 53.13 12.62 years, 64.27% males)
were recruited to this study. Males were significantly taller with larger BMI and
higher incidence of smoking history and antihypertensive treatment compared to
women (*p * 0.05), but were significantly younger (*p *
0.001). Women had significantly higher levels of TC, HDL-c and
FBG than men (*p * 0.05), but lower levels of UA and
total triglycerides (TG) (*p * 0.05).
FBG and HbA1c levels were not significantly different between
males and females (*p * 0.05). For
the peripheral and central hemodynamic indices, males had significantly higher
peripheral diastolic blood pressure (pDBP), pMAP, cDBP, cMAP, cfPWV and SEVR than
females (*p * 0.05), whereas peripheral systolic blood pressure (pSBP)
and cSBP were not significantly different between the two genders (*p *
0.05). Moreover, females had significantly higher values for
central augmentation
pressure (cAP), cAIx, AIx@HR75 and ED (*p * 0.05). Because urinary ACR
was skewed, Log ACR was used in the logistic regression analysis.
The values for LVMI, eGFR, CIMT and the percentage of CIMT
abnormality were all significantly higher in men (*p
* 0.05), whereas the percentages for LVH and CKD were higher in women
(*p * 0.05) (Table 1).
3.2 Pearson Correlations of cfPWV and ED with TOD
Pearson correlation analysis showed that cfPWV was positively correlated with LVMI (r = 0.325, p 0.001), LogACR (r = 0.188, p * 0.001) and CIMT (r = 0.283, p * 0.001), but negatively correlated with eGFR (r = –0.234, *p * 0.001). ED was negatively correlated with LVMI (r = –0.132, *p * 0.001), but showed no significant correlations with eGFR (*p = *0.118), LogACR (*p *= 0.184) or CIMT (p = 0.672) (Table 2).
3.3 Multivariate Stepwise Linear Regression Analysis for the
Association of cfPWV and ED with Risk Factors
cfPWV and ED were added separately into multiple stepwise linear regression models with risk factors. The results of this analysis showed that cfPWV was significantly associated with age, pMAP, FBG, HR, height, antihypertensive treatment (yes or no) and BMI (*p * 0.05), while ED was significantly associated with sex, BMI, HR, HDL-c, pMAP and FBG (*p * 0.05) (Table 3).
Table 3.: Multiple stepwise linear regression analysis of cfPWV and ED with risk factors.
3.4 Multivariate Stepwise Linear Regression
Analysis of cfPWV and/or ED with TOD
When cfPWV and ED were added separately to the multivariate stepwise linear
regression model, cfPWV was found to be positively correlated with LVMI (0.131
0.558, p = 0.002) and LogACR (0.123
0.008, p = 0.004), whereas ED was negatively
correlated with LVMI (–0.244 0.045,* p * 0.001) and positively
correlated with eGFR(0.115 0.024, *p = *0.003). This was after
adjustment for age, sex, height, BMI, smoking history (yes or no),
antihypertensive treatment (yes or no), HDL-c, LDL-c, FBG, pMAP and HR.
These correlations did not change when both cfPWV and ED were
analyzed together in the same multivariate stepwise linear regression model with
the risk factors (Table 4).
Table 4.: Multivariate stepwise linear regression analysis of the relationships between cfPWV and/or ED with TOD.
3.5
Multivariate Logistic Regression Analysis of the Relationships between cfPWV and/or ED and TOD
When cfPWV and ED were evaluated separately by multivariate logistic regression analysis and after adjusting for covariates, cfPWV was found to be significantly associated with CKD (OR = 1.240, 95% CI 1.055–1.458, p = 0.009 0.05), while ED was significantly associated with LVH (OR = 0.983, 95% CI 0.975–0.992,* p * 0.001). When both cfPWV and ED, together with the covariates, were analyzed in the same logistic regression analysis model, the significant associations between cfPWV and CKD, and between ED and LVH remained the same (Table 5).
Table 5.: Multivariate stepwise logistic regression analysis of the relationships between cfPWV and/or ED with TOD.
3.6 Multiple Stepwise Logistic Regression Analysis
to Evaluate the Risk of TOD in Different Groups Defined by the Status of cfPWV and ED
After adjusting for the covariates of age, sex, height, BMI, smoking history (yes or no), antihypertensive drugs (yes or no), HDL-c, LDL-c, FBG, pMAP and HR, LVH was found to be significantly greater in Group (high cfPWV, low ED) (OR = 6.799, 95% CI 1.305–35.427, p = 0.023), but significantly lower in Group (high ED) (OR = 0.574, 95% CI 0.374–0.882,* p =* 0.011) compared with Group (control). However, eGFR abnormality, ACR abnormality and CIMT thickness showed no significant differences between the different groups defined by cfPWV and ED levels (Table 6).
Table 6.: Multiple stepwise logistic regression analysis to evaluate the risk of TOD in different groups defined by the status of cfPWV and ED.
4. Discussion
The aim of this study was to investigate the correlations of cfPWV and ED with TOD, so as to inform the possible clinical application of ED in general patients. Whether analyzed separately or together in regression models, we found that cfPWV and ED were associated with specific TOD. Multivariate stepwise linear regression showed that cfPWV was positively correlated with LVMI and LogACR, whereas ED was negatively correlated with LVMI and positively correlated with eGFR. This was observed regardless of whether cfPWV and ED were analyzed separately or in combination. Multivariate stepwise logistic regression analysis showed that cfPWV was only associated with eGFR abnormality, whereas ED was associated with LVH after adjusting for covariates and when analyzed either individually or in combination with cfPWV. The association of ED with LVH was statistically significant when cfPWV was in the normal range. With low ED, elevated cfPWV appeared to significantly affect LVH.
In this study, cfPWV and ED were entered either separately or together into the regression models with the covariates. Since both cfPWV and ED were generated by pulse wave analysis, they were entered separately into the regression models to avoid multicollinearity. However, both cfPWV and ED were associated with TOD, hence they were entered into the same regression model with the covariates in order to evaluate and compare their impacts on TOD. The TOD in different patient groups defined by cfPWV and ED status was also analyzed in this study to help elucidate the possible interactions of cfPWV and ED with TOD. With this approach, the associations of cfPWV and/or ED with TOD could be comprehensively assessed.
The results of this study suggest that the observed association between cfPWV with renal damage was the same using either multivariate stepwise linear or logistic regression analysis, whereas the association between cfPWV and LVMI was not. In contrast, ED was correlated with LVMI and eGFR by multivariate stepwise linear regression analysis, but was only associated with LVH by multivariate stepwise logistic regression analysis. It has been reported in earlier studies that cfPWV was associated with cardiovascular events and TOD [3, 27, 28, 29]. In our previous study, cfPWV showed a significant negative association with eGFR, and the association between arterial stiffness and CKD suggested that cfPWV may be a potential hemodynamic index to evaluate cardiovascular risk in CKD patients with primary hypertension [30]. Moreover, a review of arterial stiffness and CKD reported that pulse wave velocity in patients with CKD is much higher in those with diabetes compared to patients of similar age but without diabetes [31]. The present study showed that cfPWV was correlated with LogACR and was associated with eGFR. These findings concur with previous research showing that cfPWV was significantly associated with CKD and microalbuminuria, suggesting that cfPWV is a vessel-related and renal-related biomarker [32]. However, other studies have shown that arterial stiffness correlates with albuminuria but not with mild-to-moderate CKD [33], thus indicating the need to further investigate the relationship between cfPWV and CKD. In the current study, ED was found to be associated with LVH. ED is defined as the time in the cardiac cycle during which the left ventricle actively ejects blood through the aortic valve and into the circulation [34]. ED has demonstrated value for CVD risk assessment in longitudinal studies [14] and for the progression of heart failure [35]. A proportional relationship was demonstrated between the duration of left ventricular ejection time (LVET), which is a component of systolic function, and overall external myocardial efficiency [36]. A shorter LVET is known to worsen external efficiency. LVET is also directly correlated with the left ventricular ejection fraction (LVEF) and with stroke volume. It is shortened in heart failure with reduced ejection fraction (HFrEF) [37]. In the present study, ED was negatively correlated with LVMI and also with LVH (OR 1), which is similar to previous reports [36, 37]. Regarding the positive correlation observed in the current study between ED and eGFR, Chen et al. [38] found that brachial pre-ejection period (bPEP)/brachial ejection time (bET) was an independent determinant of LVMI and LVEF and was helpful for the prediction of LVEF in patients with CKD. Therefore, the relationship between ED and eGFR requires further clarification.
After adjusting for covariates, we found that LVH was significantly higher in Group (high cfPWV, low ED) patients, but significantly lower in Group (high ED) patients. Previous studies have reported an association between arterial stiffness and left ventricular systolic function [39, 40]. In the present study, shorter ED and elevated cfPWV increased the risk of LVH, whereas normal cfPWV and increased ED was correlated with a significantly lower risk of LVH. Increased cfPWV suggests an increase in arterial stiffness, thereby contributing to dysfunction of cardiac systolic function and thus affecting ED. A previous study showed that cfPWV was significantly associated with LVH in CKD patients [39]. Central PP (pulse pressure), Aix and aortic PWV are key measures of arterial function and are susceptible to left ventricular performance [40]. ED is reported in milliseconds (ED ms) and as a percentage of the cardiac cycle (ED%). Biering-Sørensen et al. [14] found that a shorter LVET (ED ms) was associated with younger age, male sex, higher diastolic blood pressure (BP), higher incidence of diabetes, higher heart rate, higher blood glucose levels and worse fractional shortening (FS), while a lower LVET (ED%) was associated with a significantly increased risk for all events. Although the interactions between ED in combination with cfPWV and LVH are still unverified, the present study suggests there may be dependent or independent associations between ED and arterial stiffness with LVH. This requires further research before individualized management of patients can be achieved.
This study has several potential limitations. Due to its cross-sectional study design and relatively small sample size, the results need further verification in prospective studies. The study was conducted in an Asian population, and hence it is not known whether the results also apply to other ethnic groups. Furthermore, the associations between cfPWV and/or ED with TOD were studied in a general population sample, and comparison of genders should be further investigated. Despite the statistical differences observed for the interactions of cfPWV and ED with LVH, the intrinsic mechanisms involved require further investigation. Although the effects of ED on TOD were discussed in this study, the relationships between pre-ejection period (PEP)/LVET, cardiovascular outcomes and TOD remain unexplored and should be investigated in future studies. The ankle-brachial index (ABI) is defined as the ratio of systolic blood pressure between the ankle and the arm [41]. The ABI is of great significance in screening for peripheral artery disease (PAD) and for predicting cardiovascular disease [42, 43]. A low ABI is an indicator of atherosclerosis, and cfPWV is known to increase as arterial stiffness increases. In an elderly Chinese cohort, the upstroke time per cardiac cycle in the lower extremities showed a significantly stronger association with vascular and renal damage compared with the ABI [44]. Although ABI was not evaluated in the current study, the pathophysiological associations between ABI, cfPWV and ED warrant further research. Finally, the subendocardial viability ratio (SEVR) is an index of myocardial oxygen supply and demand that can be evaluated noninvasively using applanation tonometry. Low SEVR has been associated with reduced coronary flow reserve in patients with hypertension [45]. Although in the current study SEVR was compared between males and females, our focus was on the interaction between cfPWV and ED. Further studies on SEVR should therefore be considered in future research.
5. Conclusions
In conclusion, cfPWV was more strongly associated with renal damage, whereas ED was more strongly associated with LVH. cfPWV and ED affect each other and have a combined effect on LVH. Clinically, more attention should be paid to LVH in patients with high cfPWV and low ED. However, patients with low cfPWV and high ED are likely to have a lower risk of LVH.
The reference list from the paper itself. Each links out to its DOI / PubMed record.
- 1Kaess BM Rong J Larson MG Hamburg NM Vita JA Cheng S et al Relations of Central Hemodynamics and Aortic Stiffness with Left Ventricular Structure and Function: The Framingham Heart Study Journal of the American Heart Association 20165 e 0026932701657410.1161/JAHA.115.002693 PMC 4943246 · doi ↗ · pubmed ↗
- 2Lu Y Zhu M Bai B Chi C Yu S Teliewubai J et al Comparison of Carotid-Femoral and Brachial-Ankle Pulse-Wave Velocity in Association With Target Organ Damage in the Community-Dwelling Elderly Chinese: The Northern Shanghai Study Journal of the American Heart Association 20176 e 0041682821991610.1161/JAHA.116.004168 PMC 5523744 · doi ↗ · pubmed ↗
- 3Vasan RS Short MI Niiranen TJ Xanthakis V De Carli C Cheng S et al Interrelations between Arterial Stiffness, Target Organ Damage, and Cardiovascular Disease Outcomes Journal of the American Heart Association 20198 e 0121413130310610.1161/JAHA.119.012141 PMC 6662123 · doi ↗ · pubmed ↗
- 4Tavakolian K Systolic Time Intervals and New Measurement Method Cardiovascular Engineering and Technology 201671181252704826910.1007/s 13239-016-0262-1 · doi ↗ · pubmed ↗
- 5Biering-Sørensen T Cardiac time intervals by tissue Doppler imaging M-mode echocardiography: reproducibility, reference values, association with clinical characteristics and prognostic implications Danish Medical Journal 201663 B 527927477801 · pubmed ↗
- 6Kjaergaard J Hassager C Oh JK Kristensen JH Berning J Sogaard P Measurement of Cardiac Time Intervals by Doppler Tissue M-Mode Imaging of the Anterior Mitral Leaflet Journal of the American Society of Echocardiography 200518105810651619888310.1016/j.echo.2005.03.043 · doi ↗ · pubmed ↗
- 7Biering-Sørensen T Mogelvang R Pedersen S Schnohr P Sogaard P Jensen JS Usefulness of the myocardial performance index determined by tissue Doppler imaging m-mode for predicting mortality in the general population The American Journal of Cardiology 20111074784832125701810.1016/j.amjcard.2010.09.044 · doi ↗ · pubmed ↗
- 8Di Rienzo M Vaini E Castiglioni P Meriggi P Rizzo F Beat-to-beat estimation of LVET and QS 2 indices of cardiac mechanics from wearable seismocardiography in ambulant subjects Annual International Conference of the IEEE Engineering in Medicine and Biology Society 20132013701770202411136010.1109/EMBC.2013.6611173 · doi ↗ · pubmed ↗