Left Bundle Branch Area Pacing Contributes to a Greater Acute Blood Pressure Reduction Compared to Right Ventricular Pacing
Sijin Wu, Wenzhao Lu, Zhongli Chen, Qingyun Hu, Yao Li, Yuan Gao, Wei Wang, Ying Wu, Ruohan Chen, Yan Dai, Keping Chen, Shu Zhang

TL;DR
This study found that left bundle branch area pacing leads to a greater immediate drop in blood pressure compared to right ventricular pacing in patients with bradycardia.
Contribution
The novel finding is that LBBAP causes a more significant acute systolic blood pressure reduction than RVP, which was previously unexplored.
Findings
LBBAP resulted in a greater systolic blood pressure reduction compared to RVP (Δ11.6 mmHg vs. Δ7.6 mmHg).
Patients with high baseline blood pressure and those not using anti-hypertensive drugs showed a larger SBP reduction with LBBAP.
Systolic blood pressure decreased significantly from baseline to the acute period after pacemaker implantation.
Abstract
Several previous studies have explored the potential arterial blood pressure (BP) changes in patients undergoing right ventricular pacing (RVP), however, the relationship between left bundle branch area pacing (LBBAP) and BP variations remains unknown. This study aimed to examine the acute BP variations following LBBAP and RVP implantation in patients with bradycardia. We conducted a single-center retrospective study including all patients who underwent de-novo dual-chamber pacemaker implantation between January 2019 and June 2021. Patients were divided into two groups, LBBAP and RVP, and propensity score-matching (PSM) was used to balance confounding factors. Three time periods were defined according to the timing of the implant: baseline (within 24 hours before implantation), hyper-acute period (0–24 hours post-implantation), and acute period (24–48 hours…
Genes, proteins, chemicals, diseases, species, mutations and cell lines named across the full text — each resolved to its canonical identifier and authoritative record.
Click any figure to enlarge with its caption.
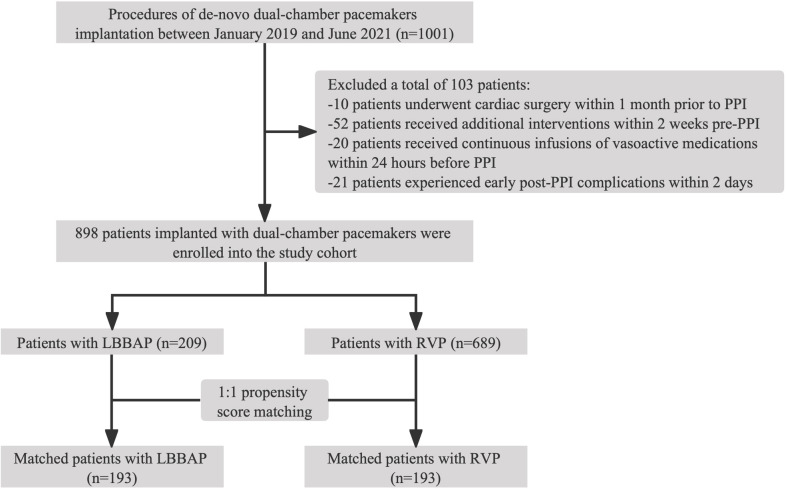 Fig. 1
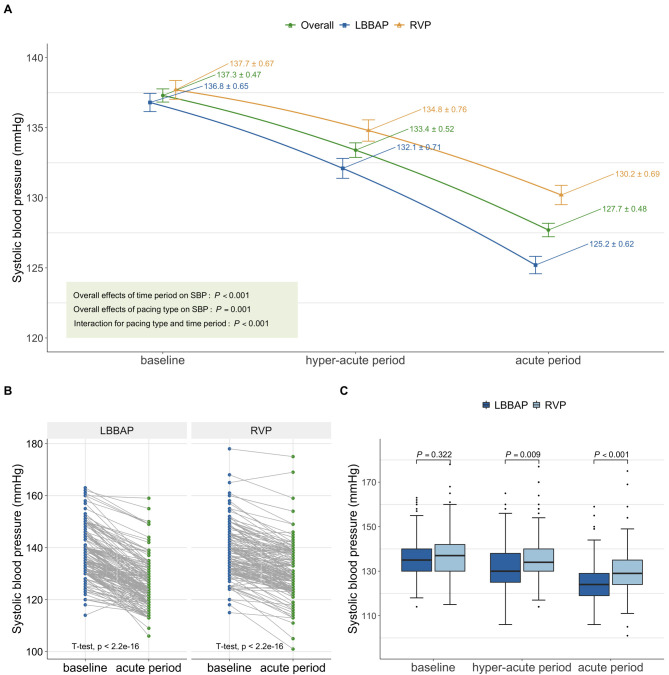 Fig. 2
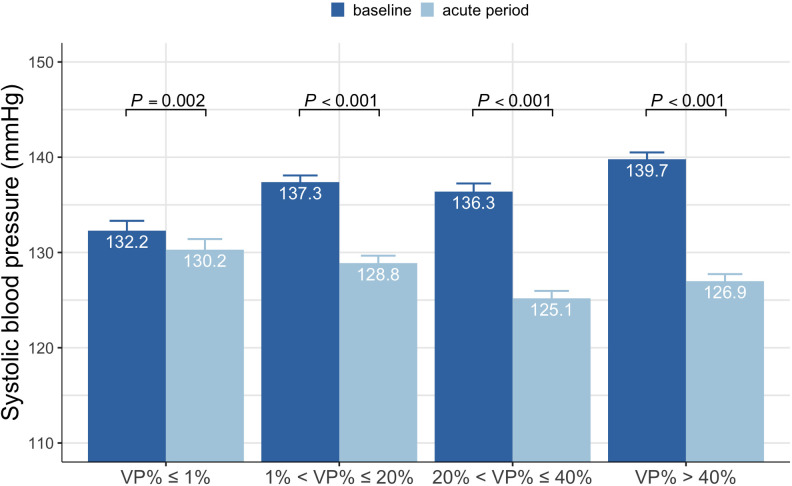 Fig. 3
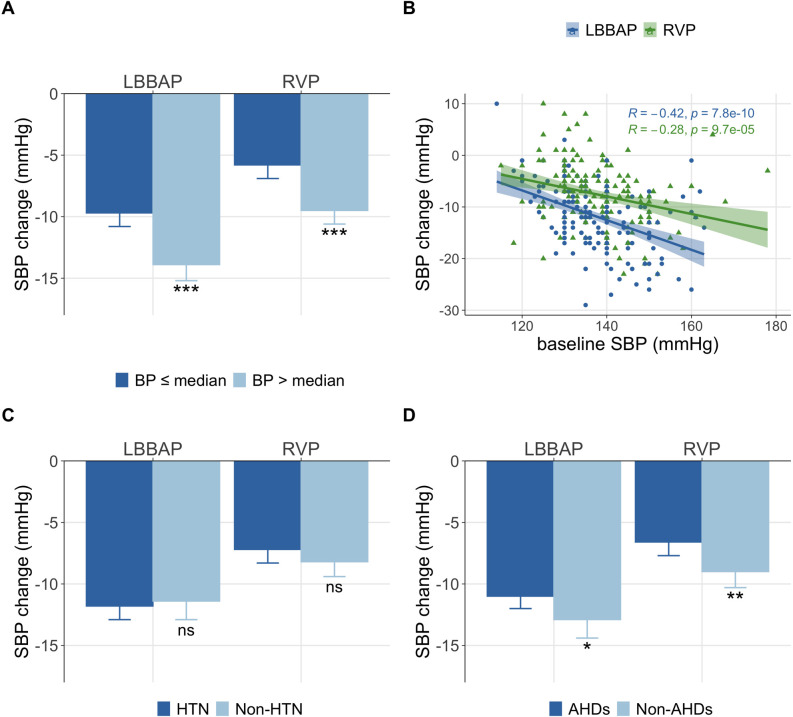 Fig. 4
| Entire cohort | Propensity-score matching cohort | ||||||
| LBBAP | RVP | LBBAP | RVP | ||||
| (n = 209) | (n = 689) | (n = 193 ) | (n = 193) | ||||
| Age, yrs | 61.7 | 67.5 | 62.4 | 63.7 | 0.391 | ||
| Female, n (%) | 103 (49.3) | 381 (55.3) | 0.147 | 99 (51.3) | 91 (47.2) | 0.476 | |
| HR, bpm | 55.9 | 61.7 | 56.8 | 57.7 | 0.466 | ||
| 24 h mean | 55.3 | 58.8 | 55.5 | 56.3 | 0.450 | ||
| SBP, mmHg | 137.1 | 135.4 | 0.019 | 136.8 | 137.7 | 0.322 | |
| DBP, mmHg | 73.1 | 73.2 | 0.928 | 73.3 | 73.8 | 0.545 | |
| LVEF, % | 62.0 | 62.6 | 0.180 | 62.2 | 61.9 | 0.620 | |
| LVEDD, mm | 48.2 | 47.4 | 0.033 | 48.1 | 48.4 | 0.646 | |
| Pacemaker indication, n (%) | 0.918 | ||||||
| SND | 83 (39.7) | 548 (79.5) | 83 (43.0) | 81 (42.0) | |||
| AVB | 126 (60.3) | 141 (20.5) | 110 (57.0) | 112 (58.0) | |||
| Intrinsic | 0.830 | ||||||
| Sinus | 179 (85.6) | 608 (88.2) | 168 (87.0) | 173 (89.6) | |||
| AF | 3 (1.4) | 32 (4.6) | 3 (1.6) | 3 (1.6) | |||
| Escape | 23 (11.0) | 24 (3.5) | 18 (9.3) | 13 (6.7) | |||
| Temporary pacing | 4 (1.9) | 25 (3.6) | 4 (2.1) | 4 (2.1) | |||
|
| |||||||
| Hypertension, n (%) | 130 (62.2) | 423 (61.4) | 0.897 | 119 (61.7) | 115 (59.6) | 0.755 | |
| Dyslipidemia, n (%) | 96 (45.9) | 338 (49.1) | 0.476 | 88 (45.6) | 92 (47.7) | 0.760 | |
| Coronary artery disease, n (%) | 56 (26.8) | 206 (29.9) | 0.437 | 52 (26.9) | 56 (29.0) | 0.734 | |
| AF/AFL, n (%) | 31 (14.8) | 253 (36.7) | 31 (16.1) | 27 (14.0) | 0.669 | ||
| Antihypertensive drugs | |||||||
| Beta-Blocker, n (%) | 82 (39.2) | 271 (39.3) | 1.000 | 75 (38.9) | 75 (38.9) | 1.000 | |
| ACEi/ARB, n (%) | 89 (42.6) | 211 (30.6) | 0.002 | 78 (40.4) | 75 (38.9) | 0.835 | |
| CCB, n (%) | 77 (36.8) | 203 (29.5) | 0.053 | 72 (37.3) | 65 (33.7) | 0.523 | |
| Diuretic, n (%) | 42 (20.1) | 69 (10.0) | 34 (17.6) | 31 (16.1) | 0.786 | ||
| LBBAP | RVP | |||
| Baseline QRS duration, ms | 99.9 | 100.1 | 0.937 | |
| Pacing QRS duration, ms | 117.4 | 151.7 | ||
| Intrinsic QRS morphology | 0.283 | |||
| Normal | 161 | 157 | ||
| IVCD | 4 | 11 | ||
| LBBB | 7 | 8 | ||
| RBBB | 21 | 17 | ||
| Pacing | 0.6 | 0.5 | ||
| Sensing amplitude, mV | 10.6 | 9.8 | 0.083 | |
| Impedance, ohms | 769.3 | 792.4 | 0.145 | |
| Lower rate | 60.0 | 59.9 | 0.739 | |
| AP% after | 10.4 (1.0, 65.9) | 20.0 (1.0, 71.6) | 0.650 | |
| VP% after implant | 29.0 (5.5, 99.7) | 22.0 (2.1, 98.0) | 0.117 | |
| Before matching | After matching | |||||||
| LBBAP | RVP | Mean difference (95% CI) | LBBAP | RVP | Mean difference (95% CI) | |||
| (n = 209) | (n = 689) | (n = 193) | (n = 193) | |||||
| Mean SBP in hyper-acute period, mmHg | 131.4 | 132.8 | –1.4 (–3.0, 0.2) | 0.090 | 132.1 | 134.8 | –2.7 (–4.8, –0.7) | 0.009 |
| Mean SBP in acute period, mmHg | 125.0 | 127.0 | –2.0 (–3.4, –0.6) | 0.005 | 125.2 | 130.2 | –5.0 (–6.8, –3.2) | |
| SBP variation from baseline, mmHg | 12.1 | 8.4 | 3.7 (2.7, 4.6) | 11.6 | 7.6 | 4.0 (2.9, 5.2) | ||
| Subgroup | No. of patients | HR, bpm | SBP, mmHg | SBP change, mmHg | ||||
| Baseline | Acute period | Baseline | Acute period | Mean difference (95% CI) | ||||
| LBBAP | 193 | |||||||
| Baseline SBP | ||||||||
| BP | 105 | 56.0 | 64.0 | 130.2 | 120.6 | –9.7 (–10.8, –8.6) | ||
| BP | 88 | 57.7 | 66.2 | 144.7 | 130.7 | –13.9 (–15.2, –12.7) | ||
| Comorbidity | 0.637 | |||||||
| HTN | 119 | 55.3 | 65.0 | 138.6 | 126.9 | –11.8 (–12.9, –10.7) | ||
| Non-HTN | 74 | 59.1 | 64.9 | 133.9 | 122.5 | –11.4 (–12.9, –9.8) | ||
| Drugs | 0.045 | |||||||
| AHDs | 127 | 55.3 | 65.0 | 137.5 | 126.5 | –11.0 (–12.0, –9.9) | ||
| Non-AHDs | 66 | 59.6 | 65.0 | 135.5 | 122.6 | –12.9 (–14.4, –11.3) | ||
| RVP | 193 | |||||||
| Baseline SBP | ||||||||
| BP | 100 | 56.4 | 66.3 | 130.7 | 125.0 | –5.8 (–6.9, –4.7) | ||
| BP | 93 | 59.1 | 65.1 | 145.2 | 135.8 | –9.5 (–10.6, –8.3) | ||
| Comorbidity | 0.232 | |||||||
| HTN | 115 | 54.9 | 65.2 | 139.8 | 132.6 | –7.2 (–8.3, –6.1) | ||
| Non-HTN | 78 | 61.9 | 66.5 | 134.7 | 126.5 | –8.2 (–9.4, –6.9) | ||
| Drugs | 0.005 | |||||||
| AHDs | 117 | 55.0 | 64.9 | 139.3 | 132.6 | –6.6 (–7.7, –5.6) | ||
| Non-AHDs | 76 | 61.9 | 66.9 | 135.3 | 126.3 | –9.0 (–10.3, –7.7) | ||
- —National Natural Science Foundation (NSFC) of China
- —National High Level Hospital Clinical Research Funding
Peer Reviews
No public reviews on file for this paper yet. If you reviewed it on a platform where reviews are public (OpenReview, ICLR, NeurIPS, ICML), you can paste yours below so the community can read it here.
Videos
No videos yet. Explain this paper in a talk, walkthrough, or lecture? Add one.
Taxonomy
TopicsCardiac pacing and defibrillation studies · Cardiac Arrhythmias and Treatments · Cardiovascular Syncope and Autonomic Disorders
1. Introduction
Cardiac pacing is the primary treatment for symptomatic bradycardia or high-grade atrioventricular block [1]. In clinical practice, right ventricular pacing (RVP) has been a well-established technique for decades. Accumulated evidence indicates that chronic RVP can cause dyssynchronous left ventricular electrical activation and consequently results in deleterious impacts on cardiac function [2, 3, 4]. This is particularly true for patients with a high percentage of ventricular pacing (VP%), typically defined as VP% 40%. Left bundle branch area pacing (LBBAP), an emerging physiological pacing modality, has been introduced in recent years [5]. By directly stimulating the cardiac conduction system, LBBAP can preserve intraventricular and interventricular electrical and mechanical synchrony [6, 7]. Multiple studies have demonstrated the clinical superiority of LBBAP over conventional RVP, including improvements in all-cause mortality, reductions in heart failure hospitalization, and a decreased risk of atrial fibrillation [8, 9, 10].
Blood pressure (BP) is a useful hemodynamic indicator that is dynamically modulated by both the autonomic nervous system (ANS, sympathetic and vagal reflex) and neurohumoral factors (circulating catecholamines, neuropeptides, rein-angiotensin-aldosterone-system). Several studies have reported that patients with chronic bradycardia may experience elevated systolic blood pressure (SBP) [11, 12, 13], which can be attributed to an increased myocardial contraction force (Frank-Starling mechanism) and excessive sympathetic activation secondary to bradycardia. Vice versa, elevated SBP can also lead to bradycardia via baroreflex. An unexpected phenomenon commonly observed is that RVP receivers can undergo BP variations after the implantation, which is termed ‘pacemaker syndrome’ [14, 15]. It refers to a complex of symptoms, consisting of fatigue, palpitations, and shortness of breath, which are related to the adverse hemodynamic and electrophysiological consequences of ventricular pacing. Several potential causes have been linked to the occurrence of pacemaker syndrome, which include retrograde atrial conduction, disruption of regular atrial synchrony at a normal atrioventricular (AV) interval, and insufficient cardiac rate response [14]. Previous studies proposed that pacing might participate in hemodynamic abnormalities by adversely impacting cardiac autonomic baroreflex function, particularly in non-physiological pacing [16, 17]. However, the exact hemodynamic effect of pacing has received little attention in the literature, and no studies have yet focused on the BP variations associated with novel physiological pacing.
We hypothesized that the magnitude of BP variations in ventricular-paced individuals might differ depending on the pacing modalities. Given that LBBAP produces physiological cardiac contractile outcomes of the left ventricle due to the native conduction system, it is likely to confer more favorable hemodynamic effects over less physiological RVP. To test this hypothesis, we examined the BP values pre- and post-implantation in patients who received either LBBAP or RVP.
2. Materials and Methods
2.1 Study Design and Population
This study was a single-center, retrospective, observational study. We consecutively enrolled 1001 adult patients ( 18 years old) who underwent de-novo dual-chamber permanent pacemaker implantation (PPI) at Fuwai Hospital (Beijing, China) between 1 January 2019 and 30 June 2021. The decision for pacemaker treatment was made according to Class I or II guideline recommendations [1]. To minimize the effect of confounding factors on hemodynamics, we excluded patients if they: (i) underwent cardiac surgery within 1 month prior to PPI; (ii) received additional interventional procedures within 2 weeks before implantation (coronary angiography, catheter ablation of tachyarrhythmias, transcatheter aortic valve replacement); (iii) received continuous infusions of vasoactive drugs within 24 hours before implantation (adrenaline, isoprenaline, norepinephrine, dopamine). In cases of isoproterenol non-response, after diagnosing atrioventricular block (AVB), we typically wait for an individualized period to observe the patient’s condition and symptom progression; (iv) experienced early post-implantation complications within 2 days, such as lead dislodgement, elevated capture threshold ( 5 V/0.4 ms), pneumothorax, and infection. Patients were divided into two groups by pacing modality, LBBAP and RVP, which were determined by the operators based on clinical practice. This study conformed with the Declaration of Helsinki and was approved by the Ethics Committee of Fuwai hospital (No.2019-1149). All participants provided written informed consent for pacemaker implantation and use of data for clinical investigation.
2.2 Pacing Procedure and Device Programming
The LBBAP procedure involves capturing left bundle branch (LBB) via a transventricular-septal approach, as previously described in detail [18]. Briefly, a delivery C315HIS fixed curve sheath with a SelectSecure 3830 pacing lead (Medtronic Inc., Minneapolis, MN, USA) was first positioned in the His bundle region. Then we rotated the sheath to place the lead perpendicularly against the interventricular septum (IVS) and gently advanced the lead helix toward the left side of the septum. The lead was further advanced until LBBAP criteria were achieved. A successful LBBAP procedure was defined as [19]: (i) the paced QRS morphology showed a pattern of right bundle branch conduction delay (RBBD) in lead V1/2 on electrocardiogram (ECG); (ii) an LBB potential was recorded or a shortened peak left ventricular activation time (LVAT) in lead V5/6 was present. RVP was performed using an active fixation lead, which involved implanting the right ventricular lead at the right apex or ventricular septum. The atrial lead was inserted into the right atrial appendage.
As part of our routine practice, we performed device programming at implantation and within 48 hours after pacemaker implantation. An individualized AV delay was programmed according to the intrinsic AV conduction and bundle branch block. To prevent unnecessary ventricular pacing, the automatic AV search algorithm was routinely enabled in patients with intact AV conduction. Multiple parameters were assessed and recorded, including pacing electrical parameters (lead impedance, capture threshold, and R-wave amplitude), sensing amplitude, VP%, and percentage of atrial pacing (AP%).
2.3 Clinical Outcomes and Measurements
The primary outcome of this study was the acute changes in SBP shortly after pacemaker implantation. According to the diagnostic criteria for hypertension established by the International Society of Hypertension (ISH) in 2020 [20], hypertension would be diagnosed when a person’s SBP was 140 mmHg and/or their diastolic blood pressure (DBP) was 90 mmHg. Considering the dynamic nature of blood pressure, three time periods were defined according to the implant timing: baseline (within 24 hours before implantation), hyper-acute period (0–24 hours post-implantation), and acute period (24–48 hours post-implantation). In our unit, all patients undergoing PPI were connected to remote cardiac monitoring during the periprocedural period. BP was measured using an arm pressure cuff at least 3 times per period, along with heart rate (HR). Patients were allowed to rest for 5 minutes before measurements. During blood pressure measurement, patients usually sit in a comfortable position with their arm at heart level and feet flat on the floor. The cuff was then placed around the upper arm, ensuring a snug but not overly tight fit. To ensure accurate measurements, we selected appropriately sized cuffs based on the patient’s arm circumference. Typically, the cuff must cover 75–100% of the individuals arm circumference. All measurements were taken with a fixed arm in an awake state and the values were averaged for analysis. Given the potential for wound pain and anxiety to cause fluctuations in BP and HR, only the values recorded 12–24 hours after implantation were analyzed in the hyper-acute period. All BP and HR data were documented in the patient chart or nursing sheets via the electronic medical system.
2.4 Data Collection
All data collection occurred while patients were admitted into the hospital for pacemaker implantation and before patients were discharged post-implantation. We collected various patient data including demographics, vital signs at each period, cardiovascular comorbidities, antihypertensive drugs (AHDs), ECG and Holter parameters, echocardiography parameters, and periprocedural information. All data were extracted from our hospital’s electronic medical record system. To ensure data accuracy, approximately 5% of medical records were randomly selected and reviewed during the preliminary extraction phase.
2.5 Statistical Analysis
Continuous variables were expressed as the mean standard deviation (SD) or the median (interquartile range). The Student t-test or Wilcoxon rank-sum test was used for comparing continuous variables. Categorical values were presented as counts with percentages and were compared using Pearson’s ^2^ test or Fisher’s exact test.
To minimize confounding bias, we employed propensity score-matching (PSM) [21], which involved estimating the propensity score (PS) using a logistic regression model containing all covariates listed in Table 1. LBBAP and RVP groups were matched at a 1:1 ratio with a 4-digit nearest neighbor algorithm within a caliper of 0.2. In the PSM cohort, repeated measures analysis of variance (ANOVA) was applied to examine the overall SBP changes across all three time points, and Tukey’s method was used for multiple comparisons. An independent sample t-test was used to compare the LBBAP and RVP groups. We performed subgroup analyses within each group to explore potential factors that could influence variations in BP. Subgroup categories were specified by baseline SBP, hypertension status, and use of AHDs. A Pearson correlation analysis was conducted to explore the linear relationship between numerical variables.
Table 1.: Baseline characteristics of the study population in both the entire cohort and the propensity score-matching cohort.
To maximize statistical power and minimize bias that might occur if small proportions of missing data were excluded from analyses, we applied a multiple imputation with chained equations to impute missing values [22]. All statistical analyses were performed using R (version 4.1.2, 2021-11-01, Boston, MA, USA) and a two-sided *p * 0.05 was considered significant.
3. Results
3.1 Baseline Characteristics of the Study Population
In the entire cohort, LBBAP was successfully achieved in 209 patients, whereas 689 patients received RVP, of which, 386 propensity-matched patients (193 LBBAP receivers; 193 RVP receivers) were extracted to serve as the PSM cohort (Fig. 1). Before PSM, the LBBAP group was significantly younger than in RVP (*p * 0.001) and had a lower baseline HR and SBP *(p * 0.001), fewer instances of atrial fibrillation/atrial flutter history (*p * 0.001), and more prescriptions for AHDs. The LBBAP group had a higher proportion of AVB cases compared to the RVP group (60.3% vs. 20.5%, *p * 0.001) and significant differences in intrinsic rhythm at implant between the two groups (*p * 0.001). After 1:1 propensity matching, the two groups were comparable for baseline data. The baseline characteristics of the study population before and after PSM were summarized in Table 1.
Flowchart of patients selection in the cohort. Abbreviations: LBBAP, left bundle branch area pacing; PPI, permanent pacemaker implantation; RVP, right ventricular pacing.
3.2 ECG and Pacing Parameters
The baseline QRS duration (QRSd) and intrinsic QRS morphology were found to be
similar between the LBBAP and RVP groups (*p *= 0.937, p = 0.283,
respectively). However, LBBAP resulted in a relatively narrower paced QRS complex
compared to RVP (117.4 18.4 ms vs. 151.7 13.8 ms, *p *
0.001), and a higher pacing threshold (*p *
0.001). There was no
significant difference in sensing amplitude (p = 0.083) and lead
impedance (p = 0.145) tested at implant between the two groups, nor in
AP% (p = 0.650) and VP% (*p *= 0.117). Further details on the
ECG and pacing parameters for the PSM cohort can be found in Table 2.
3.3 SBP Variations Over Time Periods
A gradual day-over-day reduction in systolic BP after the implantation was observed in the study cohort, from baseline 137.3 9.2 mmHg to the hyper-acute period of 133.4 10.3 mmHg, and then to the acute period of 127.7 9.4 mmHg (*p * 0.001) (Fig. 2A). Multiple comparisons of SBP across the three timepoints were statistically significant (all adjusted *p * 0.001). A similar trend was observed in both LBBAP and RVP groups (Fig. 2A). Individual SBP changes compared between baseline and the acute period were displayed in Fig. 2B. Comparisons of SBP between the two groups were provided in Fig. 2C and and Table 3. There was no significant difference in systolic BP between the LBBAP and RVP group at baseline (p = 0.322). However, after pacemaker implantation, patients who underwent LBBAP experienced a greater SBP reduction compared to those with RVP. In the hyper-acute period, the LBBAP group had a mean SBP of 132.1 9.9 mmHg, which was significantly lower than the RVP group’s mean SBP of 134.8 10.3 mmHg (mean difference [MD] –2.7; 95% CI –4.8 to –0.7, p = 0.009). In the acute period, the mean SBP in the LBBAP group was 125.2 8.5 mmHg, while the RVP group SBP was 130.2 9.4 mmHg in the RVP group (MD –5.0; 95% CI –6.8 to –3.2, *p * 0.001).
SBP changes over time periods in the PSM cohort. (A) SBP changes of the overall population, the LBBAP group, and the RVP group (overall effect was calculated using repetitive measure analysis of variance). The error bar refers to the mean ± standard error (SE). (B) Individual SBP change from baseline to the acute period (p values were calculated by paired t-test). (C) SBP distributions compared between LBBAP group and RVP group (p values were calculated by independent samples t-test). Abbreviations: LBBAP, left bundle branch area pacing; PSM, propensity-score matching; RVP, right ventricular pacing; SBP, systolic blood pressure.
Compared to baseline, both the LBBAP and RVP groups showed a reduction in SBP within 24 to 48 hours post-procedure, with the LBBAP group experiencing a significantly greater decrease of 11.6 6.2 mmHg compared to the RVP group of 7.6 5.8 mmHg. The difference in the SBP change between the two groups was found to be 4.0 mmHg (95% CI 2.9 to 5.2, *p * 0.001), indicating that the LBBAP group had a more pronounced reduction in SBP. This trend was consistent when analyzing data from the entire cohort, with the LBBAP group exhibiting a greater reduction in SBP by 3.7 mmHg compared to the RVP group (95% CI 2.7 to 4.6, *p * 0.001).
3.4 Factors Influencing SBP Changes
To investigate how pacing affects SBP, we stratified all patients enrolled in
the PSM cohort into four groups by VP%: VP% 1%, 1% VP%
20%, 20% VP% 40%, and VP% 40% (with the VP% data following
a mimic U-shaped distribution). All groups experienced a decrease in SBP at the
acute period compared to their baselines. Patients with VP% 40% had a
maximum decrease in SBP, whereas those with VP% 1% experienced a
minimal decrease (Fig. 3). Further analysis indicated that patients with VP%
40% had a 72.5% percentage of AVB, which was markedly higher than the other
groups (Supplementary Table 1). In addition, patients with VP%
1% were more likely to receive pacemaker implantation for sinus node
dysfunction (SND). However, we did not observe a significant difference in SBP
change when compared patients with SND between those with AVB ( 9.9
6.3 mmHg vs. 9.4 6.3 mmHg, p = 0.392)
(Supplementary Table 2).
SBP at baseline and the acute period in different VP% group. SBP, systolic blood pressure; VP%, percentage of ventricular pacing.
Subgroup analyses were conducted in both LBBAP and RVP groups. When assessed by baseline SBP, patients were divided into two groups based on the baseline SBP using the median as a cutoff. Patients with higher baseline SBP had a more pronounced decrease in SBP compared to those with a lower baseline SBP in both the LBBAP and RVP groups (all *p * 0.001) (Fig. 4A). A significant correlation was observed between baseline SBP and the SBP change post-implantation (R = –0.42 for LBBAP and R = –0.28 for RVP, both *p * 0.001) (Fig. 4B). The correlation between the simultaneous HR change and the SBP change post-implantation was displayed in Supplementary Fig. 1. There was no significant difference between patients with or without hypertension (HTN) diagnosis in either group (p = 0.637 in the LBBAP group and p = 0.232 in the RVP group) (Fig. 4C). Patients treated with AHDs had fewer SBP fluctuations than those who did not receive AHDs treatment (*p *= 0.045 in the LBBAP group and p = 0.005 in the RVP group) (Fig. 4D). More detailed data on changes in SBP and HR were provided in Table 4. Further subgroup analyses revealed that patients receiving LBBAP exhibited a greater SBP reduction than those receiving RVP who had similar baseline HR and SBP (Supplementary Table 3).
Association of basic characteristics with SBP change. (A) SBP change compared between different baseline BP. (B) The correlation between baseline BP and SBP change (R refers to the Pearson correlation coefficient). (C) SBP change compared between patients with or without HTN. (D) SBP change compared between patients with or without AHDs. The error bar referred to the mean ± 95% CI. Notes: The significance levels were presented as follows: * p <0.05, ** p <0.01, and *** p <0.001. Abbreviations: HTN, hypertension; AHDs, anti-hypertensive drugs; BP, blood pressure; LBBAP, left bundle branch area pacing; RVP, right ventricular pacing; SBP, systolic blood pressure; ns, non significant.
4. Discussion
In this retrospective cohort study with a large sample size, we provided further insight into acute blood pressure changes post-implantation of LBBAP and RVP. Our PS-matched comparison between the LBBAP and RVP group yielded several significant and clinically meaningful findings: (1) the implantation of permanent pacemakers for patients with conduction system disease could contribute to a significant decrease in systolic blood pressure shortly after the implantation; (2) this immediate effect was more pronounced in LBBAP receivers than in RVP receivers, suggesting that LBBAP might have stronger physiological hemodynamic effects; and (3) baseline SBP and the use of anti-hypertensive drugs were potentially associated with the magnitude of arterial BP reduction post pacemaker implantation.
An earlier study noted a potential correlation between the maximal arterial BP differences observed during ventricular pacing, especially comparing AV synchrony with maximal AV asynchrony, and the subsequent improvement in cardiac index [23]. That study suggested that BP variability could be a more valuable indicator of the hemodynamic impact in ventricular-paced individuals. Channon et al. [17] reported that paced individuals exhibit a reduction in BP, and the beat-to-beat BP variability was greatly increased when changed from DDD to VVI pacing. A cohort of 24 dual-pacemaker patients focused on the effects of pacing sites on blood pressure, showed that right ventricle (RV) septal pacing was associated with less BP variation compared with RV apical pacing in the VVI mode [15]. Our results with a large study cohort demonstrated an immediate and substantial systolic BP reduction after pacemaker implantation.
Several possible pathophysiological mechanisms may have been responsible for the acute hemodynamic changes in response to pacing. First, almost all patients receiving permanent pacemaker implantation suffer from bradycardias. Compensatory elevation of SBP may occur due to an increased contraction force following increased ventricular filling during bradycardia (the Frank-Starling mechanism), leading to a greater stroke volume (SV) and hence the increased systolic BP [24]. Furthermore, increased left ventricle (LV) filling may stimulate the sympathetic afferent fibers distributed in the heart through cardiac wall distension. Pacing corrects the bradycardia and thus prevents overcompensation of BP. A recent case report [13] suggested that pacemaker implantation resulted in increased cardiac output and a marked reduction in peripheral resistance, which might be due to other less well-understood mechanisms contributing to the decrease in BP.
A similar trend of SBP reduction was observed in both LBBAP and RVP receivers in the present study, however, the magnitude of BP reduction was more profound in the LBBAP group. LBBAP involves placing the ventricular electrode in the left bundle branch region, and our results were consistent with previous studies [25, 26, 27] showing that it produced a narrower paced QRS complex and a relatively lower pacing threshold, leading to improved LV synchrony. In general, improved LV synchrony may increase the stroke volume and cardiac output (CO), which could lead to decreased BP variation. An unexpected trend was observed in the present study. Since the ANS plays an important role in modulating cardiovascular functions and maintaining blood pressure homeostasis [28], we speculated that the ANS might participate in this hemodynamic regulation, since improved cardiac work during LBBAP may cause a decrease in elevated sympathetic activation. RVP is essentially a non-physiological modality that mimics left bundle branch block (LBBB), which may disrupt normal electrical activity and activate the sympathetic nerve system. Therefore, increased sympathetic activity may compensate for the magnitude of BP reduction by pacing. Further research that includes a more comprehensive assessment of ANS and more hemodynamic parameters may prove helpful to evaluate this hypothesis.
Patients with AVB tend to have a higher VP% than those with SND. Our study found that BP variations appeared to be more pronounced in the high-VP% group, which could be attributed to loss of AV synchrony and atrial contraction in patients with a high VP%. However, this does not necessarily imply a direct linear correlation between VP% and BP variations. To date, there is no evidence suggesting a dose-dependent correlation between BP reduction and pacing burden. In patients with a low VP% (e.g., VP% 1%), atrial pacing may still cause BP variations, yet its influence may be less than ventricular pacing. Nevertheless, we did not find a significant difference in SBP between patients with AVB and those with SND. In fact, several confounding factors related to conduction system dysfunction (baseline BP, atrioventricular conduction, ANS modulation), might play a more important role in blood pressure fluctuations and could have influenced the combined results. Therefore, these factors should be comprehensively considered when interpreting our findings, and further research is needed to determine the exact association between BP reduction and VP%.
The regulation of blood pressure in humans is a highly intricate process. In the present study, we tried to identify which subgroup would experience more pronounced BP variations. A significant difference in SBP change was found between patients grouped by their baseline SBP and those grouped by the use of AHDs, while changes were not comparable between patients grouped by their combined history of hypertension. Multiple studies have clearly illustrated that abnormal sympathetic activity may be responsible for the appearance and maintenance of high blood pressure [29, 30, 31]. In our study, the mean baseline SBP was around 145 mmHg in the group with a higher baseline SBP, meeting the diagnostic criteria for hypertension [20]. Instantaneous sympathetic tone may be higher in these patients. In contrast, certain anti-hypertensive medications may reduce sympathetic activity and improve vagal cardiac control [32, 33], potentially resulting in a relatively lower basal sympathetic tone in patients treated with these drugs compared to those without AHDs. Conversely, patients with a history of hypertension, who have undergone long-term anti-hypertensive treatments, may no longer differ from those without a HTN history in baseline BP and sympathetic tone. This could explain why higher baseline BP was potentially linked to high BP variation while the use of AHDs produced an opposite trend. Based on these findings, we assumed that higher baseline sympathetic activity may contribute to a greater magnitude of SBP reduction after the initiation of pacing therapy that alleviates sympathetic activity. No relevant studies are currently available, and future experimental and clinical investigations are necessary to validate our assumption.
As a new emerging pacing strategy, LBBAP delivers a huge breakthrough in conduction system pacing, and it is meaningful to illustrate its hemodynamic outcomes. This study produced a preliminary insight into the acute variations in blood pressure during pacemaker implantation and the initiation of pacing therapy by comparing LBBAP with RVP using propensity score matching. Our findings will help clinicians gain a comprehensive understanding of the LBBAP technique and promote its further adoption. It is worth noting that the acute hemodynamic responses may differ between de-novo pacemaker recipients and chronically paced patients, highlighting the requirement for further research on its long-term hemodynamic impact. Moreover, it is necessary for future prospective studies to comprehensively measure and record more hemodynamic parameters such as cardiac output, total peripheral resistance, and respiratory rate, and characterize the timeline of hemodynamic changes during pacing therapy. Since LBBAP produces a more synchronized ventricular motion, future studies could also incorporate echocardiographic assessment to evaluate the relationship between hemodynamic changes and improved cardiac function.
5. Limitations
The present study has several limitations. First, it was a single-center retrospective analysis, and the potential bias inherent in a non-randomized design cannot be avoided. Although we performed PSM to minimize the confounding factors between LBBAP and RVP patients, heterogeneity among patients still remained. Second, blood pressure is a dynamic parameter that can be influenced by various factors. Specifically, some of the enrolled patients receiving pacemaker implantation were critically ill. During critical illness, the body undergoes significant stress and physiological changes that can affect blood pressure. Inpatient hospital stays can cause BP fluctuations for other hospitalized patients, stemming from factors such as stress, medications, fluid imbalances, and illness progression. In contrast to home/ambulatory blood pressure, measuring blood pressure during inpatient stays may offer a less comprehensive assessment. This limitation can interfere with our ability to accurately reflect the true BP changes. Third, the use of an arm pressure cuff for BP measurement could have introduced some measurement errors. As this study was conducted retrospectively, it was not feasible to utilize invasive blood pressure transducers to confirm the accuracy of external arm cuff-based pressure readings for each participant. Additionally, the majority of enrolled patients had no indications for invasive blood pressure monitoring. In the future, we can consider applying invasive blood pressure monitoring techniques to observe the effects of pacing on blood pressure in appropriate patients. Fourth, the present study did not investigate the physiological mechanisms underlying the acute BP reduction caused by pacing. We speculate that pacing may have corrected the bradycardia and thereby eliminated the associated compensatory BP elevation. We considered this phenomenon as a physiological response, returning the blood pressure to the patient’s normal level. However, it is essential to note that significant periprocedural BP fluctuations could increase the risk of adverse events. Therefore, close monitoring of blood pressure should be implemented during the periprocedural period of pacing. Future well-designed clinical or mechanical studies could simultaneously measure other hemodynamic parameters to gain deeper insights into the mechanisms underlying this phenomenon.
6. Conclusions
Permanent pacemaker implantation may contribute to a decrease in systolic blood pressure shortly after implantation, which is more prominent in LBBAP receivers. Baseline SBP and the use of anti-hypertensive drugs are potentially associated with the magnitude of BP variation. Further large-scale prospective studies are needed to confirm the exact relationship between cardiac pacing and blood pressure variation, as well as the long-term hemodynamic effects of LBBAP versus RVP.
The reference list from the paper itself. Each links out to its DOI / PubMed record.
- 1Kusumoto FM Schoenfeld MH Barrett C Edgerton JR Ellenbogen KA Gold MR et al 2018 ACC/AHA/HRS Guideline on the Evaluation and Management of Patients with Bradycardia and Cardiac Conduction Delay: Executive Summary: A Report of the American College of Cardiology/American Heart Association Task Force on Clinical Practice Guidelines, and the Heart Rhythm Society Circulation 2019140 e 333e 3813058677110.1161/CIR.0000000000000627 · doi ↗ · pubmed ↗
- 2Nielsen JC Kristensen L Andersen HR Mortensen PT Pedersen OL Pedersen AK A randomized comparison of atrial and dual-chamber pacing in 177 consecutive patients with sick sinus syndrome: echocardiographic and clinical outcome Journal of the American College of Cardiology 2003426146231293259010.1016/s 0735-1097(03)00757-5 · doi ↗ · pubmed ↗
- 3Sweeney MO Hellkamp AS Ellenbogen KA Greenspon AJ Freedman RA Lee KL et al Adverse effect of ventricular pacing on heart failure and atrial fibrillation among patients with normal baseline QRS duration in a clinical trial of pacemaker therapy for sinus node dysfunction Circulation 2003107293229371278256610.1161/01.CIR.0000072769.17295.B 1 · doi ↗ · pubmed ↗
- 4Sweeney MO Bank AJ Nsah E Koullick M Zeng QC Hettrick D et al Minimizing ventricular pacing to reduce atrial fibrillation in sinus-node disease The New England Journal of Medicine 2007357100010081780484410.1056/NEJ Moa 071880 · doi ↗ · pubmed ↗
- 5Huang W Su L Wu S Xu L Xiao F Zhou X et al A Novel Pacing Strategy with Low and Stable Output: Pacing the Left Bundle Branch Immediately Beyond the Conduction Block The Canadian Journal of Cardiology 2017331736.e 11736.e 310.1016/j.cjca.2017.09.01329173611 · doi ↗ · pubmed ↗
- 6Chen K Li Y Dai Y Sun Q Luo B Li C et al Comparison of electrocardiogram characteristics and pacing parameters between left bundle branch pacing and right ventricular pacing in patients receiving pacemaker therapy Europace: European Pacing, Arrhythmias, and Cardiac Electrophysiology: Journal of the Working Groups on Cardiac Pacing, Arrhythmias, and Cardiac Cellular Electrophysiology of the European Society of Cardiology 2019216736803046220710.1093/europace/euy 252 · doi ↗ · pubmed ↗
- 7Hou X Qian Z Wang Y Qiu Y Chen X Jiang H et al Feasibility and cardiac synchrony of permanent left bundle branch pacing through the interventricular septum Europace: European Pacing, Arrhythmias, and Cardiac Electrophysiology: Journal of the Working Groups on Cardiac Pacing, Arrhythmias, and Cardiac Cellular Electrophysiology of the European Society of Cardiology 201921169417023132265110.1093/europace/euz 188 · doi ↗ · pubmed ↗
- 8Sharma PS Patel NR Ravi V Zalavadia DV Dommaraju S Garg V et al Clinical outcomes of left bundle branch area pacing compared to right ventricular pacing: Results from the Geisinger-Rush Conduction System Pacing Registry Heart Rhythm 2022193113448198510.1016/j.hrthm.2021.08.033 · doi ↗ · pubmed ↗