The Burden of Hepatitis A Outbreaks in the United States: Health Outcomes, Economic Costs, and Management Strategies
Emily K Horn, Oscar Herrera-Restrepo, Anna M Acosta, Alyssa Simon, Bianca Jackson, Eleanor Lucas

TL;DR
Hepatitis A outbreaks in the US since 2016 have caused significant health and economic impacts, highlighting the need for better prevention and vaccination efforts.
Contribution
This study systematically reviews health outcomes, economic costs, and management strategies of HepA outbreaks in the US since 2016.
Findings
Hospitalization rates during HepA outbreaks ranged from 41.6% to 84.8%.
The average cost of hospitalization due to HepA outbreaks was over $16,000.
Challenges in outbreak management include reaching at-risk groups and vaccine distrust.
Abstract
Hepatitis A (HepA) vaccines are recommended for US adults at risk of HepA. Ongoing United States (US) HepA outbreaks since 2016 have primarily spread person-to-person, especially among at-risk groups. We investigated the health outcomes, economic burden, and outbreak management considerations associated with HepA outbreaks from 2016 onwards. A systematic literature review was conducted to assess HepA outbreak-associated health outcomes, health care resource utilization (HCRU), and economic burden. A targeted literature review evaluated HepA outbreak management considerations. Across 33 studies reporting on HepA outbreak-associated health outcomes/HCRU, frequently reported HepA-related morbidities included acute liver failure/injury (n = 6 studies of 33 studies) and liver transplantation (n = 5 of 33); reported case fatality rates ranged from 0% to 10.8%. Hospitalization rates reported…
Genes, proteins, chemicals, diseases, species, mutations and cell lines named across the full text — each resolved to its canonical identifier and authoritative record.
Click any figure to enlarge with its caption.
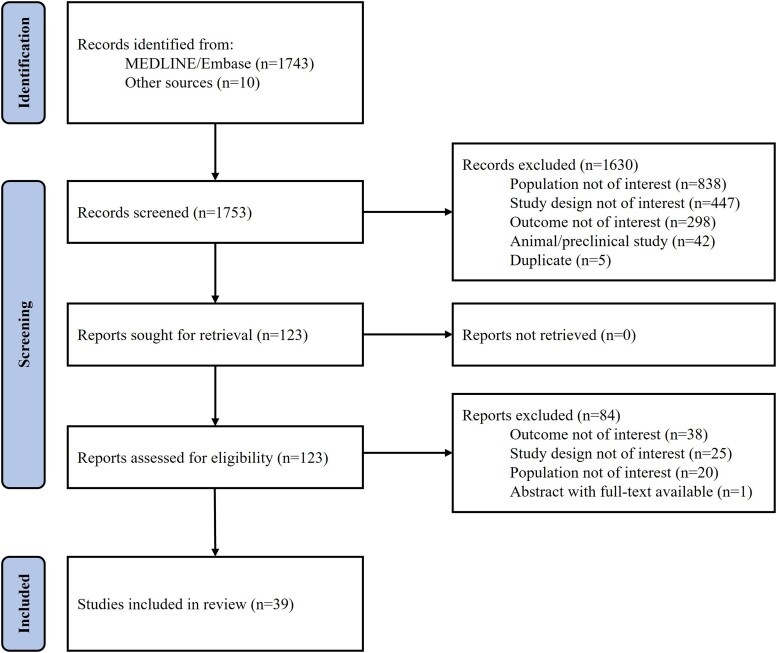 Figure 1
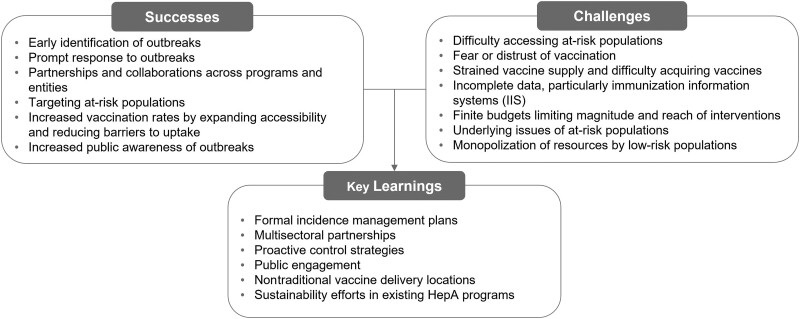 Figure 2
| Reference | Location, Study Population | Subgroup | Morbidity, | Case Fatality, | HCRU | |||
|---|---|---|---|---|---|---|---|---|
| Rate of Any Hospitalization, | LOS, | Rate of ICU Admission, | Outpatient Visits, ED Visits, 30-d Readmission Rates and Treatment Utilization, n/N (%) | |||||
| Altamimi 2018 [ | Health System within Southeast MI | Overall | Liver transplant: 1/166 (0.6) | 18/166 (10.8) | 122/166 (73.5) | NR | 44/166 (26.5) | 30-d readmission rate: 7/166 (4.2) |
| Brouwer 2020 [ | MI | Overall | NR | 30/910 (3.0) | 731/910 (80.3) | NR | NR | NR |
| Butt 2020 [ | Charleston, WV | Overall | Sepsis: 44/482 (9.1) | 3/482 (0.6) | 482/482 (100.0) | 2.5 d (4.1) | NR | NR |
| CDC 2021 [ | National | Overall | NR | 2019: 225/18 846 (1.2) | NR | NR | NR | NR |
| CDC 2020 [ | National | Overall | NR | 2018: 171/12 274 (1.4) | 6292/NR (58.0 | NR | NR | NR |
| CDC 2019 [ | National | Overall | NR | 2017: 91/3366 (2.7) | 1154/1717 (67.2) | NR | NR | NR |
| CDC 2018 [ | National | Overall | NR | Death as a result of HepA: 7/1026 (0.7) | 456/1097 (41.6) | NR | NR | NR |
| CDC 2022 [ | National | Overall | NR | 417/44 660 (0.9) | 27 280/44 660 (61.1) | NR | NR | NR |
| CDC 2022 | AZ, CA, MN, ND | Overall | NR | 0/19 (0) | 13/19 (68.4) | NR | NR | NR |
| CDC 2022 | AZ, CA, MD, NY, NC, OR, VA, WV, WI | Overall | NR | 0/143 (0) | 56/143 (39.2) | NR | NR | NR |
| Croker 2018 [ | Los Angeles County, CA | Overall | NR | NR | 4/4 (100.0) | Range: 0–2 d | NR | NR |
| Dankwa 2021 [ | Louisville, KY | Overall | NR | NR | 331/501 (66.1) | NR | NR | NR |
| 2017 | NR | 0/42 (0) | 32/42 (76.2) | NR | NR | NR | ||
| 2018 | NR | 6/458 (1.3) | 299/458 (65.3) | NR | NR | NR | ||
| 2019 | NR | 0/1 (0) | 0/1 (0.0) | NR | NR | NR | ||
| Foster 2018 [ | National | 2012–2017 | NR | 43/2323 (2.0) | 1306/2162 (60.4) | NR | NR | NR |
| Foster 2018 [ | CA, KY, MI, UT | Overall | NR | 41/1521 (3.0) | 1073/1521 (70.5) | NR | NR | NR |
| CA | NR | 21/682 (3.0) | 442/682 (64.8) | NR | NR | NR | ||
| KY | NR | 0/59 (0) | 45/59 (76.3) | NR | NR | NR | ||
| MI | NR | 20/632 (3.0) | 508/632 (80.4) | NR | NR | NR | ||
| UT | NR | 0/148 (0) | 78/148 (52.7) | NR | NR | NR | ||
| Foster 2021 [ | CA, CO, GA, MD, NY, NC, PA, VA | Overall | NR | 0/260 (0) | 124/258 (48.1) | NR | NR | NR |
| Haddix 2020 [ | Los Angeles County, CA | Group with outbreak definition | NR | 0/7 (0) | 5/7 (71.4) | NR | NR | NR |
| National surveillance | NR | NR | 7/10 (70.0) | NR | NR | NR | ||
| Hagan 2022 [ | AZ, AR, CA (San Diego), CO, DE, FL, GA, IL, LA, MA, MI, MN, MS, NV (Southern NV Health District), NH, NM, NY (excluding NYC), NC, OH, PA (Philadelphia), TN, UT, VT, VA, WA | Recent incarceration | NR | 10/2093 (0.5) | 1033/2093 (49.4) | NR | NR | NR |
| Without recent incarceration | NR | 199/16 234 (1.2), | 11 490/16 234 (70.8) | NR | NR | NR | ||
| Hofmeister 2020 [ | National | Overall | Liver transplant: NR/NR (NR); < 10 hospitalizations associated with liver transplantation | NR | NR | NR | NR | NR |
| Hofmeister 2021 [ | KY, MI, WV | Overall | Fulminant hepatitis: 20/460 (4.3); | 7/719 (1.0) | 423/817 (51.8) | Mean (SE): 5.0 (0.3) Median (range): 4 (1–59) d | 40/407 (9.8) | NR |
| KY | Fulminant hepatitis: 9/228 (3.9); | 5/472 (1.1) | 218/472 (46.2) | Mean (SE): 5.4 (0.4) Median (range): 4 (1–59) | 20/208 (9.6) | NR | ||
| MI | Fulminant hepatitis: 9/76 (11.8); | 2/92 (2.2) | 78/92 (84.8) | Mean (SE): 4.7 (0.4) Median (range): 3.5 (1.0–22.0) | 12/73 (16.4) | NR | ||
| WV | Fulminant hepatitis: 2/156 (1.3); | 0/253 (0) | 127/253 (50.2) | Mean (SE): 4.6 (0.4) Median (range): 4.0 (1.0–40.0) | 8/126 (6.3) | NR | ||
| Hofmeister 2021 [ | KY, MI, WV | Cases | ALF: 74/110 (80.4) | NR | 103/108 (95.4) | 1–3 d: 15/101 (14.9) | 81/110 (83.5) | NR |
| Controls | ALF: 14/414 (5.3) | NR | 248/405 (61.2) | 1–3 d: 85/245 (34.7) | 26/414 (11.1) | NR | ||
| Hosseini 2018 [ | San Diego County, CA | Overall | Cholestatic hepatitis: NR/154 (5.0) | 20/588 (3.4) | 403/588 (68.5) | NR | NR | NR |
| Ismail 2020 [ | KY | Overall | Unfavorable outcome | NR | 307/307 (100.0) | NR | 71/307 (23.1) | ED visits: |
| Jiang 2019 [ | San Diego County, CA | Overall | ALF/injury: 11/106 (10.4) | 7/106 (6.6) | 106/106 (100.0) | NR | NR | NR |
| Patients with ALF | NR | 7/11 (63.6) | NR | NR | 11/11 (100) | Treatment utilization: | ||
| Patients with ALF on admission admitted directly to ICU | NR | NR | NR | NR | 5/11 (45.5) | NR | ||
| Patients diagnosed with ALF during hospital stay and transferred to ICU | NR | NR | NR | NR | 5/11 (45.5) | NR | ||
| Patient with ALF on admission and transferred to ICU | NR | NR | NR | NR | 1/11 (9.1) | NR | ||
| Patients without ALF | NR | NR | NR | NR | NR | Treatment utilization: | ||
| Kaigh 2020 [ | Philadelphia, PA | Overall | NR | NR | NR | NR | NR | NR |
| Prevaccination program | NR | NR | 67/73 (91.8) | NR | NR | ED visits: | ||
| Postvaccination program | NR | NR | 31/38 (81.6) | NR | NR | ED visits: | ||
| Kang 2020 [ | San Diego County, CA | Overall | NR | NR | 119/144 (82.6) | Mean: 6 d | NR | NR |
| Kreshak 2018 [ | San Diego, CA | Overall | NR | NR | 112/133 (84.2) | Median: 3 d | 9/133 (6.8) | ED visits: |
| Surviving cohort | NR | NR | NR | Median: 3 d | NR | NR | ||
| Deceased cohort | Sepsis as cause of death, 3/8 (37.5) | 8/133 (6.0) | NR | Median: 18.5 d | NR | NR | ||
| Lee 2020 [ | National | Deceased cohort | Ascites: NR/114 (7.0) | 114/11 740 (1.0) | NR (100.0) | 13 d | NR | NR |
| Surviving cohort | Ascites: NR/11 626 (0.8) | NR | NR (100.0) | 7.35 d | NR | NR | ||
| Oller 2021 [ | Lexington, KY | Overall | NR | NR | 31/31 (100.0) | NR | NR | NR |
| Non-Bup/NX users | NR | NR | 14/14 (100.0) | 12.8 (4.5) | NR | NR | ||
| Bup/NX users | Decompensated cirrhosis: 0/17 (0) | NR | 17/17 (100.0) | 23.8 (5.3) | 0/17 (0) | NR | ||
| Peak 2020 [ | San Diego County, CA | Overall | NR | 20/589 (3.4) | 404/589 (68.6) | NR | NR | NR |
| Reichenbach 2021 [ | Philadelphia, PA | Overall | Acute-on-chronic liver failure: 2/205 (1.0) | 3/205 (1.5) | NR | NR | NR | Outpatient visits: |
| Samala 2021 [ | IN | Overall | Ascites: 37/264 (14.0) | Total deaths: 5/264 (2.0) | NR | NR | NR | NR |
| Viray 2019 | HI (Oahu, Big Island, Kauai, Maui) and out of state | Overall | NR | 2/292 (1.0) | 74/292 (25.3) | Median (range) d: 3 (1–129) | NR | NR |
| Wilson 2019 [ | Kanawha County, WV | Overall | NR | 1/664 (0.1) | 380/664 (57.2) | NR | NR | NR |
| Reference | Location Study Population (N Cases) | Study Period | Currency Year | Cost Definition | Cost ($) |
|---|---|---|---|---|---|
| Direct medical costs | |||||
| Batdorf 2021 [ | WV | 1 January 2018–31 July 2019 | NR | Overall HepA-related Medicaid direct clinical costs | $5 668 729 |
| SUD HepA-related Medicaid direct clinical costs | $4 390 027 | ||||
| Overall inpatient hospital claims with diagnosis of HepA and disorder of liver | $1 440 907 | ||||
| SUD inpatient hospital claims with diagnosis of HepA and disorder of liver | $1 025 389 | ||||
| Dankwa 2021 [ | Louisville, KY | September 2017–June 2019 | NR | Hospitalization costs averted by vaccination program | $490 000 (95% CI, $310 000–700 000) |
| Hofmeister 2020 [ | National | 2017 | 2017 | Nationwide average cost per HepA-related hospitalization | $16 232 (SD, $602; 95% CI, $15 052–$17 411) |
| West North Central Census Division (lowest average cost) | $12 921 (SD, $1443; 95% CI, $10 091–$15 750) | ||||
| Pacific Census Division (highest average cost) | $19 680 (SD, $1932; 95% CI, $15 891–$23 467) | ||||
| July 2016-February 2020 | NR | Total HepA-related hospitalization cost nationally | $306.8 million (SD, $11.4 million) | ||
| Lee 2020 [ | National | 2011–2017 | NR | Inpatient costs of deceased | $155 523 |
| Inpatient costs of survivors | $48 611 | ||||
| Wilson 2020 [ | Local health department area (NR) | 1 October 2015–30 September 2016 | 2016 | Inpatient costs [ | $15 562 |
| Outpatient costs [ | $474 (adjusted) | ||||
| Costs with no care [ | $0 | ||||
| Public health intervention costs | |||||
| Baum 2020 [ | New York City, NY | 2015 | 2017 | Total cost of 2015 DOHMH emergency activation | $65 831 |
| DOHMH personnel services total costs | $55 854 (84.8% of total cost) | ||||
| Nonovertime costs | $30 569 (46.4%) | ||||
| Cash overtime costs | $23 025 (35.0%) | ||||
| Compensatory time | $2260 (3.4%) | ||||
| HepA vaccine | $6778 (10.3%) | ||||
| Emergency activation miscellaneous | $140 (0.2%) | ||||
| Cost per restaurant employee evaluated | $238 | ||||
| 2017 | 2017 | Total cost of 2017 collaboration with private clinic network | $50 914 | ||
| DOHMH personnel services total costs | $3146 (6.2% of total cost) | ||||
| Nonovertime costs | $2878 (5.7%) | ||||
| Cash overtime costs | $118 (0.2%) | ||||
| Compensatory time | $15 (0.3%) | ||||
| HepA vaccine | $5481 (10.8%) | ||||
| Transportation of vaccine | $50 (0.1%) | ||||
| Private clinic network total costs | $42 238 (83%) | ||||
| Personnel services | $38 080 (74.8%) | ||||
| HAV IgM antibody tests | $3366 (6.6%) | ||||
| Medical supplies | $792 (1.6%) | ||||
| Cost per restaurant employee evaluated | $253 | ||||
| Duncan 2018 [ | San Diego County, CA | 2017 | NR | Cost of vaccine intervention using CDC's cost list at $25.73 per dose | $193 515 |
| Ghildayal 2019 [ | National | 2009–2028 | NR | Accrued cost (total; no vaccination policy) | $2 678 008 491 |
| Accrued hospital cost (total; no vaccination policy) | $1 919 964 995 | ||||
| Accrued vaccine cost (total; no vaccination policy) | $758 043 495 | ||||
| Accrued cost (total, universal vaccination policy) | $10 552 726 375 | ||||
| Accrued hospital cost (universal vaccination policy) | $181 442 563 | ||||
| Accrued vaccine cost (universal vaccination policy) | $10 371 283 812 | ||||
| Vaccination cost for 2 doses (universal vaccination policy) | $60 | ||||
| Kaigh 2020 [ | Philadelphia, PA | July 16–8 October 2019 | NR | HepA vaccine dose | $58.40 (free for intervention) |
| Schwartz 2022 [ | NA/National | 30 October 2019–6 November 2019 | NR (likely 2019) | Overall audience ad | $128.21 ($0.97 per result) |
| MSM ad 1 | $13.75 ($0.36 per result) | ||||
| MSM ad 2 | $108.04 ($0.93 per result) | ||||
| FSW ad 1 | $144.47 ($0.99 per result) | ||||
| FSW ad 2 | $51.21 ($0.90 per result) | ||||
| Wilson 2020 [ | Local health department area (NR) | 1 October 2015–30 September 2016 | 2016 | HepA vaccine administration program costs | $10 188 000 |
| HepA adult immunization program costs | $103 004 | ||||
| HepA vaccine dose unit cost | $27.82 | ||||
| Nonvaccine program cost per dose | $40.10 | ||||
| Nonvaccine program costs total (for local health department and community partners providing range of vaccines including HepA) | $377 625 | ||||
| Staffing, local health department | $335 437 | ||||
| Staffing, community partners | $10 400 | ||||
| Travel | $3780 | ||||
| Equipment | $4007 | ||||
| Supplies, medical | $15 000 | ||||
| Supplies, office | $3000 | ||||
| Technology | $3000 | ||||
| Printed materials | $3000 | ||||
| Public health/prevention costs in case of an outbreak (per case) | $592 (Luyten 2009) | ||||
- —GlaxoSmithKline Biologicals SA10.13039/100020955
- —GSK10.13039/100004330
Peer Reviews
No public reviews on file for this paper yet. If you reviewed it on a platform where reviews are public (OpenReview, ICLR, NeurIPS, ICML), you can paste yours below so the community can read it here.
Videos
No videos yet. Explain this paper in a talk, walkthrough, or lecture? Add one.
Taxonomy
TopicsTranslation Studies and Practices · Natural Language Processing Techniques
The ongoing hepatitis A (HepA) virus outbreaks across the United States (US) have spread primarily via person-to-person transmission since 2016, prior to which large outbreaks were often attributable to food contamination [1–3]. People who use drugs, people experiencing homelessness, people who are or were recently incarcerated, men who have sex with men (MSM), and recent international travelers are at highest risk of HepA infection [1–3]. While HepA infection typically results in short-term illness, among some, complications may be severe, ranging from relapsing hepatitis to acute liver failure and even death [4, 5].
Although treatment of HepA remains limited to symptom management and supportive care, infection is preventable with approved HepA vaccines, which first became available in the United States in 1995 [6, 7]. Since 2006, the Centers for Disease Control and Prevention's (CDC) Advisory Committee on Immunization Practices (ACIP) has recommended routine HepA vaccination for all children aged ≥1 year [8]. The ACIP also recommends HepA vaccination for adults at risk of HepA infection or at increased risk of severe disease from HepA infection, as well as adults who want protection against HepA without known risk factors [9]. However, HepA vaccination coverage among US adults remains low [9, 10]. In 2018, only 11.9% of adults self-reported receiving the full HepA vaccine series (≥2 doses) [11], compared with 79.6% coverage among infants by age 35 months (2019–2021) and 84.8% among adolescents aged 13–17 years (2022), as reported by their vaccination providers [12, 13].
Between 2016 and 2023, over 44 000 HepA cases, of which 61% required hospitalization, and over 400 deaths were reported across 37 states [2]. However, infections especially in younger children are typically not accompanied by symptoms, likely resulting in underreporting of cases and consequential overestimations of hospitalization and case fatality rates in the overall population [4]. Nonetheless, the health outcomes and associated health care resource utilization (HCRU) related to these outbreaks incur a considerable economic cost to health care systems [14].
In light of the recent HepA outbreaks and the well-recognized gap in adult HepA vaccination, this study aimed to understand current health outcomes, economic burden, and outbreak management considerations associated with US HepA outbreaks since 2016 to help inform decision makers on the value of HepA prevention.
METHODS
Study Design
A systematic literature review (SLR) was conducted in accordance with the Preferred Reporting Items for Systematic Reviews and Meta-Analyses (PRISMA) guidelines to summarize the evidence regarding the health outcomes, HCRU, and economic burden associated with the ongoing HepA outbreaks [15]. A targeted literature review (TLR) was also conducted to evaluate key outbreak management considerations related to the HepA outbreaks.
Data Collection
A comprehensive set of search terms was combined to search across MEDLINE and Embase on 12 July 2022 (Supplementary Tables 1 and 2 for the SLR and TLR, respectively). The searches were supplemented by Google, government websites, and grey literature (guidelines, commentaries, press releases, and government agency, health agency, and nongovernmental organization reports) searches.
Eligible articles for the SLR were title-/abstract- and full-text screened by 2 independent reviewers (A.S., B.J.), followed by a third reviewer (E.L.) if consensus could not be reached. Articles included in the TLR were screened and identified by 1 independent reviewer (A.S., B.J., E.L.), with 10% of articles checked by a second reviewer (A.S., B.J., E.L.) for quality control. Assessment of publication bias was not conducted.
Studies included in the SLR reported on health outcomes of interest (morbidity, mortality, and HCRU) and/or economic burden (direct, indirect, and public health intervention costs) among adult populations aged ≥18 years living in an area with a HepA outbreak from 2016 onwards (Supplementary Table 3). While studies reporting outcomes among individuals of all ages were included, this review included data only among those aged ≥18 years. Studies reporting on 1 or more key research questions associated with HepA outbreak management (successes, challenges, and key learnings) were included in the TLR. Characteristics and outcomes of included studies were qualitatively described; no statistical analyses were performed.
RESULTS
Of the 1753 studies identified in the SLR, 1630 were excluded following title/abstract screening. Full texts of the remaining 123 studies were reviewed, and 39 were included (Figure 1). Study characteristics and patient populations of included studies are presented in Supplementary Table 4.
PRISMA (Preferred Reporting Items for Systematic Reviews and Meta-Analyses) flow chart.
Health Outcomes and Health Care Resource Utilization
The SLR identified 33 studies reporting on HepA outbreak-associated health outcomes and HCRU (Table 1). These studies reported on 1 state or area within a state (n = 18 studies), multistate (n = 7), or national (n = 8) data. Most studies reporting mode of transmission described HepA cases spread solely through person-to-person contact (n = 11), compared with solely food-borne transmission (n = 3) or both (n = 5).
Of the 33 studies, 30 reported on populations affected by outbreaks, including people: who use drugs or with substance use disorder (SUD) (n = 26), experiencing homelessness (n = 19), currently or recently incarcerated (n = 5), with history of hepatitis B or C infection (n = 4), and MSM (n = 4). Other reported populations affected by HepA outbreaks are listed in Supplementary Table 4.
Morbidity
Morbidity-related health outcomes associated with the HepA outbreaks were reported in 13 of 33 studies (Table 1). The most frequently reported morbidities included acute liver failure (ALF)/injury (1.0%–80.4%; reported across n = 6 studies) [33, 36, 39, 40, 43, 44], liver transplantation (0.2%–0.6%; n = 5) [14, 16, 32, 33, 43], hepatic encephalopathy (0.0%–7.0%; n = 4) [18, 40, 41, 44], and sepsis/septic shock (7.9%–43.0%; n = 4) [18, 36, 39, 40], with variability in results observed across study populations. When stratified by survival status, morbidity rates were substantially higher among deceased cohorts than among surviving cohorts, accounting for the wide ranges reported [33, 40].
Other less-commonly reported HepA-related morbidities included acute kidney injury [40, 44], ascites [40, 44], acute-on-chronic liver failure [43, 44], fulminant hepatitis [32, 41], malnutrition [40], cholestatic hepatitis [34], clinically relapsing hepatitis [34], decompensated cirrhosis [41], renal failure, and respiratory failure [35].
Mortality
Of 26 out of 33 studies reporting on HepA outbreak-related case fatality, rates ranged from 0%–10.8%, with variability across study populations (Table 1) [16, 26]. According to 4 CDC viral hepatitis surveillance reports, the HepA mortality rate was 0.01 deaths per 100 000 persons in 2016, which increased to 0.02 in 2017, 0.05 in 2018, and 0.04 in 2019, and was higher in men and in people aged ≥55 years [19–22].
Three studies identified factors associated with HepA mortality, including: older age [40, 42]; being White or Asian/Pacific Islander [33, 40]; having certain comorbidities [33, 42]; experiencing homelessness [42]; longer hospital length of stay [33, 40]; hospitalization and intensive care unit (ICU) admission [33]; and higher hospitalization costs [40].
Health Care Resource Utilization
Across the SLR, 30 of 33 studies reported HCRU associated with HepA, including any hospitalization (n = 29), ICU admission (n = 7), 30-day readmission rates (n = 2), outpatient visits (n = 1), and medication/treatment utilization (n = 1). Full HCRU results are listed in Table 1. Of studies reporting any hospitalization in the overall population due to outbreaks that did not solely occur via food-borne transmission (n = 17), the majority (n = 14) reported hospitalization rates greater than 50%, ranging from 41.6% of HepA cases nationally reported to the CDC [22], to 84.8% in a cross-sectional study of HepA cases in Michigan [32]. One study found that the large majority of HepA diagnoses were made in the inpatient (84.4%) versus outpatient (15.6%) setting [43]. Reichenbach et al (2021) suggested that this was likely due to educational campaigns by the city's health department about the ongoing outbreak, which may have encouraged patients with symptoms to seek out evaluation, while diagnoses in the outpatient setting were likely often among asymptomatic patients [43].
Length of stay, reported in 10 studies, ranged in the overall population from a mean of 2.5 days among hospitalized patients (predominantly people with SUD) in Charleston, West Virginia [18] to 6 days in hospitalized patients (predominantly people with SUD and/or experiencing homelessness) in San Diego, California [38]. ICU admission rates ranged from 6.3% in West Virginia in 2016–2019 [32], to 26.5% in Southeast Michigan from 2016–2017 [16]. According to a 2016–2019 case-control study in Kentucky, Michigan, and West Virginia, 83.5% of fatal HepA cases were admitted to the ICU, while only 11.1% of HepA survivors were admitted [33]. Two studies identified 30-day readmission rates of 4.2% and 23.4% among HepA patients presenting to health systems in Southeast Michigan and San Diego, California, respectively [16, 39]. No studies were identified that reported on outpatient visit and emergency department visit rates and treatment utilization in the overall population; however, 1 San Diego, California study on treatment utilization in a high-risk (ALF) population found significantly higher rates of treatment utilization in ALF versus non-ALF groups [36].
Economic Burden
In total, 10 studies reported on the economic burden of HepA outbreaks, spanning direct medical costs associated with HCRU and public health intervention costs (Table 2). These studies focused on local or state outbreak data (n = 6) and national data (n = 4), and 7 reported on populations affected by the outbreaks, including people who use drugs/people with SUD (n = 5), people experiencing homelessness (n = 3), food service workers (n = 2), and MSM (n = 1). One study reported person-to-person transmission, while among the remainder, mode of transmission was not reported or not applicable to the study design.
Direct Medical Costs Associated With Health Care Resource Utilization
Five studies reported on direct medical costs associated with HCRU, such as hospitalization, outpatient, vaccination, and Medicaid-specific direct clinical costs. In a 2017 national cohort study, the estimated nationwide average cost per HepA-related hospitalization was 12 921 to 19 680 by region; 2017 USD) [[14](#jiae087-B14)]. Another study in a local health department area reported that estimated inpatient and outpatient costs per HepA case in 2016 were 15 562 and 474, respectively (2016 USD) [[48](#jiae087-B48)]. A national database review reporting on acute HepA cases from 2011–2017 reported estimated inpatient costs stratified by survival status, which ranged from 48 611 per surviving patient to 155 523 per deceased patient (USD, currency year not reported [NR]) [[40](#jiae087-B40)]. One study in West Virginia identified the economic burden related to direct clinical and inpatient costs of the HepA outbreaks among people with SUD, reporting that people with SUD incurred higher costs than people without SUD (ie, 77% of Medicaid direct clinical costs; 71% of total inpatient costs) from 2018–2019 [[47](#jiae087-B47)]. Total HepA-related hospitalization costs from 2016–2020 were estimated to be approximately 306.8 million (USD, currency year NR) [14].
Public Health Intervention Costs
Six studies reported public health intervention costs, centered around prevention (vaccination costs, as well as advertising, administrative, staffing, and equipment costs). In 2017, the cost of the New York City Department of Health and Mental Hygiene's emergency activation collaboration, offering HepA testing and vaccines to food service workers, was 253 per restaurant employee evaluated; 2017 USD) [51]. One national study also evaluated public health intervention costs in a high-risk population (MSM), in addition to food service workers, reporting the cost of a 2019 8-day national Facebook advertising campaign that reached 53 422 users, with an average cost-per-link-click of 445.68 (USD, currency year NR) [54].
Two cost-effectiveness analyses reporting HepA outbreak-related public health intervention costs were also identified, 1 of which modeled total costs of a 2015–2016 HepA vaccination program at 10 188 000 per 100 000 clients (2016 USD, currency year NR) [[48](#jiae087-B48)]. The other national model found that a universal HepA vaccination policy in the United States was cost-effective at 55 778 per quality-adjusted life year gained (USD, currency year NR), compared to a willingness-to-pay threshold of $100 000/quality-adjusted life year gained, and resulted in lower HepA incidence [53].
Outbreak Management
The TLR included 34 studies reporting on the successes (n = 25), challenges (n = 28), and key learnings (n = 24) of outbreak management efforts related to ongoing HepA outbreaks (Supplementary Table 5 and Figure 2). No studies reporting cost drivers of outbreak management were identified.
Successes, challenges, and key learnings associated with US hepatitis A (HepA) outbreak management.
Most of these studies reported on HepA cases at the local or state level (n = 21), rather than multistate (n = 5) or national or global level (n = 8), and many reported on some form of vaccination-related intervention, followed by education and hygiene interventions. Overall, 27 of 34 studies reported on populations affected by the HepA outbreak, including people experiencing homelessness (n = 20), people who use drugs or with SUD (n = 15), people currently or recently incarcerated (n = 6), MSM (n = 5), and people who ate contaminated food (n = 3). Study design and patient populations included in the TLR are summarized in Supplementary Table 6.
Successes
Early detection, early preparation, and prompt response were all found to have a considerable positive impact on HepA outbreak management, as evidenced in California's early outbreak detection efforts, which led to increased vaccination in vulnerable populations [55], Tennessee's allocation of vaccination funds during early outbreak stages [56], and Massachusetts’ integration of surveillance data to expedite outbreak response [57].
Partnerships between organizations were also a key success. Coordination between public health agencies, hospitals, and pharmacies aided in containing a San Diego, California outbreak by increasing vaccination [38, 52]. In Michigan, partnerships expanded the reach of vaccine and education materials to at-risk populations in locations such as bars, prisons, and shelters [58].
Outbreak management tools that used an individualized approach to target at-risk populations were also successful, especially in reducing barriers to vaccination uptake. These tools included targeted computerized alerts [59]; efforts to engage medically underserved populations, implementing innovative vaccine delivery strategies, vaccine tracking, repeat community vaccination events, and vaccination safety informational materials [60]; and offering vaccines in nontraditional settings such as jails, SUD treatment programs, and homeless services [61, 62]. For example, one 2017 San Diego, California outbreak response reported success in adopting a highly individualized approach using vaccination events, educational outreach, and sanitation campaigns (eg, handwashing stations, increased access to public restrooms/hygiene kits) targeted towards people experiencing homelessness [63].
Finally, increasing overall public awareness (eg, through social media) was found to be an effective measure mitigating further HepA outbreak spread (Supplementary Table 5 and Figure 2) [54, 55, 64].
Challenges
Vaccine hesitancy due to fear and distrust, and difficulty accessing at-risk populations, were both challenges of implementing outbreak management tools. In multiple studies, individuals who hesitated or refused HepA vaccination expressed beliefs including danger or uselessness of the vaccine and mistrust of vaccinators or manufacturers [52, 65], as well as of public officials and health care providers (HCPs) [66]. Limited access to medical care or vaccination sites [38, 62], geographic constraints [61], limited resources within correctional facilities [31], and gender discrepancies in social media usage also contributed to difficulty reaching at-risk groups [54].
Other challenges included strains in vaccination supply and resource requirements during periods of high demand and monopolization, and/or scarcity of available resources [52, 67–71]. One San Diego, California study found that because media coverage tends to better reach populations who are not at high risk for HepA, those populations might seek resources that should be preserved for at-risk individuals [52].
Incomplete data on HepA vaccination rates was described as a challenge, as reporting HepA vaccination in immunization information systems is not required in some states [72]. Limited funding was also commonly reported, with supplies, vaccines, and storage equipment further constrained during the coronavirus disease 2019 (COVID-19) pandemic [26, 56, 57, 66, 73, 74]. Additional challenges in outbreak management among at-risk populations were observed at a more systemic level. For example, poor sanitation and/or homelessness have been identified as root causes of outbreaks that need to be addressed (Supplementary Table 5 and Figure 2) [37, 55, 63, 75].
Key Learnings
Formal incidence management plans were found to improve coordination and communication across affected agencies, especially when collaborations were established in advance of outbreaks [55, 60, 61, 66, 68]. Proactive control strategies, particularly vaccination among high-risk groups before or in early stages of outbreaks, were also effective [17, 75].
Key learnings also included the importance of understanding the root causes of disparities in HepA vaccination among different groups. A retrospective cohort study in Illinois and Wisconsin found that among HepA vaccine recipients, people who were insured with Medicare, Hispanic, non-Asian, or who had a history of incarceration were significantly less likely to be vaccinated [76]. Furthermore, directly addressing root causes [75], such as barriers to sanitation and vaccination among people experiencing homelessness [65, 77], is necessary. Alternative routes, such as needle exchange programs [17], and improving hygiene facility and supply accessibility [52], could also be utilized to decrease HepA spread.
Due to distrust of vaccination and government health policies among high-risk groups, developing strategic, nontraditional ways of reaching these groups and communicating HepA vaccination safety and importance were necessary. This included targeted, accessible outreach on social media platforms and word-of-mouth via community leaders [68]. Collaborations, especially those strengthening partnerships between organizations with existing trusted relationships with vulnerable populations, could also improve vaccination uptake [60]. Implementing nontraditional vaccine delivery locations that might be more convenient for higher-risk groups, such as jails and SUD facilities, could also increase vaccination access for these groups [31, 73].
Other key learnings included the importance of building upon preexisting materials or data [26, 78], as well as using informatics tools in increasing vaccination efforts [59], positive public perception of public health efforts [67], formal record keeping [45, 72], and improved social media messaging [54] (Supplementary Table 5 and Figure 2).
DISCUSSION
This review demonstrates the considerable burden of HepA on health and economic outcomes, particularly among at-risk populations. By implementing the successes and addressing the challenges of past HepA outbreak responses, the morbidity, mortality, associated HCRU, and economic burden of these outbreaks can be reduced. Increased vaccine awareness, education, and uptake through targeted efforts of HCPs, public health department leaders, and community organizations are key in preventing future HepA outbreaks.
National and international initiatives have been enacted to prevent and eliminate HepA, including the Viral Hepatitis National Strategic Plan (2021–2025) in the United States and the World Health Organization's Global Health Sector Strategy on Viral Hepatitis [79, 80]. However, vaccination coverage in the United States remains low, especially among populations at highest risk of HepA infection, such as injection drug users and MSM [81]. Therefore, it is critical to address key challenges that remain around vaccination distrust, knowledge gaps, and disease misinformation, via education strategies targeting high-risk groups.
In addition, although HepA and HepA & HepB combination vaccines are available and recommended for adults by the ACIP, adherence to and knowledge of ACIP guidelines vary, and some HCPs still report not recommending vaccination against HepA for reasons including low perceived risk of certain patient populations and uncertainty of guidelines [82, 83]. Focusing on prevention, including targeted efforts in HCP education, could be beneficial in increasing vaccine uptake and reducing HepA disease burden. For example, educating HCPs on risk factors, and making HCPs aware that the ACIP recommends that any person who was not vaccinated previously may be vaccinated, may help to prevent infection among at-risk populations who experience stigma (eg, persons experiencing homelessness, drug users, MSM) [81]. Given the risk of hospitalization and associated direct medical and indirect costs of HepA infection, vaccinating patients without confirmed risk factors may help to further decrease the HCRU and economic burden of HepA. Ultimately, the key outbreak management considerations identified in this study can be used to inform future outbreaks across diverse disease areas outside of HepA, especially other vaccine-preventable diseases.
Among this study's limitations, small sample sizes and variations in study design, populations, and outcomes of included studies, as well as the review's scope (ie, limited to US outbreaks), could impact the generalizability of SLR findings. Gaps in available literature, such as the lack of studies reporting direct and indirect medical costs associated with HepA health outcomes, were also a limitation. The scope also did not include an evaluation of the COVID-19 pandemic's impact on the health outcomes and economic burden of the HepA outbreaks, such as altered health-seeking behaviors and diverted public health resources. There is also a systemic underreporting of HepA cases, especially asymptomatic or nonhospitalized cases, which likely underestimates the true burden of HepA disease and consequently overestimates per-person costs of infection. Differences in ICD coding to define HepA-related outcomes may have also led to variability in reported direct medical costs associated with HCRU. Limitations inherent to conducting TLRs included the possibility of noncomprehensive study identification and reviewer bias. As evidence synthesis focused only on studies considered most relevant, not all evidence was covered in detail in this review; however, key evidence addressing the objectives were identified and included where available. Future research should explore the direct and indirect costs of HepA health outcomes, as well as the effect of the COVID-19 pandemic on HepA incidence and related care.
CONCLUSIONS
This review highlighted the substantial clinical and economic burden of recent HepA outbreaks among US adults, as well as the successes, challenges, and key learnings of outbreak management. By implementing successful practices more broadly and addressing the challenges of past HepA outbreak responses, the considerable morbidity, mortality, associated HCRU and economic burden of these outbreaks can be reduced. Increasing adult vaccination rates via targeted efforts of HCPs and community organizations is essential for preventing future outbreaks. The key learnings identified in this review may help inform local and national decision makers on how to best facilitate and support approaches to reducing HepA burden, as well as the management of outbreaks in other disease areas. Ultimately, these results support the ongoing need for prevention measures such as adult vaccination, especially among high-risk populations, to lower the burden of HepA.
Supplementary Data
Supplementary materials are available at The Journal of Infectious Diseases online (http://jid.oxfordjournals.org/). Supplementary materials consist of data provided by the author that are published to benefit the reader. The posted materials are not copyedited. The contents of all supplementary data are the sole responsibility of the authors. Questions or messages regarding errors should be addressed to the author.
Supplementary Material
jiae087_Supplementary_Data
The reference list from the paper itself. Each links out to its DOI / PubMed record.
- 1CDC . Hepatitis A outbreaks in the United States. https://www.cdc.gov/hepatitis/outbreaks/hepatitisaoutbreaks.htm. Accessed 7 February 2022.
- 2CDC . Person-to-person outbreaks of hepatitis A across the United States. https://www.cdc.gov/hepatitis/outbreaks/2017 March-Hepatitis A.htm. Accessed 7 February 2022.
- 3CDC . Hepatitis A questions and answers for the public. https://www.cdc.gov/hepatitis/hav/afaq.htm#A 1. Accessed 7 February 2022.
- 4CDC . Hepatitis A questions and answers for health professionals. https://www.cdc.gov/hepatitis/hav/havfaq.htm. Accessed 6 December 2022.
- 5Shin EC , Jeong SH. Natural history, clinical manifestations, and pathogenesis of hepatitis A. Cold Spring Harb Perspect Med 2018; 8:a 031708.29440324 10.1101/cshperspect.a 031708 PMC 6120688 · doi ↗ · pubmed ↗
- 6US Food and Drug Administration . Vaccines licensed for use in the United States. https://www.fda.gov/vaccines-blood-biologics/vaccines/vaccines-licensed-use-united-states. Accessed 7 February 2022.
- 7Mayo Clinic . Hepatitis A. 2022. https://www.mayoclinic.org/diseases-conditions/hepatitis-a/diagnosis-treatment/drc-20367055::text=No 20specific 20treatment 20exists 20formonths 20with 20no 20lasting 20damage. Accessed 7 February 2022.
- 8Fiore AE , Wasley A, Bell BP. Prevention of hepatitis A through active or passive immunization: recommendations of the Advisory Committee on Immunization Practices (ACIP). MMWR Recomm Rep 2006; 55:1–23.16708058 · pubmed ↗