Association of Vascular Endothelial Growth Factor (VEGF) and Mouse Model Minute 2 (MDM2) Polymorphisms With Diabetic Retinopathy in a Northwest Indian Population: A Case-Control Study
Manroop Singh Buttar, Kamlesh Guleria, Swarkar Sharma, AJS Bhanwer, Vasudha Sambyal

TL;DR
This study investigates how genetic variations in VEGFA and MDM2 genes are linked to diabetic retinopathy in a Northwest Indian population.
Contribution
This is the first study to report the association of VEGFA promoter variants with diabetic retinopathy risk.
Findings
VEGFA -2549 I allele and II genotype increase the risk of diabetic retinopathy.
VEGFA -7 CT genotype reduces the risk of diabetic retinopathy.
Certain haplotypes of VEGFA polymorphisms are associated with decreased DR risk.
Abstract
Introduction: Diabetic retinopathy (DR), a microvascular complication of type 2 diabetes (T2D), results from complex interactions of genetic and environmental factors. Vascular endothelial growth factor (VEGF) and mouse model minute 2 (MDM2)are upregulated in the retina due to diabetes, which increases the risk of DR. VEGFA and MDM2 genetic variations can influence DR risk. The present case-control study was conducted to evaluate the association of VEGFA and MDM2 promoter variants with DR in a population from Punjab, Northwest India. Methods: A total of 414 DR patients, 425 T2D patients without DR, and 402 healthy controls were screened for VEGFA -2578C/A (rs699947), VEGFA -2549I/D (rs35569394), VEGFA -7C/T (rs25648), and MDM2 rs3730485 polymorphisms using polymerase chain reaction (PCR)-based methods. Results: VEGFA -2549 I allele (OR = 1.35 (1.00-1.81), p = 0.043) and II genotype…
Genes, proteins, chemicals, diseases, species, mutations and cell lines named across the full text — each resolved to its canonical identifier and authoritative record.
Click any figure to enlarge with its caption.
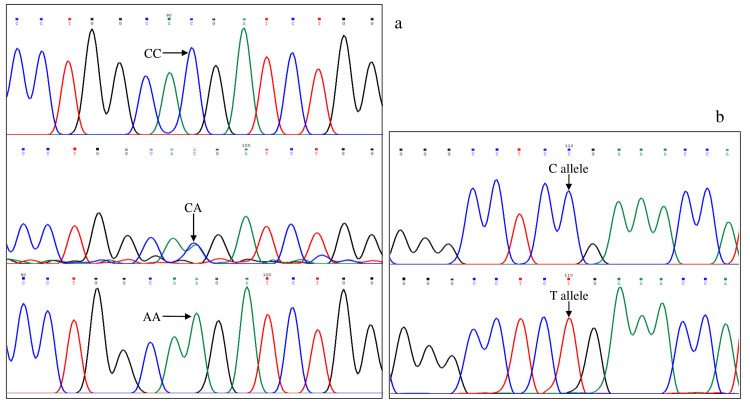 Figure 1
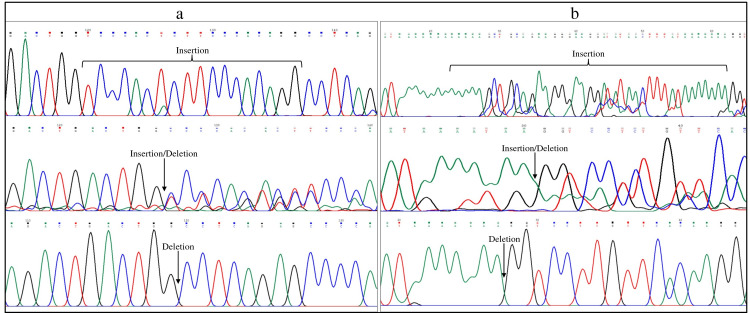 Figure 2
| Polymorphism (RefSNP) | Location | Genotyping method | Annealing temperature | Restriction enzyme used | Allele and Fragment size (bp) | Primer reference |
| VEGFA−2578C/A (rs699947) | Promoter | PCR-RFLP | 59°C | BglII | C- 459 | [ |
| A- 247, 212 | ||||||
| VEGFA −2549I/D (rs35569394) | Promoter | Direct PCR | 55°C | - | D- 211 | [ |
| I- 229 | ||||||
| VEGFA −7C/T (rs25648) | 5′ UTR | ARMS-PCR | 60°C | - | Control- 425 | [ |
| C and T- 183 | ||||||
| MDM2 (rs3730485) | Promoter | Direct PCR | 58°C | - | I- 287 | [ |
| D-247 |
| Total Samples | |||||||||||||
| DR (n= 414) | T2D (n=425) | CN (n= 402) | DR vs. CN | T2D vs. CN | DR vs. T2D | ||||||||
| OR (95% CI) | p-value | OR (95% CI) | p-value | OR (95% CI) | p-value | ||||||||
| VEGFA -2578 C/A (rs699947) | |||||||||||||
| Genotype | |||||||||||||
| CC | 125 (30.2) | 116 (27.3) | 124 (30.8) | Reference | Reference | Reference | |||||||
| CA | 199 (48.1) | 213 (50.1) | 184 (45.8) | 1.07 (0.78-1.48) | 0.666 | 1.24 (0.90-1.71) | 0.193 | 0.87 (0.63-1.19) | 0.379 | ||||
| AA | 90 (21.7) | 96 (22.6) | 94 (23.4) | 0.95 (0.65-1.39) | 0.791 | 1.09 (0.75-1.60) | 0.652 | 0.87 (0.59-1.28) | 0.476 | ||||
| Allele | |||||||||||||
| C | 449 (54.2) | 445 (52.4) | 432 (53.7) | Reference | Reference | Reference | |||||||
| A | 379 (45.8) | 405 (47.6) | 372 (46.3) | 0.98 (0.81-1.19) | 0.841 | 1.06 (0.87-1.28) | 0.575 | 0.93 (0.77-1.12) | 0.442 | ||||
| HWE | p=0.519 | p=0.925 | p=0.111 | ||||||||||
| VEGFA -2549 I/D (rs35569394) | |||||||||||||
| Genotype | |||||||||||||
| DD | 117 (28.3) | 109 (25.7) | 124 (30.8) | Reference | Reference | Reference | |||||||
| ID | 202 (48.8) | 216 (50.8) | 186 (46.3) | 1.15 (0.83-1.59) | 0.392 | 1.32 (0.96-1.83) | 0.092 | 0.87 (0.63-1.20) | 0.404 | ||||
| II | 95 (22.9) | 100 (23.5) | 92 (22.9) | 1.09 (0.75-1.60) | 0.644 | 1.24 (0.84-1.81) | 0.277 | 0.89 (0.60-1.30) | 0.532 | ||||
| Allele | |||||||||||||
| D | 436 (52.7) | 434 (51.1) | 434 (54) | Reference | Reference | Reference | |||||||
| I | 392 (47.3) | 416 (48.9) | 370 (46) | 1.05 (0.87-1.28) | 0.592 | 1.12 (0.93-1.36) | 0.235 | 0.94 (0.77-1.14) | 0.512 | ||||
| HWE | p=0.663 | p=0.727 | p=0.168 | ||||||||||
| VEGFA -7 C/T (rs25648) | |||||||||||||
| Genotype | |||||||||||||
| CC | 334 (80.7) | 224 (52.7) | 297 (73.9) | Reference | Reference | Reference | |||||||
| CT | 78 (18.8) | 189 (44.5) | 101 (25.1) | 0.69 (0.49-0.96) | 0.028 | 2.48 (1.84-3.34) | <0.001 | 0.28 (0.20-0.38) | <0.001 | ||||
| TT | 2 (0.5) | 12 (2.8) | 4 (1.0) | 0.44 (0.08-2.45) | 0.351 | 3.98 (1.27-12.5) | 0.018 | 0.11 (0.02-0.50) | 0.004 | ||||
| Allele | |||||||||||||
| C | 746 (90.1) | 637 (74.9) | 695 (86.4) | Reference | Reference | Reference | |||||||
| T | 82 (9.9) | 213 (25.1) | 109 (13.6) | 0.70 (0.52-0.95) | 0.022 | 2.13 (1.65-2.75) | <0.001 | 0.33 (0.25-0.43) | <0.001 | ||||
| HWE | p=0.256 | p=0.001 | p=0.149 | ||||||||||
| MDM2 (rs3730485) | |||||||||||||
| Genotype | |||||||||||||
| CC | 251 (60.6) | 241 (56.7) | 234 (58.2) | Reference | Reference | Reference | |||||||
| CT | 136 (32.9) | 161 (37.9) | 151 (37.6) | 0.84 (0.63-1.12) | 0.241 | 1.04 (0.78-1.38) | 0.812 | 0.81 (0.61-1.08) | 0.155 | ||||
| TT | 27 (6.5) | 23 (5.4) | 17 (4.2) | 1.48 (0.79-2.79) | 0.223 | 1.31 (0.68-2.52) | 0.412 | 1.13 (0.63-2.02) | 0.688 | ||||
| Allele | |||||||||||||
| C | 638 (77.1) | 643 (75.6) | 619 (77) | Reference | Reference | Reference | |||||||
| T | 190 (22.9) | 207 (24.4) | 185 (23) | 0.99 (0.79-1.26) | 0.976 | 1.08 (0.86-1.35) | 0.521 | 0.93 (0.74-1.16) | 0.498 | ||||
| HWE | p=0.148 | p=0.337 | p=0.228 | ||||||||||
| Female Group | |||||||||||||
| DR (n= 147) | T2D (n=190) | CN (n= 234) | DR vs. CN | T2D vs. CN | DR vs. T2D | ||||||||
| OR (95% CI) | p-value | OR (95% CI) | p-value | OR (95% CI) | p-value | ||||||||
| VEGFA -2578 C/A (rs699947) | |||||||||||||
| Genotype | |||||||||||||
| CC | 45 (30.6) | 56 (29.5) | 77 (32.9) | Reference | Reference | Reference | |||||||
| CA | 65 (44.2) | 89 (46.8) | 106 (45.3) | 1.05 (0.65-1.70) | 0.844 | 1.15 (0.74-1.80) | 0.527 | 0.91 (0.55-1.51) | 0.711 | ||||
| AA | 37 (25.2) | 45 (23.7) | 51 (21.8) | 1.24 (0.71-2.17) | 0.450 | 1.21 (0.72-2.06) | 0.473 | 1.02 (0.57-1.84) | 0.939 | ||||
| Allele | |||||||||||||
| C | 155 (52.7) | 201 (52.9) | 260 (55.6) | Reference | Reference | Reference | |||||||
| A | 139 (47.3) | 179 (47.1) | 208 (44.4) | 1.12 (0.84-1.50) | 0.445 | 1.11 (0.85-1.46) | 0.439 | 1.00 (0.74-1.37) | 0.964 | ||||
| HWE | p=0.171 | p=0.408 | p=0.206 | ||||||||||
| VEGFA -2549 I/D (rs35569394) | |||||||||||||
| Genotype | |||||||||||||
| DD | 39 (27.9) | 52 (27.4) | 78 (33.3) | Reference | Reference | Reference | |||||||
| ID | 67 (45.6) | 93 (48.9) | 110 (47) | 1.22 (0.75-1.99) | 0.430 | 1.27 (0.81-1.98) | 0.297 | 0.96 (0.57-1.62) | 0.880 | ||||
| II | 41 (27.9) | 45 (23.7) | 46 (19.7) | 1.78 (1.00-3.15) | 0.047 | 1.47 (0.85-2.52) | 0.164 | 1.21 (0.67-2.20) | 0.520 | ||||
| Allele | |||||||||||||
| D | 145 (49.3) | 197 (51.8) | 266 (56.8) | Reference | Reference | Reference | |||||||
| I | 149 (50.7) | 183 (48.2) | 202 (43.2) | 1.35 (1.00-1.81) | 0.043 | 1.22 (0.93-1.61) | 0.146 | 1.11 (0.82-1.50) | 0.516 | ||||
| HWE | p= 0.285 | p= 0.786 | p= 0.521 | ||||||||||
| VEGFA -7 C/T (rs25648) | |||||||||||||
| Genotype | |||||||||||||
| CC | 117 (79.6) | 99 (52.1) | 175 (74.7) | Reference | Reference | Reference | |||||||
| CT | 29 (19.7) | 85 (44.7) | 57 (24.4) | 0.76 (0.46-1.26) | 0.289 | 2.64 (1.74-4.00) | <0.001 | 0.29 (0.18-0.48) | <0.001 | ||||
| TT | 1 (0.7) | 6 (3.2) | 2 (0.9) | 0.75 (0.07-8.34) | 0.813 | 5.30 (1.05-26.78) | 0.043 | 0.14 (0.02-1.19) | 0.072 | ||||
| Allele | |||||||||||||
| C | 263 (89.5) | 283 (74.5) | 407 (87) | Reference | Reference | Reference | |||||||
| T | 31 (10.5) | 97 (25.5) | 61 (13) | 0.79 (0.50-1.24) | 0.305 | 2.29 (1.60-3.36) | <0.001 | 0.34 (0.22-0.53) | <0.001 | ||||
| HWE | p=0.579 | p=0.015 | p=0.255 | ||||||||||
| MDM2 (rs3730485) | |||||||||||||
| Genotype | |||||||||||||
| CC | 93 (63.2) | 105 (55.3) | 140 (59.8) | Reference | Reference | Reference | |||||||
| CT | 47 (32) | 72 (37.9) | 85 (36.3) | 0.83 (0.53-1.3) | 0.416 | 1.13 (0.75-1.69) | 0.554 | 0.74 (0.46-1.17) | 0.195 | ||||
| TT | 7 (4.8) | 13 (6.8) | 9 (3.9) | 1.17 (0.42-3.25) | 0.762 | 1.93 (0.79-4.67) | 0.147 | 0.61 (0.23-1.59) | 0.310 | ||||
| Allele | |||||||||||||
| C | 233 (79.3) | 282 (74.2) | 365 (78) | Reference | Reference | Reference | |||||||
| T | 61 (20.7) | 98 (25.8) | 103 (22) | 0.93 (0.63-1.33) | 0.680 | 1.23 (0.9-1.69) | 0.198 | 0.75 (0.52-1.08) | 0.127 | ||||
| HWE | p=0.736 | p=0.891 | p=0.374 | ||||||||||
| Male Group | |||||||||||||
| DR (n=267) | T2D (n= 235) | CN (n= 168) | DR vs. CN | T2D vs. CN | DR vs. T2D | ||||||||
| OR (95% CI) | p-value | OR (95% CI) | p-value | OR (95% CI) | p-value | ||||||||
| VEGFA -2578 C/A (rs699947) | |||||||||||||
| Genotype | |||||||||||||
| CC | 80 (30) | 60 (25.5) | 47(28) | Reference | Reference | Reference | |||||||
| CA | 134 (50.2) | 124 (52.8) | 78 (46.4) | 1.00 (0.64-1.59) | 0.968 | 1.25 (0.77-2.00) | 0.366 | 0.81 (0.54-1.23) | 0.320 | ||||
| AA | 53 (19.8) | 51 (21.7) | 43 (25.6) | 0.72 (0.42-1.24) | 0.241 | 0.93 (0.53-1.62) | 0.796 | 0.78 (0.47-1.30) | 0.338 | ||||
| Allele | |||||||||||||
| C | 294 (55.1) | 244 (51.9) | 172 (51.2) | Reference | Reference | Reference | |||||||
| A | 240 (44.9) | 226 (48.1) | 164 (48.8) | 0.86 (0.65-1.13) | 0.266 | 0.97 (0.73-1.29) | 0.839 | 0.88 (0.69-1.13) | 0.319 | ||||
| HWE | p=0.818 | p=0.383 | p=0.358 | ||||||||||
| VEGFA -2549 D/I (rs35569394) | |||||||||||||
| Genotype | |||||||||||||
| DD | 78 (29.9) | 57 (24.3) | 46 (27.4) | Reference | Reference | Reference | |||||||
| ID | 135 (50.6) | 123 (52.3) | 76 (45.2) | 1.05 (0.66-1.66) | 0.843 | 1.31 (0.81-2.12) | 0.278 | 0.80 (0.53-1.22) | 0.303 | ||||
| II | 54 (20.2) | 55 (23.4) | 46 (27.4) | 0.69 (0.41-1.18) | 0.179 | 0.96 (0.56-1.68) | 0.899 | 0.72 (0.43-1.19) | 0.200 | ||||
| Allele | |||||||||||||
| D | 291 (54.5) | 237 (50.4) | 168 (50) | Reference | Reference | Reference | |||||||
| I | 243 (45.5) | 233 (49.6) | 168 (50) | 0.84 (0.64-1.10) | 0.196 | 0.98 (0.74-1.30) | 0.905 | 0.85 (0.66-1.06) | 0.198 | ||||
| HWE | p=0.750 | p=0.472 | p=0.217 | ||||||||||
| VEGFA -7 C/T (rs25648) | |||||||||||||
| Genotype | |||||||||||||
| CC | 217 (81.2) | 125 (53.2) | 122 (72.6) | Reference | Reference | Reference | |||||||
| CT | 49 (18.4) | 104 (44.2) | 44 (26.2) | 0.63 (0.39-1.00) | 0.048 | 2.31 (1.50-3.55) | <0.001 | 0.27 (0.18-0.41) | <0.001 | ||||
| TT | 1 (0.4) | 6 (2.6) | 2 (1.2) | 0.28 (0.03-3.13) | 0.302 | 2.93 (0.58-14.79) | 0.194 | 0.10 (0.01-0.81) | 0.031 | ||||
| Allele | |||||||||||||
| C | 483 (90.4) | 354 (75.3) | 288 (85.7) | Reference | Reference | Reference | |||||||
| T | 51 (9.6) | 116 (24.7) | 48 (14.3) | 0.63 (0.42-0.96) | 0.033 | 2.0 (1.36-2.85) | <0.001 | 0.32 (0.23-0.46) | <0.001 | ||||
| HWE | p=0.309 | p=0.004 | p=0.368 | ||||||||||
| MDM2 (rs3730485) | |||||||||||||
| Genotype | |||||||||||||
| CC | 158 (59.2) | 136 (57.9) | 94 (56) | Reference | Reference | Reference | |||||||
| CT | 89 (33.3) | 89 (37.9) | 66 (39.3) | 0.80 (0.53-1.21) | 0.290 | 0.93 (0.62-1.41) | 0.738 | 0.86 (0.59-1.25) | 0.430 | ||||
| TT | 20 (7.5) | 10 (4.2) | 8 (4.7) | 1.49 (0.63-3.51) | 0.365 | 0.86 (0.33-2.27) | 0.767 | 1.72 (0.78-3.80) | 0.179 | ||||
| Allele | |||||||||||||
| C | 405 (75.8) | 361 (76.8) | 254 (75.6) | Reference | Reference | Reference | |||||||
| T | 129 (24.2) | 109 (23.2) | 82 (24.4) | 0.99 (0.72-1.36) | 0.934 | 0.94 (0.67-1.30) | 0.690 | 1.05 (0.79-1.41) | 0.720 | ||||
| HWE | p=0.140 | p=0.334 | p=0.402 | ||||||||||
| NPDR and PDR groups | |||||||||||||
| NPDR (n= 256) | PDR (n= 158) | T2D (n= 425) | NPDR vs. T2D | PDR vs. T2D | PDR vs. NPDR | ||||||||
| OR (95% CI) | p-value | OR (95% CI) | p-value | OR (95%CI) | p-value | ||||||||
| VEGFA -2578 C/A (rs699947) | |||||||||||||
| Genotype | |||||||||||||
| CC | 74 (28.9) | 51 (32.3) | 116 (27.3) | Reference | Reference | Reference | |||||||
| CA | 121 (47.3) | 78 (49.4) | 213 (50.1) | 0.89 (0.62-1.29) | 0.536 | 0.83 (0.55-1.27) | 0.393 | 0.94 (0.59-1.48) | 0.774 | ||||
| AA | 61 (23.8) | 29 (18.4) | 96 (22.6) | 1.00 (0.65-1.54) | 0.986 | 0.69 (0.40-1.17) | 0.165 | 0.69 (0.39-1.22) | 0.200 | ||||
| Allele | |||||||||||||
| C | 269 (52.5) | 180 (57.0) | 445 (52.4) | Reference | Reference | Reference | |||||||
| A | 243 (47.5) | 136 (43.0) | 405 (47.6) | 0.99 (0.80-1.24) | 0.947 | 0.83 (0.64-1.08) | 0.161 | 0.84 (0.63-1.11) | 0.215 | ||||
| HWE | p=0.403 | p=0.931 | p=0.925 | ||||||||||
| VEGFA -2549 D/I (rs35569394) | |||||||||||||
| Genotype | |||||||||||||
| DD | 66 (25.8) | 51 (32.3) | 109 (25.7) | Reference | Reference | Reference | |||||||
| ID | 126 (49.2) | 76 (48.1) | 186 (50.8) | 1.12 (0.76-1.64) | 0.563 | 0.87 (0.57-1.34) | 0.533 | 0.78 (0.49-1.24) | 0.295 | ||||
| II | 64 (25) | 31 (19.6) | 100 (23.5) | 1.06 (0.68-1.64) | 0.804 | 0.66 (0.39-1.12) | 0.123 | 0.63 (0.36-1.10) | 0.104 | ||||
| Allele | |||||||||||||
| D | 258 (50.4) | 178 (56.3) | 434 (51.1) | Reference | Reference | Reference | |||||||
| I | 254 (49.6) | 138 (43.7) | 416 (48.9) | 1.03 (0.82-1.28) | 0.811 | 0.81 (0.62-1.05) | 0.110 | 0.79 (0.59-1.04) | 0.097 | ||||
| HWE | p=0.803 | p=0.779 | p=0.727 | ||||||||||
| VEGFA -7 C/T (rs25648) | |||||||||||||
| Genotype | |||||||||||||
| CC | 205 (80.1) | 129 (81.6) | 224 (52.7) | Reference | Reference | Reference | |||||||
| CT | 50 (19.5) | 28 (17.7) | 189 (44.5) | 0.29 (0.20-0.42) | <0.001 | 0.26 (0.16-0.40) | <0.001 | 0.89 (0.53-1.49) | 0.656 | ||||
| TT | 1 (0.4) | 1 (0.6) | 12 (2.8) | 0.09 (0.01-0.71) | 0.022 | 0.14 (0.02-1.13) | 0.065 | 1.59 (0.10-25.6) | 0.744 | ||||
| Allele | |||||||||||||
| C | 460 (89.8) | 286 (90.5) | 637 (74.9) | Reference | Reference | Reference | |||||||
| T | 52 (10.2) | 30 (9.5) | 213 (25.1) | 0.34 (0.24-0.47) | <0.001 | 0.31 (0.21-0.47) | <0.001 | 0.93 (0.58-1.49) | 0.757 | ||||
| HWE | p=0.261 | p=0.695 | p=0.001 | ||||||||||
| MDM2 (rs3730485) | |||||||||||||
| Genotype | |||||||||||||
| CC | 153 (58.8) | 98 (62) | 241 (56.7) | Reference | Reference | Reference | |||||||
| CT | 86 (34.6) | 50 (31.6) | 161 (37.9) | 0.88 (0.63-1.22) | 0.447 | 0.76 (0.51-1.13) | 0.181 | 0.87 (0.56-1.33) | 0.515 | ||||
| TT | 17 (6.6) | 10 (6.4) | 23 (5.4) | 1.16 (0.60-2.25) | 0.651 | 1.06 (0.49-2.33) | 0.866 | 0.92 (0.40-2.09) | 0.839 | ||||
| Allele | |||||||||||||
| C | 396 (76.2) | 246 (77.8) | 643 (75.6) | Reference | Reference | Reference | |||||||
| T | 124 (23.8) | 70 (22.2) | 207 (24.4) | 0.97 (0.75-1.26) | 0.832 | 0.88 (0.65-1.20) | 0.433 | 0.91 (0.65-1.27) | 0.574 | ||||
| HWE | p=0.449 | p=0.299 | p=0.337 | ||||||||||
| Total Samples | |||||||
| DR vs. CN | T2D vs. CN | DR vs. T2D | |||||
| Variant | Models | OR (95% CI) | p | OR (95% CI) | p | OR (95% CI) | p |
| VEGFA -2578 C/A (rs699947) | Dominant Model | 1.03 | 0.840 | 1.19 | 0.261 | 0.87 | 0.354 |
| (CA + AA vs. CC) | (0.77-1.39) | (0.88-1.60) | (0.64-1.17) | ||||
| Heterozygous Model | 0.91 | 0.511 | 0.84 | 0.211 | 1.09 | 0.553 | |
| (CC + AA | (0.69-1.20) | (0.64-1.10) | (0.83-1.42) | ||||
| Recessive Model | 0.91 | 0.574 | 0.96 | 0.786 | 0.95 | 0.767 | |
| (AA vs. CC + CA) | (0.66-1.26) | (0.69-1.32) | (0.69-1.32) | ||||
| VEGFA -2549 I/D (rs35569394) | Dominant Model | 1.13 | 0.419 | 1.29 | 0.097 | 0.88 | 0.394 |
| (ID + II vs. DD) | (0.84-1.53) | (0.95-1.75) | (0.65-1.19) | ||||
| Heterozygous Model | 0.90 | 0.471 | 0.83 | 0.190 | 1.08 | 0.556 | |
| (DD + II vs.ID) | (0.69-1.19) | (0.63-1.09) | (0.83-1.42) | ||||
| Recessive Model | 1.00 | 0.983 | 1.04 | 0.827 | 0.97 | 0.842 | |
| (II vs. DD + ID) | (0.72-1.39) | (0.75-1.43) | (0.70-1.33) | ||||
| VEGFA -7 C/T (rs25648) | Dominant Model | 0.68 | 0.021 | 2.54 | <0.001 | 0.27 | <0.001 |
| (CT + TT vs. CC) | (0.49-0.94) | (1.89-3.40) | (0.20-0.36) | ||||
| Heterozygous Model | 1.45 | 0.031 | 0.42 | <0.001 | 3.45 | <0.001 | |
| (CC + TT vs. CT) | (1.04-2.02) | (0.31-0.56) | (2.53-4.71) | ||||
| Recessive Model | 0.48 | 0.402 | 2.89 | 0.068 | 0.17 | 0.020 | |
| (TT vs. CC + CT) | (0.09-2.65) | (0.92-9.04) | (0.04-0.75) | ||||
| MDM2 (rs3730485) | Dominant Model | 0.91 | 0.482 | 1.06 | 0.662 | 0.85 | 0.249 |
| (ID + DD vs. II) | (0.68-1.20) | (0.81-1.40) | (0.65-1.12) | ||||
| Heterozygous Model | 1.23 | 0.159 | 0.99 | 0.924 | 1.25 | 0.128 | |
| (II + DD vs. ID) | (0.92-1.64) | (0.74-1.31) | (0.94-1.66) | ||||
| Recessive Model | 1.58 | 0.150 | 1.30 | 0.429 | 1.25 | 0.448 | |
| (DD vs. II + ID) | (0.85-2.95) | (0.68-2.46) | (0.70-2.22) | ||||
| Female Group | |||||||
| DR vs. CN | T2D vs. CN | DR vs. T2D | |||||
| Variant | Models | OR (95% CI) | p | OR (95% CI) | p | OR (95% CI) | p |
| VEGFA -2578 C/A (rs699947) | Dominant Model | 1.11 | 0.641 | 1.17 | 0.449 | 0.95 | 0.821 |
| (CA + AA vs. CC) | (0.71-1.73) | (0.78-1.78) | (0.59-1.51) | ||||
| Heterozygous Model | 1.04 | 0.836 | 0.94 | 0.751 | 1.11 | 0.632 | |
| (CC + AA | (0.69-158) | (0.64-1.38) | (0.72-1.71) | ||||
| Recessive Model | 1.21 | 0.447 | 1.11 | 0.644 | 1.08 | 0.753 | |
| (AA vs. CC + CA) | (0.74-1.96) | (0.71-1.76) | (0.66-1.79) | ||||
| VEGFA -2549 I/D (rs35569394) | Dominant Model | 1.38 | 0.162 | 1.33 | 0.186 | 1.04 | 0.864 |
| (ID + II vs. DD) | (0.88-2.18) | (0.87-2.02) | (0.64-1.70) | ||||
| Heterozygous Model | 1.06 | 0.785 | 0.93 | 0.691 | 1.14 | 0.539 | |
| (DD + II vs.ID) | (0.70-1.60) | (0.63-1.36) | (0.74-1.76) | ||||
| Recessive Model | 1.58 | 0.064 | 1.27 | 0.316 | 1.25 | 0.380 | |
| (II vs. DD + ID) | (0.97-2.56) | (0.80-2.02) | (0.76-2.04) | ||||
| VEGFA -7 C/T (rs25648) | Dominant Model | 0.76 | 0.281 | 2.73 | <0.001 | 0.28 | <0.001 |
| (CT + TT vs. CC) | (0.46-1.25) | (1.81-4.11) | (0.17-0.46) | ||||
| Heterozygous Model | 1.31 | 0.293 | 0.40 | <0.001 | 3.29 | <0.001 | |
| (CC + TT vs. CT) | (0.79-2.17) | (0.26-0.60) | (2.0-5.41) | ||||
| Recessive Model | 0.79 | 0.852 | 3.78 | 0.106 | 0.21 | 0.151 | |
| (TT vs. CC + CT) | (0.07-8.84) | (0.75-18.96) | (0.03-1.76) | ||||
| MDM2 (rs3730485) | Dominant Model | 0.86 | 0.503 | 1.21 | 0.344 | 0.72 | 0.139 |
| (ID + DD vs. II) | (0.57-1.32) | (0.82-1.78) | (0.46-1.11) | ||||
| Heterozygous Model | 1.21 | 0.385 | 0.93 | 0.739 | 1.30 | 0.260 | |
| (II + DD vs. ID) | (0.78-1.88) | (0.63-1.39) | (0.82-2.04) | ||||
| Recessive Model | 1.25 | 0.665 | 1.84 | 0.172 | 0.68 | 0.425 | |
| (DD vs. II + ID) | (0.46-3.43) | (0.77-4.39) | (0.26-1.75) | ||||
| Male Group | |||||||
| DR vs. CN | T2D vs. CN | DR vs. T2D | |||||
| Variant | Models | OR (95% CI) | p | OR (95% CI) | p | OR (95% CI) | p |
| VEGFA -2578 C/A (rs699947) | Dominant Model | 0.91 | 0.657 | 1.13 | 0.584 | 0.80 | 0.270 |
| (CA + AA vs. CC) | (0.59-1.39) | (0.72-1.77) | (0.54-1.19) | ||||
| Heterozygous Model | 0.86 | 0.445 | 0.78 | 0.210 | 1.11 | 0.564 | |
| (CC + AA | (0.58-1.27) | (0.52-1.15) | (0.78-1.57) | ||||
| Recessive Model | 0.72 | 0.160 | 0.81 | 0.363 | 0.89 | 0.610 | |
| (AA vs. CC + CA) | (0.46-1.14) | (0.51-1.15) | (58-1.38) | ||||
| VEGFA -2549 I/D (rs35569394) | Dominant Model | 1.66 | 0.029 | 1.38 | 0.167 | 1.21 | 0.389 |
| (ID + II vs. DD) | (1.06-2.63) | (0.87-2.18) | (0.79-1.84) | ||||
| Heterozygous Model | 0.81 | 0.280 | 0.75 | 0.160 | 1.07 | 0.691 | |
| (DD + II vs.ID) | (0.55-1.19) | (0.51-1.12) | (0.76-1.53) | ||||
| Recessive Model | 1.09 | 0.680 | 0.85 | 0.478 | 1.29 | 0.212 | |
| (II vs. DD + ID) | (0.71-1.68) | (0.54-1.33) | (0.87-1.92) | ||||
| VEGFA -7 C/T (rs25648) | Dominant Model | 0.61 | 0.035 | 2.33 | <0.001 | 0.26 | <0.001 |
| (CT + TT vs. CC) | (0.39-0.97) | (1.53-3.57) | (0.18-0.39) | ||||
| Heterozygous Model | 1.93 | 0.005 | 0.45 | <0.001 | 4.31 | <0.001 | |
| (CC + TT vs. CT) | (1.22-3.05) | (0.29-0.69) | (2.89-6.42) | ||||
| Recessive Model | 0.38 | 0.432 | 2.17 | 0.345 | 0.18 | 0.108 | |
| (TT vs. CC + CT) | (0.03-4.23) | (0.43-10.91) | (0.02-1.47) | ||||
| MDM2 (rs3730485) | Dominant Model | 0.88 | 0.507 | 0.92 | 0.701 | 0.95 | 0.767 |
| (ID + DD vs. II) | (0.59-1.29) | (0.62-1.38) | (0.66-1.35) | ||||
| Heterozygous Model | 1.29 | 0.207 | 1.06 | 0.774 | 1.22 | 0.289 | |
| (II + DD vs. ID) | (0.87-1.93) | (0.71-1.59) | (0.85-1.76) | ||||
| Recessive Model | 1.62 | 0.263 | 0.89 | 0.808 | 1.82 | 0.132 | |
| (DD vs. II + ID) | (0.70-3.77) | (0.34-2.30) | (0.83-3.98) | ||||
| Haplotype* | DR | T2D | CN | DR vs. CN | T2D vs. CN | DR vs. T2D | |||
| (%) | (%) | (%) | OR (95% CI) | p-value | OR (95% CI) | p-value | OR (95% CI) | p-value | |
| C-D-C | 46.0 | 43.6 | 48.4 | Reference | Reference | Reference | |||
| A-I-C | 35.6 | 28.8 | 35.5 | 1.05 (0.84-1.31) | 0.660 | 0.94 (0.74-1.18) | 0.580 | 1.15 (0.90-1.46) | 0.280 |
| A-I-T | 6.0 | 17.3 | 9.1 | 0.69 (0.45-1.05) | 0.082 | 2.29 (1.62-3.24) | <0.001 | 0.30 (0.20-0.44) | <0.001 |
| C-D-T | 2.4 | 5.9 | 4.0 | 0.63 (0.30-1.32) | 0.220 | 1.96 (1.05-3.66) | 0.036 | 0.33 (0.16-0.65) | 0.002 |
| C-I-C | 5.5 | 1.6 | 1.2 | 3.57 (1.77-7.19) | <0.001 | 1.03 (0.41-2.54) | 0.960 | 2.95 (1.48-5.91) | 0.002 |
| A-D-C | 3.0 | 1.0 | 1.4 | 1.97 (0.92-4.22) | 0.080 | 0.71 (0.29-1.78) | 0.470 | 3.54 (1.33-9.39) | 0.012 |
| Genotype* Combination | |||||||||
| (n) | (n) | (n) | |||||||
| CC-DD-CC | 88 | 76 | 101 | Reference | Reference | Reference | |||
| CC-DD-CT | 12 | 27 | 17 | 0.81 (0.37-1.79) | 0.603 | 2.11 (1.07-4.15) | 0.030 | 0.38 (0.18-0.81) | 0.012 |
| CC-ID-CC | 17 | 4 | 2 | 9.76 (2.19-43.4) | 0.003 | 2.66 (0.47-14.9) | 0.266 | 3.67 (1.18-11.4) | 0.024 |
| CA-ID-CC | 146 | 101 | 124 | 1.35 (0.93-1.96) | 0.113 | 1.08 (0.73-1.61) | 0.696 | 1.25 (0.84-1.86) | 0.275 |
| CA-ID-CT | 27 | 98 | 51 | 0.61 (0.35-1.05) | 0.074 | 2.55 (1.63-4.0) | <0.001 | 0.24 (0.14-0.4) | <0.001 |
| CA-II-CC | 11 | 2 | 2 | 6.31 (1.36-29.3) | 0.019 | 1.33 (0.18-9.65) | 0.779 | 4.75 (1.02-22.1) | 0.047 |
| AA-II-CC | 50 | 36 | 58 | 0.99 (0.62-1.59) | 0.965 | 0.82 (0.49-1.38) | 0.461 | 1.2 (0.71-2.03) | 0.499 |
| AA-II-CT | 23 | 45 | 27 | 0.98 (0.52-1.83) | 0.944 | 2.21 (1.26-3.89) | 0.006 | 0.44 (0.25-0.80) | 0.007 |
| Variant | Country | Subjects | Results | Reference | ||
| DR | T2D | CN | ||||
| rs699947 | Iraq | 103 | 31 | 36 | No association | [ |
| Central India | 105 | 51 | - | No association | [ | |
| Indonesia | 33 | 35 | - | Association of C allele with increased risk of DR | [ | |
| Egypt | 46 | 41 | 41 | No association | [ | |
| Egypt | 74 | 74 | - | No association | [ | |
| Spain | 14 | 26 | - | Association of CA genotype with increased risk for DR | [ | |
| China | 129 | 139 | - | Association of AA genotype with increased risk of DR | [ | |
| Korea | 253 | 134 | 260 | Association of A allele with increased risk of DR | [ | |
| Japan | 177 | 292 | - | Association of A allele and AA genotype with increased risk of PDR | [ | |
| Finland | 131 | 98 | 526 | No association | [ | |
| Australia | 290 | 235 | - | Association of AA genotype with increased risk of DR | [ | |
| Japan | 175 | 203 | - | No association | [ | |
| rs35569394 | Central India | 105 | 51 | - | No association | [ |
| Poland | 38 | 62 | - | Association of D allele with increased risk for DR | [ | |
| Spain | 14 | 26 | - | Association of DD genotype with decreased risk and ID genotype with increased risk of DR | [ | |
| Poland | 195 | 92 | 493 | Association of D allele with increased risk of DR | [ | |
| rs25648 | South India | 120 | 90 | - | Association of T allele and CT genotype with increased risk of DR | [ |
| Japan | 150 | 118 | - | No association | [ | |
Peer Reviews
No public reviews on file for this paper yet. If you reviewed it on a platform where reviews are public (OpenReview, ICLR, NeurIPS, ICML), you can paste yours below so the community can read it here.
Videos
No videos yet. Explain this paper in a talk, walkthrough, or lecture? Add one.
Taxonomy
TopicsRetinal Diseases and Treatments · Phagocytosis and Immune Regulation · Retinoids in leukemia and cellular processes
Introduction
Diabetes mellitus (DM) is a group of metabolic disorders characterized by high blood glucose levels and an increased risk of developing a number of serious health problems, resulting in higher medical care costs, reduced quality of life, and increased mortality [1]. Diabetic retinopathy (DR) is one of the major microvascular complications associated with chronic hyperglycemia and the leading cause of preventable blindness worldwide [2]. Type 2 diabetes (T2D) represents more than 90% of the whole diabetic population in the world [3] and is responsible for 9% of global mortality corresponding to four million deaths per year. According to the International Diabetes Federation (IDF), there are nearly 65.1 million diabetic individuals in India, and the number is further expected to reach 109 million by the year 2035 [4]. Despite the documented increase in the prevalence of diabetes across the globe, still there is a scarcity of data on the prevalence and severity of DR [5]. There are very limited epidemiological studies emphasizing the prevalence of DR in rural and urban populations in India [6,7]. The overall prevalence of DR was reported to be around 38.3% in T2D cases in India [8]. Diabetes-induced blindness in working adults in India is expected to increase from 4.2 million in 2020 to over six million by 2030 [9]. DR begins with microvascular complications in the photoreceptor cells of the retina and is characterized by increased vascular permeability, progressive vascular occlusion, and neovascularization (NV), which results in the degeneration of retinal cells/tissues that finally affects vision [10]. NV is the process of forming new vasculature by vasculogenesis and angiogenesis [11]. The initial factors and determinants of ocular NV are hypoxia and oxidative stress in the outer retina [12]. Hyperglycemia induces hypoxia in the retina of diabetic individuals. Hypoxia stimulates the expression of factors such as vascular endothelial growth factor (VEGF) and mouse model minute 2 (MDM2) [13].
VEGF is a multifunctional cytokine that promotes angiogenesis and vascular permeability [14,15]. Under physiological conditions, VEGF is expressed at low levels in the eye [16]. Under pathological circumstances, the expression of VEGF is upregulated, and its overexpression promotes vessel endothelial cell proliferation, migration, tube formation, and sprouting, serving as a contributing factor for DR [17]. VEGF is also considered a primary initiator of proliferative DR (PDR) and a potential mediator of non-PDR (NPDR) [18]. Hence, the VEGF gene and its polymorphic variants may play crucial roles in DR, characterized by impaired vascular permeability and neovascularization [19]. However, the association between *VEGF *gene polymorphisms and the susceptibility to DR, PDR, and NPDR has not been completely established [15-19]. Human *VEGFA *(Gene ID: 7422) is located on 6p21.1, spans over 16 kb, and consists of nine exons (https://www.ncbi.nlm.nih.gov/gene/7422). It is reported to be highly polymorphic in the promoter region, 5′ untranslated region (UTR), and 3′ UTR [20]. There are reports on the association of these genetic variations with altered serum and urine VEGF levels [20,21]. VEGFA -2578 C/A (rs699947), VEGFA -2549 I/D (rs35569394), and VEGFA -7 C/T (rs25648) polymorphisms have been implicated in a number of diseases with angiogenic basis; hence, they are polymorphisms of particular interest [22,23].
The MDM2 gene encodes the MDM2 homolog protein, which is a primary negative regulator of p53 [24]. The tumor suppressor protein p53 controls many important cellular events, including apoptosis and cell proliferation [25]. It has been reported that p53 is active in the absence of MDM2, triggering apoptosis or profound inhibition of cell proliferation [26]. Meanwhile, elevated MDM2expression causes persistent cell growth with significant DNA damage, which supports tumorigenesis due to loss of p53 control [27]. Under hypoxic conditions, MDM2 is overexpressed and activates hypoxia-inducible factor 1 (HIF1) in a p53-independent pathway, and HIF1 upregulates VEGF [28-30]. In addition, MDM2 directly interacts with and stabilizes VEGF mRNA and increases its translation, which is one of the main vasoactive gene products causing NV [31]. A previous study reported that, in the diabetic state, the deletion of MDM2 causes activation of endothelial p53, which reduces vasodilatation and angiogenesis, reducing the risk of PDR [32]. *MDM2 *rs3730485 is an insertion/deletion polymorphism of 40 bps in the promoter P1, and the deletion allele has been shown to reduce transcription [33-35].
The interplay between MDM2, p53, HIF1, and VEGF might be one of the key factors for the development of DR. The present study is designed to detect any association of VEGFA -2578C/A (rs699947), VEGFA -2549I/D (rs35569394), VEGFA -7C/T (rs25648), and MDM2 rs3730485 promoter polymorphisms with the DR in a population from Punjab, Northwest India. These four polymorphisms are present in the promoter region, and other polymorphisms present in that area are mostly in linkage disequilibrium with the selected four. Thus, evaluating these four could also shine a light on the ones not included in the study. To the best of our knowledge, there has been no previous reported study worldwide on the association of MDM2 rs3730485 polymorphism with the DR. This is the first study worldwide to investigate the association of VEGFA rs699947, rs35569394, and rs25648 polymorphisms together with DR.
Materials and methods
Study subjects
In the present study, a total of 414 unrelated DR patients, 425 unrelated T2D patients without DR, and 402 unrelated age-matched healthy controls (CN) from Punjab, Northwest India, were included. The sample size was estimated using the power of study analysis, explained in the statistical analysis below. T2D was defined according to the American Diabetes Association diagnostic criteria [36]. Type 1 diabetic patients and T2D patients with other metabolic complications were excluded from the study. DR cases were diagnosed by ophthalmologists at Dr. Sohan Singh Eye Hospital, Amritsar, Punjab, India, based on a comprehensive ophthalmological examination, including fundus examination and fundus photography based on three 45° field tests per eye every year. Retinopathy was diagnosed according to the Early Treatment Diabetic Retinopathy Study (ETDRS) criteria: the presence of microaneurysms, hemorrhages, cotton wool spots, intra-retinal microvascular abnormalities, hard exudates, venous beading, and new vessels [37]. The DR patients were further categorized into 256 non-proliferative diabetic retinopathy (NPDR) patients and 158 proliferative diabetic retinopathy (PDR) patients. Controls were randomly selected on the basis of fasting blood sugar (FBS) and random blood sugar (RBS) levels with no previous history of diabetes and were ethnicity-matched with patients. Individuals with a family history of diabetes in first-degree relatives or any other systemic complications were not included in the control group. A written informed consent was obtained from all the study subjects. A 5-mL intravenous peripheral blood sample from each subject was collected in ethylenediaminetetraacetic acid (EDTA)-coated vials. The study was approved by the Institutional Ethics Committee of Guru Nanak Dev University, Amritsar, Punjab, India (Letter No. 573/HG, Dated- 29/03/2018).
Genetic analysis
Genomic DNA was extracted from blood using the salt precipitation method with some modifications [38]. The purity and quantity of DNA samples were checked on ethidium bromide-stained 1% agarose gel. Genotyping of *VEGFA *-2578 C/A polymorphism was performed by the PCR-RFLP method, whereas VEGFA -7 C/T polymorphism was genotyped using the amplification refractory mutation system (ARMS)-polymerase chain reaction (PCR). *VEGFA *-2549 I/D and MDM2 rs3730485 I/D polymorphisms were genotyped using direct PCR. The details of primers, reaction conditions, and other details of polymorphisms are given in Table 1. The PCR results were checked using agarose gel electrophoresis. To ensure genotyping accuracy, positive and negative controls were used in every batch of reactions. The PCR results were validated by Sanger sequencing of 10% randomly selected samples (Figures 1, 2).
Part of electropherograms (forward strand) showing CC, CA, and AA genotypes of VEGFA rs699947 (a) polymorphism. Part of electropherograms (forward strand) showing C- and T-specific primer sequencing results of VEGFA rs25648 (b) polymorphism
Part of electropherograms (forward strand) showing II, ID, and DD genotypes of VEGFA rs35569394 (a) and MDM2 rs3730485 (b) polymorphisms
Statistical analysis
Data were analyzed using the Statistical Product and Service Solutions (SPSS, version 16.0; SPSS Inc., Chicago, IL). Power analysis was done using the online CaTS-GAS power calculator (https://csg.sph.umich.edu/abecasis/cats/gas_power_calculator/) with the following parameters: additive disease model, population risk of 13% for T2D, and minor allele frequency (MAF) of 46.3% for VEGFA -2578 C/A, 46.1% for VEGFA -2549 I/D, 14.3% for VEGFA -7 C/T, and 23% for MDM2 rs3730485 at p=0.05. The continuous variables were represented as means ± standard deviations (SD). The Hardy-Weinberg equilibrium (HWE), allele frequencies, genotype frequencies, and genotype-genotype combinations were analyzed using the c2 test and odds ratio (OR) with 95% CI. The Haplotype analysis was done using the online SNPStats web tool (https://www.snpstats.net/start.htm) [43]. Lewontin’s standardized disequilibrium coefficient (D′) and correlation coefficient (r2) were calculated using SHEsis software [44]. The p-value for the level of significance was set to be less than 0.05 in all analyses.
Results
Genotype and allele analysis
Genotype frequencies of all polymorphisms studied in the present study were in agreement with HWE (p > 0.05) in healthy controls. The allele distribution, genotype distribution, and genetic model analyses in DR, T2D, and controls have been given in Tables 2, 3.
Table 2: Distribution of genotype and allele frequencies of VEGFA and MDM2 polymorphisms in total subjects, female, male, NPDR, and PDR groupsThe data have been represented as n (number), %, OR: odds ratio, and p-value. p-value < 0.05 was considered significant. Significant p-values are displayed in bold.CN: Healthy Controls, DR: Diabetic Retinopathy, HWE: Hardy-Weinberg Equilibrium, MDM2: Mouse Model Minute 2, NPDR: Non-Proliferative Diabetic Retinopathy, PDR: Proliferative Diabetic Retinopathy, T2D: Type 2 Diabetes, VEGFA: Vascular Endothelial Growth Factor
Table 3: Analyses of VEGFA and MDM2 polymorphisms using different genetic models in total samples, female group, and male groupThe data have been represented as OR: odds ratio and p-value. p-value < 0.05 was considered significant. Significant p-values are displayed in bold.CN: Healthy Controls, DR: Diabetic Retinopathy, HWE: Hardy-Weinberg Equilibrium, MDM2: Mouse Model Minute 2, T2D: Type 2 Diabetes, VEGFA: Vascular Endothelial Growth Factor
For *VEGFA *-2578 C/A (rs699947) polymorphism, MAF was slightly lower in DR patients as compared to both T2D patients and CN in total samples and in the male group (Table 2). In the female group, MAF was slightly higher in DR patients compared to T2D patients and healthy controls (Table 2). No significant difference was observed with genotypes, alleles, and genetic models in any of the groups studied (Tables 2, 3).
MAF of *VEGFA *-2549 I/D (rs35569394) polymorphism was higher to some degree in DR cases than in T2D cases and CN in the female group (Table 2). In the female group, I allele and II genotype were significantly associated with an increased risk of DR compared to healthy controls (Table 2). Genetic model analysis revealed a significant increased risk of DR under the dominant model in the male group (Table 3). *VEGFA *-2549 I/D polymorphism was not associated with DR risk in total subjects (Table 2).
For *VEGFA *-7 C/T (rs25648) polymorphism, MAF was lower in DR cases compared to both T2D cases and CN in all groups (Table 2). The CT genotype was associated with a reduced risk of DR as compared to T2D cases and CN in total subjects, as well as in male and female groups (Table 2). Genetic model analysis showed a reduced risk of DR under the dominant model, whereas an increased risk of DR was observed under a heterozygous genetic model in all groups (Table 3). In total subjects, the recessive model showed protection towards DR cases vs T2D cases (Table 3). For rs25648 polymorphism, CT genotype and T allele were associated with reduced risk of PDR and NPDR as compared to T2D cases (Table 2).
MAF of *MDM2 *rs3730485 polymorphism was moderately lower in DR cases as compared to T2D cases and healthy controls in total subjects and in the female group (Table 2). In the male group, MAF was slightly higher in DR subjects compared to T2D subjects and healthy controls (Table 2). No significant difference was observed with genotypes, alleles, and genetic models in any of the groups studied (Tables 2, 3).
Linkage disequilibrium and haplotype analysis
Linkage disequilibrium (LD) analysis showed a strong LD between rs699947 and rs35569394 (D′ = 0.89, r2 = 0.78) (Figure 3). Haplotype analysis of rs69997-rs35569394-rs25648 polymorphisms showed that haplotype C-I-C and A-D-C were significantly associated with increased risk of DR as compared to T2D cases and CN, whereas haplotype A-I-T and C-D-T was significantly associated with reduced risk of DR as compared to T2D cases. Haplotypes A-I-T and C-D-T showed 2.29-fold and 1.96-fold risk for T2D as compared to CN (Table 4).
Table 4: Haplotype and genotype combinations data of VEGFA polymorphisms with DR riskSignificant p-values are displayed in bold. p-value < 0.05 was considered significant. * VEGFA -2578C/A (rs699947) - VEGFA -2549I/D (rs35569394) - VEGFA -7C/T (rs25648). DR: Diabetic Retinopathy, T2D: Type 2 Diabetes, CN: Healthy Controls
Genotype-genotype interaction
The genotype combination data are given in Table 4. Genotype combinations of CC-DD-CT, CA-ID-CT, and AA-II-CT showed a significantly decreased risk of DR as compared to T2D cases. The power of the study was more than 80% for all the studied polymorphisms.
Discussion
In this study, VEGFA (rs699947, rs35569394, and rs25648) and MDM2 (rs3730485) polymorphisms were screened to determine the risk of DR in a group of T2D patients from Punjab, Northwest India. DR is a leading cause of visual loss in working-age populations [45,46]. For patients who survive for over 20 years with T2D, the majority suffer from DR [47,48]. The main progressors of DR are inflammation, angiogenesis, and apoptosis, leading to retinal cell death and eyesight loss [49,50]. VEGFA serves as the primary regulator in both normal and abnormal vascular development [51]. It has the potential to enhance retinal vascular permeability, destroy the blood-retinal barrier, and generate new blood vessels in DR, all of which are directly linked to the emergence and progression of DR [52]. The polymorphisms in promoter and 5ʹUTR lead to elevated transcriptional activity of the VEGFA gene, resulting in the increased production of VEGF as reflected in the serum VEGF levels of the individuals [53], as well as in vitro studies [54]. VEGF inhibition has been reported to cause nearly complete scaling down in retinal neovascularization, revealing the critical roles of VEGF in DR pathogenesis and management [55]. The p53 protein promotes apoptosis, and the VEGF protein promotes angiogenesis. The MDM2 gene product is the down-regulator of p53 and has been reported as the upregulator of VEGF; both of these functions of MDM2 increase the risk of DR [24]. There have been very few studies to test the association of rs699947, rs35569394, and rs25648 polymorphisms with DR risk worldwide, and no study was from Northwest India. There has been no previously reported study on the association of rs3730485 polymorphism with DR susceptibility worldwide. Most of the previous studies did not include healthy controls or diabetic controls (T2D individuals without DR) in their genetic analysis, which keeps us from more precise results. In the present study, the subject groups consisted of CN, T2D controls (without retinopathy), and individuals with DR (PDR and NPDR), for understanding the genetics of VEGFA -2578 C/A (rs699947), VEGFA -2549 I/D (rs35569394), *VEGFA *-7 C/T (rs25648), and MDM2 (rs3730485) gene promoter region polymorphisms with the risk of DR in a population from Punjab, Northwest India. Details of the previous studies on DR with *VEGFA *rs699947, rs35569394, and rs25648 polymorphisms and their outcomes are given in Table 5.
VEGFA rs699947 polymorphism was significantly associated with DR in Korean [60], Japanese [61], Chinese [59], and Australian [63] populations, whereas no association with DR was observed in Iraq [51] and Egyptian [57,58] populations. A study from central India reported no association of rs699947 DR cases vs T2D cases [13]. A meta-analysis of nine studies showed that A allele and CA genotype were significantly associated with PDR risk in the overall Asian populations [68]. In the present study, there was no significant association of rs699947 with DR risk. Similarly, no association of rs699947 with DR has been reported in studies from Finland [62] and Japan [64].
The association of D-allele in rs35569394 with increased VEGF protein expression has been documented in the literature [69]. D allele was associated with an increased risk of DR in the Polish population [40,65]. The present study showed no significant difference in overall samples, but in the female group, II genotype and I allele showed a significantly increased risk of DR in comparison to CN. No association of rs35569394 with DR risk has been reported in a single previous study from central India [13].
There are very few studies on rs25648 in DR worldwide. In the present study on Northwest Indians, CT-genotype and T-allele showed significant protection to DR as compared to T2D cases and healthy controls. The model analysis showed significant protection in the dominant model and significant risk in the heterozygous model for DR cases vs. T2D cases. A study from Japan reported no significant association of rs25648 with DR [67]. CT-genotype and T-allele conferred significant risk towards DR in the South Indian population [66].
MDM2 rs3730485 polymorphism is present in the promoter P1 region of MDM2 and has been reported to control the expression of the gene [70]. A previous study has revealed a potential association between MDM2 T309G and PDR. However, at present, there is a lack of direct evidence that supports the role of MDM2 in DR [24]. No previous reported study has analyzed the association of MDM2 rs3730485 polymorphism with DR. In the present study, there was no significant association of genetic variation with DR or T2D risk in the studied groups.
In the present study, a strong LD was observed between rs699947 and rs35569394. Similarly, complete LD between the C-allele of rs699947 and the D-allele of rs35569394 have been reported in Central Indian DR patients [13]. Haplotypes C-I-C and A-D-C conferred a risk of more than twofold in DR as compared to T2D cases, and haplotype C-I-C showed a significant risk of 3.57-fold towards DR as compared to CN in the present study (Table 4). Haplotypes A-I-T and C-D-T revealed significant protection to DR as compared to T2D. The C-D haplotype of rs699947 and rs35569394 polymorphisms was associated with enhanced VEGF expression [60]. Genotype-genotype combinations CC-ID-CC and CA-II-CC showed a significant risk of 3.67-fold and 4.75-fold in DR cases vs. T2D cases. The combinations of CC-DD-CT, CA-ID-CT, and AA-II-CT revealed significant protection in DR cases vs. T2D cases. The findings of the present study in Northwest Indians and previously reported studies in different populations [57,71] have different results, suggesting that ethnicity influences the association of VEGFA polymorphisms with DR.
Strengths and limitations of the study
Strengths: This is the first study to evaluate the association of four selected polymorphisms with DR in the studied population. DR has been studied in the context of its two types (PDR and NPDR), males and females, and their relation with the polymorphic variants. Additionally, this study includes the T2D patients as diabetic controls, which makes the results clearer.
Limitations: The present study was limited by not having expression analysis data of the *VEGFA *and *MDM2 *genes in the studied population. The selected genes were studied with only one and three polymorphisms, so more polymorphisms should be analyzed for better knowledge of the genetics of DR. Further, functional studies could be done. The study population could also be subdivided into ethnic groups for a better understanding of the genetics of DR. Additionally, the current study was carried out only on the population from the Punjab region, which could differ from the whole of Northwest India.
Conclusions
In conclusion, the results of our study revealed that *VEGFA *-7 C/T (rs25648) polymorphism was significantly associated with a decreased risk of DR and that VEGFA -2549 I/D (rs35569394) polymorphism was significantly associated with an increased risk of DR in the female group. In the present study, haplotypes C-I-C and A-D-C were associated with more than twofold increased risk of DR. The present study was limited in not having corresponding evidence such as the level of gene and protein expression. This is the first study to investigate the association of MDM2 rs3730485 polymorphism with DR and the first in recent years to study the association of VEGFA -7 C/T (rs25648) with DR. Analysis of MDM2 rs3730485 and VEGFA -2578 C/A (rs699947) polymorphisms reported no significant association with the risk of DR in the studied population. The current study has furthered our knowledge about understanding the genetics of VEGFA and MDM2 genes with DR in the Northwest Indian population, rooting for further future research on the topic.
The reference list from the paper itself. Each links out to its DOI / PubMed record.
- 1Risk of cause-specific death in individuals with diabetes: a competing risks analysis Diabetes Care Baena-Díez JM Peñafiel J Subirana I 198719953920162749313410.2337/dc 16-0614 · doi ↗ · pubmed ↗
- 2Some insights on the genomics of diabetic, retinopathy Human Genomics and Applications Sikka R Babu IR Singh G Kaur I Chhablani JK Bhanwer AJS Chakrabarti S Delhi, India Narendra Publishing House 2017 https://www.researchgate.net/profile/Ruhi-Sikka/publication/265682997_Sikka_R_Babu_I_R_Kaur_I_Rani_P_K_Bhanwer_AJS_and_Chakrabarti_S_Some_insights_on_the_genomics_of_diabetic_retinopathy/links/592c 5361458515 e 3d 47387 a 0/Sikka-R-Babu-I-R-Kaur-I-Rani-P-K-Bhanwer-AJS-and-Chakrabarti-S-Some-insights-on-the-genomics
- 3[Epidemiological features of type 2 diabetes]Rev Prat Simon D 469473602010 https://pubmed.ncbi.nlm.nih.gov/20465117/20465117 · pubmed ↗
- 4IDF Diabetes Atlas: global estimates of diabetes prevalence for 2017 and projections for 2045 Diabetes Res Clin Pract Cho NH Shaw JE Karuranga S Huang Y da Rocha Fernandes JD Ohlrogge AW Malanda B 27128113820182949650710.1016/j.diabres.2018.02.023 · doi ↗ · pubmed ↗
- 5Prevalence of diabetic retinopathy in the United States, 2005-2008 JAMA Zhang X Saaddine JB Chou CF 64965630420102069945610.1001/jama.2010.1111 PMC 2945293 · doi ↗ · pubmed ↗
- 6Prevalence of retinopathy in non insulin dependent diabetes mellitus at a diabetes centre in southern India Diabetes Res Clin Pract Rema M Ponnaiya M Mohan V 2936341996896868810.1016/s 0168-8227(96)01327-7 · doi ↗ · pubmed ↗
- 7Prevalence of retinopathy at diagnosis among type 2 diabetic patients attending a diabetic centre in South India Br J Ophthalmol Rema M Deepa R Mohan V 105810608420001096696710.1136/bjo.84.9.1058 PMC 1723618 · doi ↗ · pubmed ↗
- 8Improving management practices and clinical outcomes in type 2 diabetes study: prevalence of complications in people with type 2 diabetes in India Indian J Endocrinol Metab Das AK Seshiah V Sahay BK 0116201210.4103/2230-8210.104119 PMC 360310223565454 · doi ↗ · pubmed ↗