Microorganisms in the rumen and intestine of camels have the ability to degrade 2‐amino‐3‐methylimidazo[4, 5‐f]quinoline
Jialing Lin, Chuanhui Zeng, Xueli Li, Qin Tang, Jing Liao, Yan Jiang, Xianchun Zeng

TL;DR
Camels' gut microbes can break down a harmful food toxin called IQ, which could help in developing ways to reduce cancer-causing compounds in food.
Contribution
This is the first study to isolate IQ-degrading bacteria from camels' digestive systems and characterize their degradation abilities.
Findings
Proteobacteria was the most abundant phylum in camel rumen and intestinal microbes after three generations of IQ cultivation.
Four bacterial strains showed high IQ degradation rates, with Ochrobactrum and Pseudomonas being the most effective genera.
The study identified 50 bacterial strains from camel digestive systems, providing potential resources for biodegrading food toxins.
Abstract
Heterocyclic amines (HAs) are a group of mutagenic and carcinogenic compounds produced from the processing of high‐protein foods, which include 2‐amino‐3‐methylimidazo[4, 5‐f]quinoline (IQ) showing the strongest carcinogenic effect. Camels are able to digest HAs in foods, which provide rich microbial resources for the study. Thus, camel rumen and intestinal microbiota were used to degrade IQ, and the dominant microorganisms and their degradation characteristics were investigated. After three generations of culture with IQ as the sole carbon source, the highest abundance in rumen and intestinal microbes was found in the Proteobacteria phylum. The strains of third generation of the rumen contents were mainly attributed to the genera Brevundimonas and Pseudomonas, and the dominant genera in intestine were Ochrobactrum, Bacillus, and Pseudomonas. Microorganisms were further isolated and…
Genes, proteins, chemicals, diseases, species, mutations and cell lines named across the full text — each resolved to its canonical identifier and authoritative record.
Click any figure to enlarge with its caption.
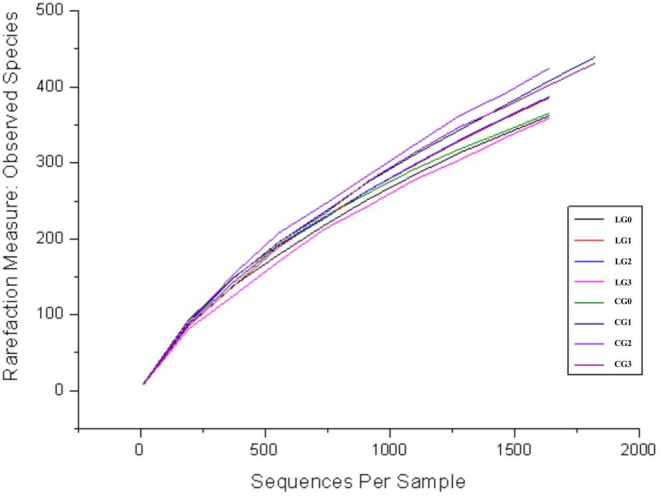 FIGURE 1
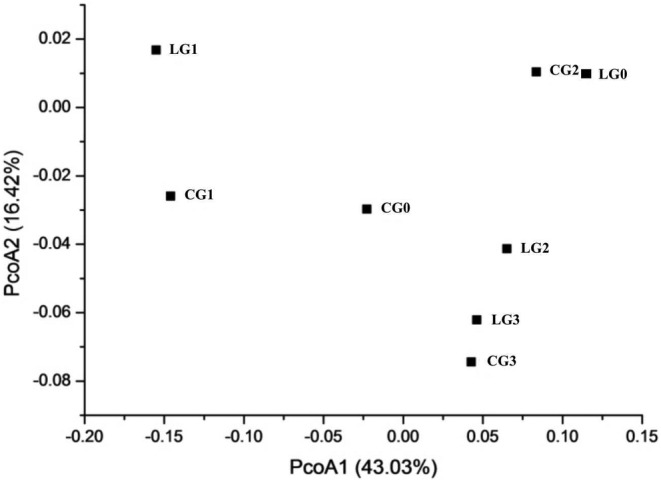 FIGURE 2
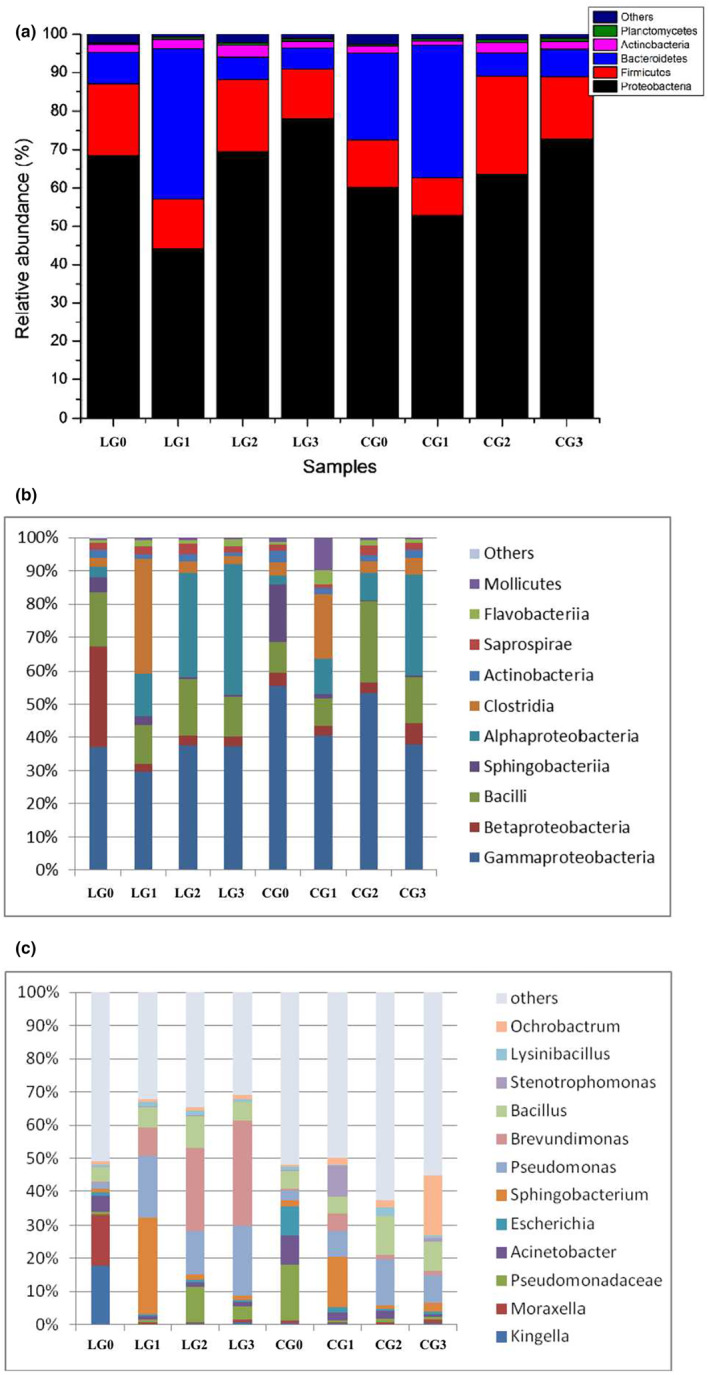 FIGURE 3
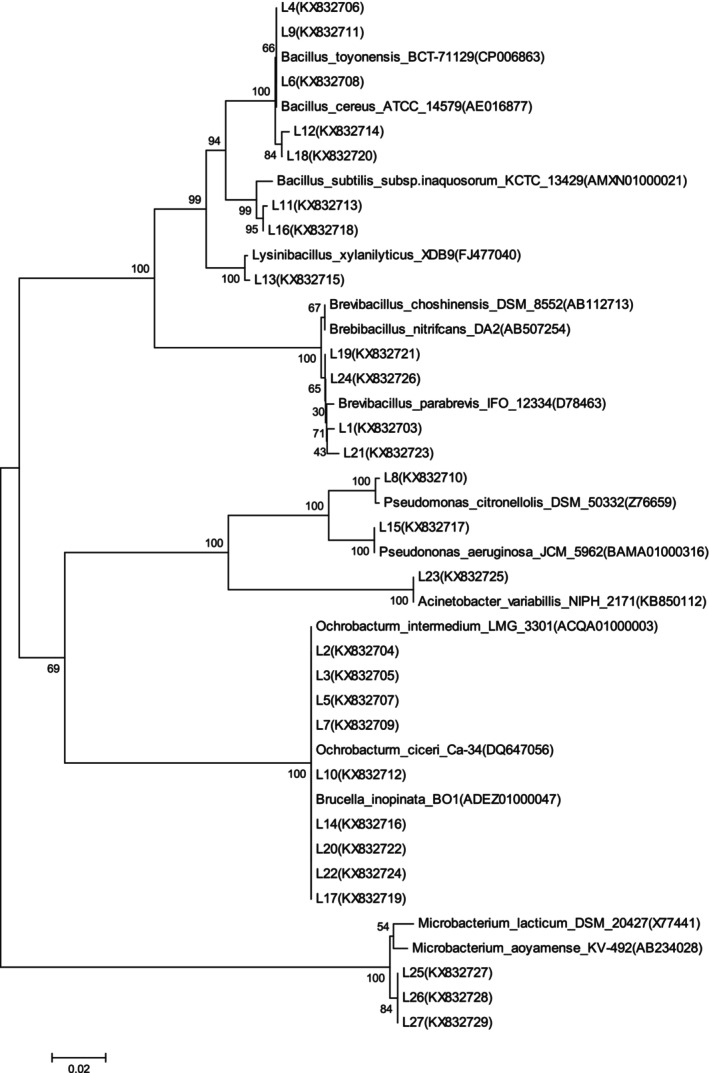 FIGURE 4
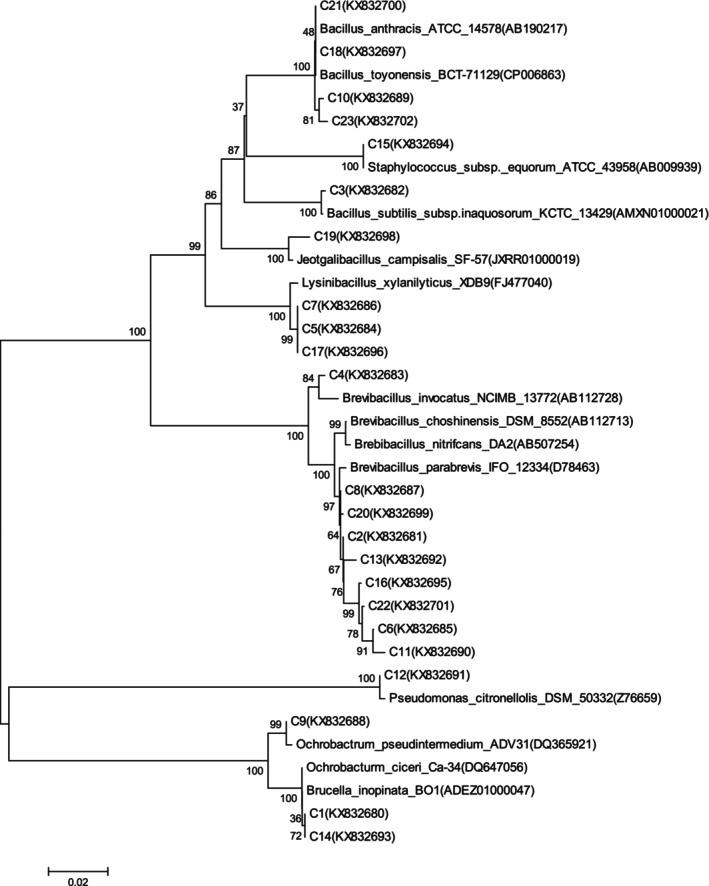 FIGURE 5
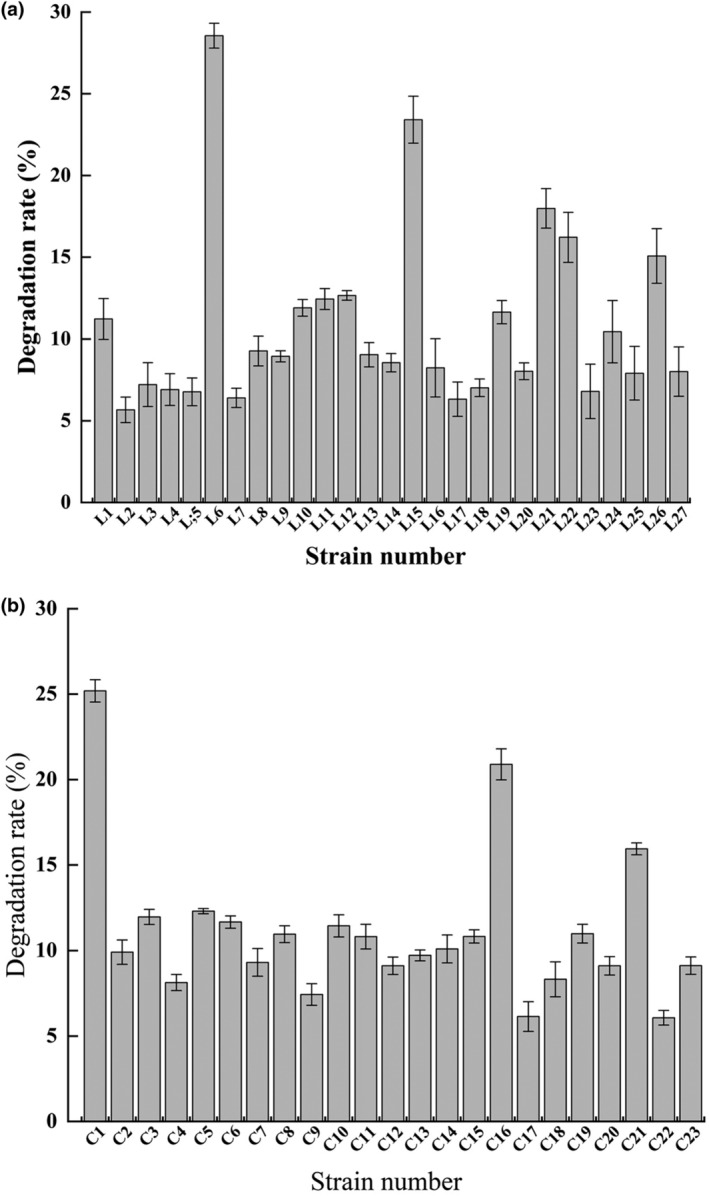 FIGURE 6
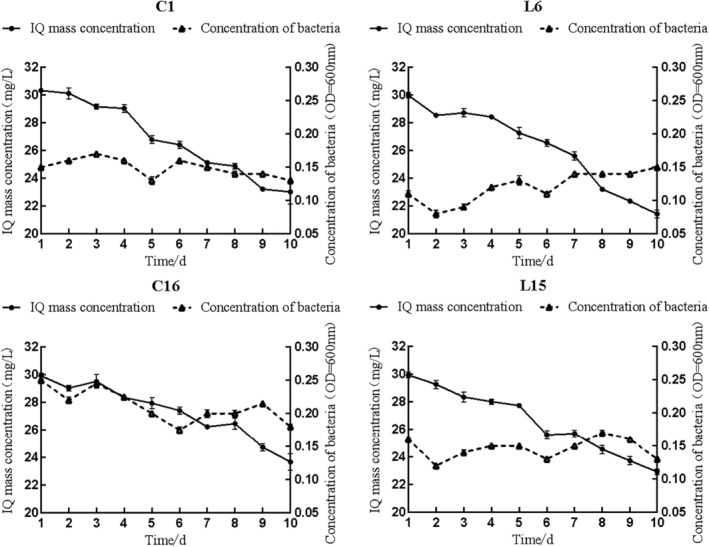 FIGURE 7
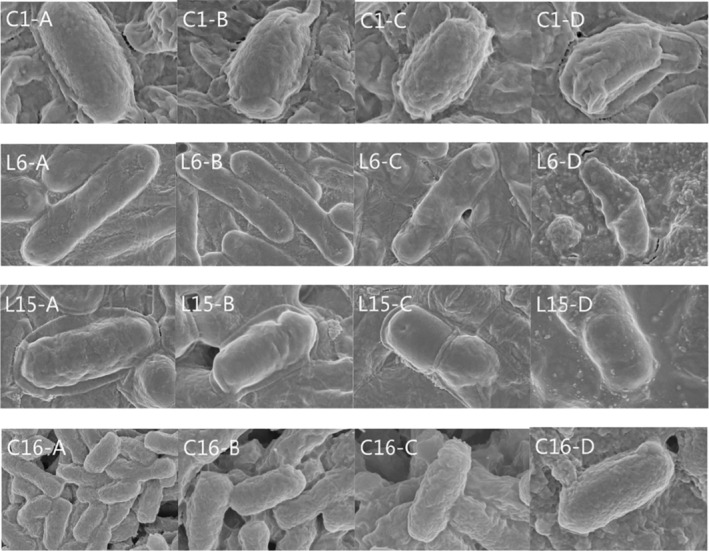 FIGURE 8
| Sample | Sequence | Bases (bp) | Sample | Sequence | Bases (bp) |
|---|---|---|---|---|---|
| LG0 | 19,647 | 8,055,270 | CG0 | 14,816 | 6,074,560 |
| LG1 | 15,455 | 6,336,550 | CG1 | 21,592 | 8,852,720 |
| LG2 | 25,773 | 10,566,930 | CG2 | 24,282 | 9,955,620 |
| LG3 | 24,356 | 9,985,960 | CG3 | 21,208 | 8,695,280 |
| Sample | Chao1 | Observed | Shannon | Simpson | Goods coverage (%) |
|---|---|---|---|---|---|
| OTU | Index | Index | |||
| LG0 | 869.86 | 405.6 | 6.47 | 0.956 | 87.2 |
| LG1 | 863.77 | 386.2 | 6.45 | 0.958 | 85.2 |
| LG2 | 915.12 | 387.7 | 6.29 | 0.949 | 84.8 |
| LG3 | 915.22 | 359.3 | 6.00 | 0.940 | 85.7 |
| CG0 | 928.95 | 398.5 | 6.98 | 0.976 | 86.0 |
| CG1 | 1185.05 | 408.5 | 6.59 | 0.965 | 83.9 |
| CG2 | 1181.83 | 425.2 | 6.51 | 0.938 | 82.6 |
| CG3 | 1014.56 | 402.9 | 6.68 | 0.966 | 84.7 |
| Strains | Accession number | Strains in GenBank database (accession no.) | Similarity (%) |
|---|---|---|---|
| L1 |
|
| 99 |
| L2 |
|
| 99 |
| L3 |
|
| 99 |
| L4 |
|
| 100 |
| L5 |
|
| 99 |
| L6 |
|
| 99 |
| L7 |
|
| 99 |
| L8 |
|
| 99 |
| L9 |
|
| 99 |
| L10 |
|
| 100 |
| L11 |
|
| 99 |
| L12 |
|
| 99 |
| L13 |
|
| 99 |
| L14 |
|
| 99 |
| L15 |
|
| 99 |
| L16 |
|
| 99 |
| L17 |
|
| 99 |
| L18 |
|
| 99 |
| L19 |
|
| 99 |
| L20 |
|
| 99 |
| L21 |
|
| 99 |
| L22 |
|
| 99 |
| L23 |
|
| 99 |
| L24 |
|
| 99 |
| L25 |
|
| 99 |
| L26 |
|
| 99 |
| L27 |
|
| 99 |
| Strains | Accession number | Strains in GenBank database (accession no.) | Similarity (%) |
|---|---|---|---|
| C1 |
|
| 99 |
| C2 |
|
| 99 |
| C3 |
|
| 99 |
| C4 |
|
| 99 |
| C5 |
|
| 99 |
| C6 |
|
| 99 |
| C7 |
|
| 99 |
| C8 |
|
| 99 |
| C9 |
|
| 99 |
| C10 |
|
| 99 |
| C11 |
|
| 99 |
| C12 |
|
| 99 |
| C13 |
|
| 99 |
| C14 |
|
| 99 |
| C15 |
|
| 99 |
| C16 |
|
| 99 |
| C17 |
|
| 99 |
| C18 |
|
| 99 |
| C19 |
|
| 99 |
| C20 |
|
| 99 |
| C21 |
|
| 100 |
| C22 |
|
| 99 |
| C23 |
|
| 99 |
- —Solid‐state Fermentation Resource Utilization Key Laboratory of Sichuan Province
- —Development and Research Center of Sichuan Cuisine
- —Sichuan Province Science and Technology Support Program 10.13039/100012542
- —Meat Processing Key Laboratory of Sichuan Province
- —National Natural Science Foundation of China 10.13039/501100001809
Peer Reviews
No public reviews on file for this paper yet. If you reviewed it on a platform where reviews are public (OpenReview, ICLR, NeurIPS, ICML), you can paste yours below so the community can read it here.
Videos
No videos yet. Explain this paper in a talk, walkthrough, or lecture? Add one.
Taxonomy
TopicsAnimal Diversity and Health Studies · Probiotics and Fermented Foods · Escherichia coli research studies
INTRODUCTION
1
Heterocyclic amines (HAs) with a polycyclic aromatic structure can cause pancreatic, gastric, and liver cancers (Tanaka et al., 1985). However, more than 30 kinds of HAs have been detected in a variety of fried foods and cured or marinated meat products (Fei et al., 2007). Among these heterocyclic compounds, 2‐amino‐3‐methylimidazo[4,5‐f]quinoline (IQ) is the strongest carcinogenic and has been classified by the International Agency for Research on Cancer as a highly suspicious carcinogen for humans (Class 2A) (Lai et al., 2022). Bylsma found that excessive intake of IQ increases the risk of breast, colon, and stomach cancer in humans (Bylsma & Alexander, 2015). Therefore, the prevention and removal of HAs is of great importance to food safety and human health.
In recent years, it has been found that animal intestinal flora had a certain degradation effect on toxic and harmful substances (Shao et al., 2022; Zeng et al., 2022). HAs could be biodegraded by gut microbiota, but the mechanism needs to be further investigated (Shao et al., 2022).
Ruminant digestive tract microorganisms have evolved into a complex microbial ecosystem, which can degrade phycotoxins, cyanobacterial toxins, and mycotoxins (Loh et al., 2020). Camels are characteristic ruminant animals in Xinjiang, China, often kept in a semiwild state and have biological characteristics such as tolerance to roughage, drought, heat, cold, and salinity. Early studies found that camels have the ability to tolerate or degrade phytotoxins such as mimosine and Euphorbia esula toxins (Goel et al., 2005; Kronberg et al., 2006). Toxic plants are often found in the desert where camels live, including Tamarix chinensis, Alhagi sparsifolia, Peganum harmala, and Stellera chamaejasme (An et al., 2010). These plants contain phytotoxins, such as seeds of Peganum harmala, which are rich in harmine and can elevate body temperature and cause neurological disorders. The safe consumption of these toxic plants by camels is closely related to the microorganisms in their digestive tracts (Gharechahi et al., 2015). Camel rumen microbes have been shown to tolerate and degrade harmine (An et al., 2010), which has a structure similar to HAs, so it is speculated that the microbes in their digestive tract may have the ability to degrade HAs.
Therefore, camel rumen and intestinal contents which contain a variety of microorganisms were investigated to degrade IQ. The microbial diversity including Chao1 index, Shannon index, Goods coverage, and relative abundance was studied. Dominate microbes in the two contents were screened and their degradation capacity was also determined. Results provided microbial resources for biodegradation of foodborne toxins.
MATERIALS AND METHODS
2
Sample collection
2.1
The experimental camels from the Tianying slaughterhouse in Xinjiang were all healthy before sacrifice. They were fed with grass in the wild. And fodder was provided for camels in the winter when grass was hard to grow. Thus, these animals lived in a semiwild state. Feces from three male camels were collected as intestine samples. Meanwhile, rumen fluids from these camels were kept as rumen contents. Samples were conserved in sterile and anaerobic bags (Shanghai Laichuang Biotechnology Co., LTD) before back to the laboratory and stored at −80°C in the laboratory.
Culture media and reagents
2.2
Inorganic salt medium: 2.65 g of KH_2_PO_4_, 4.26 g of Na_2_HPO_4_, 0.01 g of FeSO_4_·7H_2_O, 0.2 g of MgSO_4_·7H_2_O, 0.002 g of MnSO_4_·7H_2_O, 0.02 g of CaCl_2_, 1 g of NH_4_NO_3_, 1000‐mL distilled water, pH 7.0, sterilized at 121°C for 20 min.
LB liquid medium: 5‐g yeast leaching powder, 10‐g sodium chloride, 10‐g peptone, 1000‐mL distilled water, pH 7.0, sterilized at 121°C for 20 min.
Solid isolation medium (g/L): Inorganic salt medium with 15–20 g of agar powder.
IQ standards (Aladdin, chromatographically pure), SuPrep gel DNA extraction kit, OMEGA soil DNA extraction kit, upstream primer 27F (5′‐AGAGTTTGATCATGGCTCAG‐3′), and downstream primer 1492R (5′‐TACGGTTACCTTGTTACGACTT‐3′) were purchased from Shanghai Biotechnology Co., LTD.
Microbial community structure of the camel's digestive tract in response to IQ
2.3
Five milliliters of the rumen liquid or 5 mg of intestinal contents from camels was inoculated in 100‐mL inorganic salt medium with 30 mg/L IQ as the sole carbon source in anaerobic bags at 37°C for 10 days, which was regarded as the first generation. Five milliliters of the mixture was then moved into fresh medium with the same culture conditions for another 10 days, which was regarded as the second generation. Then, 5 mL of the mixture was incubated in fresh medium for the third 10 days, as the third generation. Thus, camel rumen contents were cultured with IQ stressed for 0, 10, 20, and 30 days, respectively, named as LG0, LG1, LG2, and LG3. Intestinal contents for 0, 10, 20, and 30 days were named as CG0, CG1, CG2, and CG3, respectively. Replacing samples by equal milliliters of sterile inorganic salt medium in the same culture conditions was set as blank groups.
Total DNA was extracted from every generation (three replicates) using the OMEGA Soil DNA Extraction Kit. DNA mass and concentration were determined using a nanoDrop 2000 assay (A260/280 and A260/230) and stored at −20°C for backup.
PCR amplification was performed using the bacterial universal primers 16S rRNA V4 high variant region 515F (5′‐GTGCCAGCMGCCGCGGTAA‐3′) and 909R (5′‐CCCCGYCAATTCMTTTRAGT‐3′) as primers (Li et al., 2014). The reaction system was 25 mL of total volume with 1.5 mmol/L MgCl_2_, 0.4 mol/L deoxynucleoside triphosphate, 1.0 μmol/L primers, 0.5 U Ex Taq, and 10 ng of total genomic DNA. Reaction procedure: 94°C for 3 min predenaturation; 94°C for 40 s; 56°C for 60 s; 72°C for 60 s; 30 cycles, 72°C extension for 10 min. Meanwhile, sterile deionized water was used in control groups.
QIIME Pipeline‐Version 1.7.0 software was used for processing, and preprocessing to remove low‐quality raw sequencing data before removing chimeric sequences using UChime (Edgar et al., 2011). The operational taxonomic unit (OTU) was based on 97% sequence similarity for each sample for Goods coverage, Chao1, and Shannon diversity indices. The QIIME platform was also used to analyze the differences in microbial community structure among these three generations of samples using principal coordinate analysis (PCoA). The relative abundance of IQ‐degrading bacteria in the camel's digestive tract at the phylum, class, and genus levels were mapped.
Isolation, purification, and identification of IQ‐degrading bacteria
2.4
The third generation of camel rumen or intestinal contents was incubated with IQ of 30 mg/L in solid isolation medium at 37°C for 10 days inside anaerobic bags. Then, single colonies as degrading bacteria in the mixture were isolated and purified.
The DNA of these degrading bacteria was extracted using OMEGA soil DNA extraction kit and amplified using 16S rRNA gene sequences with 27F (5′‐AGAGTTTGATCCTGGCTCAG‐3′) and 1492R (5′‐GGTTACCTTGTTACGACTT3′) as primers. The obtained PCR products were sent to Shanghai Biotech Company for sequencing. The neighbor‐joining method was applied to the MEGA6 software to analyze the sequence alignment system, phylogenetic trees were constructed and homologies between strains were calculated.
IQ degradation rate
2.5
The degraded strain was incubated in LB medium at 37°C for 24 h and the supernatant was collected by centrifugation. The organisms were washed three times with inorganic salt medium to produce a suspension with 2.0 optical density at 600 nm. Five milliliters of the suspension was inoculated into 95‐mL inorganic salt medium containing 30 mg/L of IQ as the only carbon source at 37°C in anaerobic bags. The suspension was replaced by equal volume of sterile inorganic salt medium as blank control. Samples were taken at 24‐h intervals and incubated for 10 days. Dichloromethane (chromatographically pure) was applied to samples, and the IQ was extracted by centrifugation after ultrasonic shaking for 20 min.
IQ contents were measured by high‐performance liquid chromatography with Agilent Eclipse XDB‐C18 column (250 mm × 4.6 mm × 5 μm). Mobile phase as methanol (chromatographic purity), 1.0 mL/min of flow rate, column temperature was set at 25°C, detection wavelength as 260 nm, quantification ring injection volume as 20.00 μL. The standard equation for IQ was y = 192.97x + 4.0772, R ^2^ = .9994, with the range of 0~40 mg/L IQ.
The IQ concentration of blank control was recorded as A, and the residual concentration of IQ after incubating with bacteria from camel's digestive tract was B; thus, the IQ degradation rate was calculated as (A–B)*100%/A.
Degradation characteristics of IQ‐degrading bacteria
2.6
The efficient degradation strain was inoculated with IQ concentration of 30 mg/L in inorganic salt medium at 37°C for 10 days. The blank control was IQ in inorganic salt medium without the addition of bacteria. Samples were taken every 24 h. The bacterial concentration of the culture medium was measured at 600 nm using an ultraviolet spectrophotometer, and the growth curve of the strain was plotted. Meanwhile, the residual amount of IQ in the culture solution was determined by high‐performance liquid chromatography, and the degradation curve was plotted. Two milliliters of the bacterial solution was taken and collected, and then 4% formaldehyde was added for fixation. A small amount of the bacterial solution was picked and placed on a copper grid, dried, and observed by scanning electron microscopy.
Statistical analysis
2.7
Statistical analysis was performed with the software Origin 2021Pro (OriginLab, Northampton, MA). All experiments were conducted in triplicate. Data were expressed as average values.
RESULTS
3
Evaluation of sequencing quality
3.1
Basic information on the original and three‐generation samples of camel rumen or intestine is shown in Table 1. A total of 154,129 sequences were obtained by high‐throughput sequencing of the eight experimental samples, with basic sequence numbers above 10,576 and sequence lengths of about 410 bp.
All samples were plotted at 97% similarity level with rarefaction curves as shown in Figure 1. As seen in Figure 1, each sample showed a similar trend of variation. OTUs of all samples were increased. The increasing trend of OTUs of every sample gradually became slower as the number of tests increased, and basically saturated in the final. The sampling depth as shown in Figure 1 and the amount of sequencing data in Table 1 suggested that the sequencing quality of the bacterial flora from the digestive tract of camels with IQ stress was reasonable.
Rarefaction curve of rumen and intestinal samples from camels.
Analysis of microbial diversity in the digestive tract of camels
3.2
The alpha diversity of LG0–LG3 and CG0–CG3 is shown in Table 2: Goods coverage ranged between 82.6% and 87.2%, indicating that most information on the bacterial species in these samples was captured. Chao1 index and observed OTU represented species richness, which showed higher values in CG0‐CG3 than LG0‐LG3. Thus, species of microorganisms in the intestinal tract were richer than in the rumen of camels. Shannon's and Simpson's indices presented species diversity and evenness. And high values of the index meant high diversity and abundance of IQ‐degrading bacteria in the intestine as well as rumen of camels.
Beta diversity of samples was calculated by Weighted UniFrac PCoA analysis to reflect the differences in bacterial communities of these samples (Figure 2). Those clustered together indicated little difference, and those far apart indicated a comparatively large difference. The results showed that there were relative differences in community structure among the original samples of camel rumen (LG0) and intestine (CG0) with the samples cultured under IQ stress (LG1, LG2, LG3, CG1, CG2, and CG3). The IQ‐degrading microbe flora in the rumen of camels differed between every generation (LG1, LG2, and LG3). The microbial taxa that degraded IQ in the camel intestine also showed large differences in all generations (CG1, CG2, and CG3). Interestingly, bacterial communities from the third generation of rumen and intestine contents might be similar, as the two samples (LG3 and CG3) clustered. Clustered LG3 and CG3 likely resulted from incubating three generations with IQ as the only carbon source. Therefore, the bacterial composition in the digestive tract of camels was further investigated.
Principal coordinate analysis of rumen and intestinal samples from camels.
Community composition of IQ‐degrading bacteria in the digestive tract of camels
3.3
The obtained sequences were compared with the SILVA database and the results showed that the most similar sequences were classified into 24 phyla, 61 classes, and 316 genera. As shown in Figure 3a, Proteobacteria, Actinobacteria, Bacteroidetes, Planctomycetes, and Firmicutes constituted the major phyla. Especially, the Proteobacteria dominated in the original microbial flora of the rumen (LG0) and intestine (CG0) samples. In the first‐generation samples (LG1 and CG1), the relative abundance of the Bacteroidetes increased, while by the second (LG2, CG2) and third (LG3, CG3) generation samples, the Proteobacteria re‐emerged as the dominant group.
Relative abundance at the (a) phylum, (b) class, and (c) genus levels of dominant taxa of IQ‐degrading microorganisms in the digestive tract of camels.
The dominant bacteria in the original samples from the rumen (LG0) and intestine (CG0) of camels belonged to Gammaproteobacteria (Figure 3b). With IQ stress, the abundance of Sphingobacteriia in the samples of the first generation (LG1 and CG1) of rumen and intestine increased. The abundance of both Gammaproteobacteria and Alphaproteobacteria in the samples of the second (LG2) and third generation (LG3) of rumen increased and became the dominant group. The abundance of Gammaproteobacteria and Flavobacteriia in the second generation (CG2) of the intestinal tract increased and they became the dominant bacteria. Gammaproteobacteria and Alphaproteobacteria re‐emerged as the dominant flora in the third generation (CG3) of intestinal samples.
At the genus level (Figure 3c), the dominant genera in the original samples (LG0) of the rumen consisted of Kingella and Moraxella. Sphingobacterium and Pseudomonas were the dominant genera in their first‐generation samples (LG1). In rumen second‐ (LG2) and third‐generation (LG3) samples, Brevundimonas and Pseudomonas were dominant. The dominant genera in the original intestinal samples were Pseudomonadaceae and Escherichia. Under the stress of IQ, the dominant genera in the first‐generation samples (CG1) of the intestine changed, and Sphingobacterium and Stenotrophomonas became the dominant genera. In the second‐generation samples (CG2), the dominant genera were Pseudomonas and Bacillus, but by the third generation (CG3), the dominant genera were Ochrobactrum, Pseudomonas, and Bacillus.
Identification and phylogenetic analysis of IQ‐degrading bacteria
3.4
The third generation of camel ruminal (LG3) and intestinal (CG3) contents was incubated with IQ as the only carbon source in solid isolation medium. Then, single colonies as degrading bacteria in the mixture were isolated and purified: Twenty‐seven strains from the rumen of camels, were numbered from L1 to L27, and 23 strains were from the intestine of camels, numbered as C1–C23. And these degrading bacteria were analyzed in GenBank (Tables 3 and 4), and the phylogenetic tree was constructed (Figures 4 and 5). The dominant genera were Ochrobactrum, Bacillus, and Pseudomonas of 27 strains from camel rumen (Table 3 and Figure 4). As for 23 strains from camel intestine (Table 4 and Figure 5), Brevibacillus and Bacillus were the dominant genera.
Phylogenetic tree of 27 IQ‐degrading strains in the rumen of camels.
Phylogenetic tree of 23 IQ‐degrading strains in the intestine of camels.
Degrading capacity of bacteria in IQ
3.5
The microorganisms from the IQ‐stressed third‐generation cultures were screened to select degrading strains, and 50 strains were isolated and purified. Degrading ability of these 50 strains after 10 days of IQ‐stressed incubation is shown in Figure 6. The degrading capacity of IQ by strains from camel rumen was up to 28.55% and down to 5.38%, while the degrading capacities of strains from camel intestine varied from 5.98% to 25.19%. Two efficient degrading strains were screened from the rumen as L6 and L15, which were identified as Ochrobactrum and Pseudomonas, and two efficient degrading strains were screened from the intestine: C1 (Ochrobactrum) and C16 (Bacillus).
Degradation rate of IQ by (a) 27 strains of bacteria in the rumen and (b) 23 strains of bacteria in the intestinal samples of camels.
During IQ‐stressed incubation, the growth curves and degradation curves of the four degrading strains are shown in Figure 7. Within 1–2 days, the strains were in a sluggish phase with a slow growth and a slight decrease in IQ concentration in order to adapt to the growth environment. And then, the rapid growth of the strains reached a stable phase with a high rate of utilization of IQ. From day 8 to day 10, the concentration of the four strains gradually decreased, and the concentration of IQ also decreased to the lowest. The degradation rates of C1, L6, C16, and L15 on IQ were 25.19%, 28.55%, 20.89%, and 23.41%, respectively.
Growth and degradation curves of four highly effective degrading strains with IQ (30 mg/L) stressed.
Morphological changes of the bacterium during degradation
3.6
Four degrading strains were screened by electron microscopy and the results are shown in Figure 8. After 3 days of stress incubation with IQ (30 mg/L), the C1, C16, L6, and L15 bacteria began to morphologically change. By day 6, there were obvious folds on the surface of the four strains. After 10 days of IQ‐stressed incubation, the cell surface folds of four strains deepened and became depressed, and C1 (Ochrobactrum), L6 (Ochrobactrum) and L15 (Pseudomonas) strains were severely deformed morphologically.
Morphological characteristics of four highly effective degrading strains with IQ (30 mg/L) stressed. A, B, C, and D represent samples of strains cultured on days 0, 3, 6, and 10, respectively.
DISCUSSION
4
The current macrogenomic sequencing analysis of microorganisms in the camel's digestive tract revealed that Bacteroidetes, Firmicutes, and Proteobacteria were the dominant phyla in the rumen, with Bacteroidetes accounting for more than a half (Bhatt et al., 2013; Gharechahi et al., 2015). He et al. (2018) found that the dominant phyla in the rumen of camels were Firmicutes and Bacteroidetes, while the relative abundance of Firmicutes and Verrucomicrobia in the intestine was higher. Different growing environments and physiological conditions can lead to differences in the microbial composition of the rumen and intestine of camels. The first dominant bacteria in the rumen and intestine of camels were the Proteobacteria, the second dominant bacteria in the rumen were the Firmicutes, and the second dominant bacteria in the intestine were the Bacteroidetes.
Through three generations of IQ stress culture, rumen and intestinal microorganisms adapted to the growth environment where IQ was the only source of carbon, resulting in a gradual dominance of IQ‐dependent flora, thus changing the original microbial composition of the rumen and intestine. As the number of culture generations increased, the relative abundance of the Proteobacteria in the rumen and intestine increased dramatically, accounting for more than 70% of the total, and it was possible that the Proteobacteria in the camel's digestive tract responded positively to the stress of IQ.
Microorganisms were further isolated and purified from IQ‐stressed third‐generation cultures. Four strains were finally screened for good IQ clearance, including two strains of Ochrobactrum, one strain of Pseudomonas, and another strain of Bacillus. Results were accordant with the observation of relative abundance analysis. The strains of third generation of the rumen contents were mainly attributed to Brevundimonas and Pseudomonas and strains in intestine were mainly as Ochrobactrum, Bacillus, and Pseudomonas. Results of bacteria identification and their phylogenetic tree analysis also showed greater abundance of Ochrobactrum, Bacillus, Pseudomonas, and Brevundimonas genera, which indicated bacteria of these dominant genera exerted stronger tolerance to IQ.
Microorganisms of the genus Ochrobactrum could be found in fermented foods, which might result from their strong resistance to heat, drought, and high‐salt conditions (Chen et al., 2021; Hu et al., 2020; Hui et al., 2017). These strains were also able to degrade organic pollutants such as aromatic compounds, pesticides, and veterinary drugs, thus their application in food safety and bioenvironmental remediation has an important potential (Ma et al., 2022; Wozniak‐karczewska et al., 2018).
Bacillus spp. have a strong antibacterial activity and good degradation of many pesticides, such as pentachloronitrobenzene (PCNB), fluazinam, and clofenotane (DDT) in food (Wozniak‐karczewska et al., 2018). López et al. (2021) found that Bacillus spp. derived from the intestinal microflora were able to tolerate or degrade the endocrine disruptor bisphenol A (BPA). Studies have confirmed that Bacillus spp. can express enzymes catalyzing the cleavage of the C‐C bonds in aromatic rings and thus degrade organic pollutants. After treatment with polycyclic aromatic hydrocarbons (PAHs), certain proteins in Bacillus spp. were involved in various biological processes such as energy metabolism, biosynthesis, transmembrane transport, and oxidative stress (Zhu et al., 2019). Bacillus spp. may be an effective strain for degrading foodborne toxins like PAHs, HAs, and pesticides. Pseudomonas was also capable of degrading HAs (Zhao et al., 2012). The genera Bacillus and Pseudomonas were found in fermented foods, especially the Bacillus spp. were the starter strains for soybeans, cereals, or fishes to produce tofu, natto, or fish sauce (Divyashree et al., 2024; Li et al., 2023; Obinze et al., 2022; Sivamaruthi et al., 2022). Results indicated the strains of Ochrobactrum, Bacillus, and Pseudomonas from the digestive tract of camels provided a microbial resource for food safety to biodegrade various toxins.
Four efficient degrading strains were finally screened from the camel rumen and intestine: L6 (Ochrobactrum), L15 (Pseudomonas), C1 (Ochrobactrum), and C16 (Bacillus). Their degrading ability ranging from 20% to 30% was correspondingly high (Stidl et al., 2008; Vanhaecke et al., 2008). Multiple uses of these bacteria may increase the IQ‐degrading capacity, because these bacteria showed different biodegrading pathways, which may contribute to synergy of IQ decreasing (Nogacka et al., 2019).
Microbes may exert biodegrading ability by binding IQ or other toxins and destructing their chemical structures (Nogacka et al., 2019; Shao et al., 2022). Microbial cells, cell debris, and cell wall skeleton could bind IQ or other toxic substances. Some enzymes were released from microbes to catalyze the destruction of these toxic substances (Farag et al., 2022; Sallan et al., 2023). Microbes, in turn, were damaged by these substances. During the IQ‐stressed incubation, deformation and lysis were observed on the surface of the bacteria by electron microscopy, indicating that IQ has damaged the growth of the degrading strain. The morphological damage to the four strains may be caused by the poor nutritional conditions of the inorganic salt medium, which used IQ as the only carbon source. Detailed biodegrading mechanism needs to be further revealed.
Microorganisms that could degrade HAs are mainly from polluted environments such as soil and water bodies (Wang et al., 2015; Zhao et al., 2012). This experiment was the first to obtain bacteria from the digestive tract of camels that could degrade IQ, revealing the degrading characteristics of bacteria. Therefore, this research was valuable for studying the degradation of food‐borne toxic and harmful substances. Based on the study, the application of microbial resources in the animal digestive tract will be expanded to provide data for microbial degradation of foodborne pollutants.
AUTHOR CONTRIBUTIONS
Jialing Lin: Software, Data curation. Chuanhui Zeng: Investigation, Methodology. Xueli Li: Writing – Review and Editing, Project administration. Qin Tang: Methodology, Writing – original draft. Jing Liao: Resources and Project administration. Yan Jiang: Conceptualization, Project administration. Xianchun Zeng: Conceptualization, Visualization, Resources, Funding acquisition.
CONFLICT OF INTEREST STATEMENT
The authors declare that they have no conflict of interest.
ETHICS STATEMENT
Ethics approval was not required for this research.
The reference list from the paper itself. Each links out to its DOI / PubMed record.
- 1An, D. D. , Zhu, Y. L. , Tang, J. , Ye, Y. , & Zeng, X. (2010). Screening of harmine tolerance/degrading bacteria from camel rumen. Acta Microbiologica Sinica, 50, 1001–1007 (In Chinese Press).20931866 · pubmed ↗
- 2Bhatt, V. D. , Dande, S. S. , Patil, N. V. , & Joshi, C. G. (2013). Molecular analysis of the bacterial microbiome in the forestomach fluid from the dromedary camel (Camelus dromedarius). Molecular Biology Reports, 40, 3363–3371.23277394 10.1007/s 11033-012-2411-4 · doi ↗ · pubmed ↗
- 3Bylsma, L. C. , & Alexander, D. D. (2015). A review and meta‐analysis of prospective studies of red and processed meat, meat cooking methods, heme iron, heterocyclic amines and prostate cancer. Nutrition Journal, 14, 125.26689289 10.1186/s 12937-015-0111-3PMC 4687294 · doi ↗ · pubmed ↗
- 4Chen, Y. , Zheng, S. , Zhang, G. , Luo, J. , Liu, J. , & Peng, X. (2021). Chemical, microbial, and metabolic analysis of Taisui cultured in honey solution. Food Science & Nutrition, 9(4), 2158–2168.33841832 10.1002/fsn 3.2185 PMC 8020961 · doi ↗ · pubmed ↗
- 5Divyashree, S. , Ramu, R. , & Sreenivasa, M. Y. (2024). Evaluation of new candidate probiotic Lactobacillus strains isolated from a traditional fermented food‐multigrain‐millet dosa batter. Food Bioscience, 57, 103450.
- 6Edgar, R. C. , Haas, B. J. , Clemente, J. C. , Quince, C. , & Knight, R. (2011). UCHIME improves sensitivity and speed of chimera detection. Bioinformatics, 27, 2194–2200.21700674 10.1093/bioinformatics/btr 381PMC 3150044 · doi ↗ · pubmed ↗
- 7Farag, M. A. , Shakour, Z. T. A. , Elmassry, M. M. , & Donia, M. S. (2022). Metabolites profiling reveals gut microbiome‐mediated biotransformation of green tea polyphenols in the presence of N‐nitrosamine as pro‐oxidant. Food Chemistry, 371, 131147.34808759 10.1016/j.foodchem.2021.131147 · doi ↗ · pubmed ↗
- 8Fei, X. Q. , Li, C. , Yu, X. D. , & Chen, H. Y. (2007). Determination of heterocyclic amines by capillary electrophoresis with UV‐DAD detection using on‐line preconcentration. Journal of Chromatography B, 854(1–2), 224–229.10.1016/j.jchromb.2007.04.03117517539 · doi ↗ · pubmed ↗