Intermediate-Term Prognostic Value of Homocysteine in Acute Coronary Syndrome Complicated with or without Hypertension: A Multicenter Observational Cohort Study
Qiang Chen, Shiqiang Xiong, Xunshi Ding, Xiuqiong Yu, Caiyan Cui, Hong Su, Yu Long, Yan Luo, Zhen Zhang, Hanxiong Liu, Tao Xiang, Lin Cai

TL;DR
High homocysteine levels predict worse outcomes in heart attack patients, regardless of whether they have high blood pressure.
Contribution
Shows homocysteine is a consistent predictor of mortality in ACS patients, irrespective of hypertension status.
Findings
Elevated homocysteine levels were linked to higher mortality in both hypertensive and nonhypertensive ACS patients.
Kaplan-Meier analysis showed lower survival in high homocysteine groups across both blood pressure categories.
Multivariate analysis confirmed homocysteine as a significant predictor of intermediate-term mortality in ACS.
Abstract
As a classical biomarker associated with hypertension, the prognostic value of homocysteine (Hcy) in the intermediate-term outcome of acute coronary syndrome (ACS) remains controversial. This study aimed to investigate the role of homocysteine in ACS patients with different blood pressure statuses. A total of 1288 ACS patients from 11 general hospitals in Chengdu, China, from June 2015 to December 2019 were consecutively included in this observational study. The primary endpoint was defined as all-cause death. Secondary endpoints included cardiac death, nonfatal myocardial infarction (MI), unplanned revascularization and nonfatal stroke. The patients in the hypertension group (n = 788) were further stratified into hyperhomocysteinemia (H-Hcy, n = 245) and normal homocysteinaemia subgroups (N-Hcy, n = 543) around the cut-off value of 16.81 µmol/L. Similarly, the…
Genes, proteins, chemicals, diseases, species, mutations and cell lines named across the full text — each resolved to its canonical identifier and authoritative record.
Click any figure to enlarge with its caption.
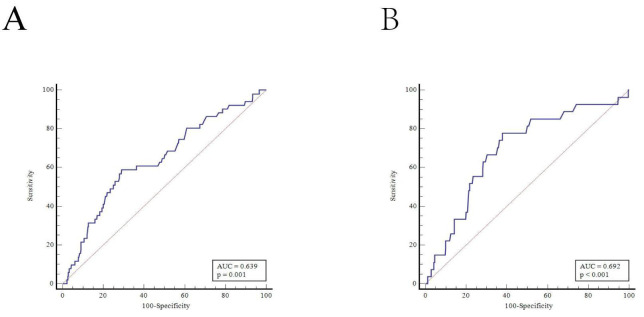 Fig. 1
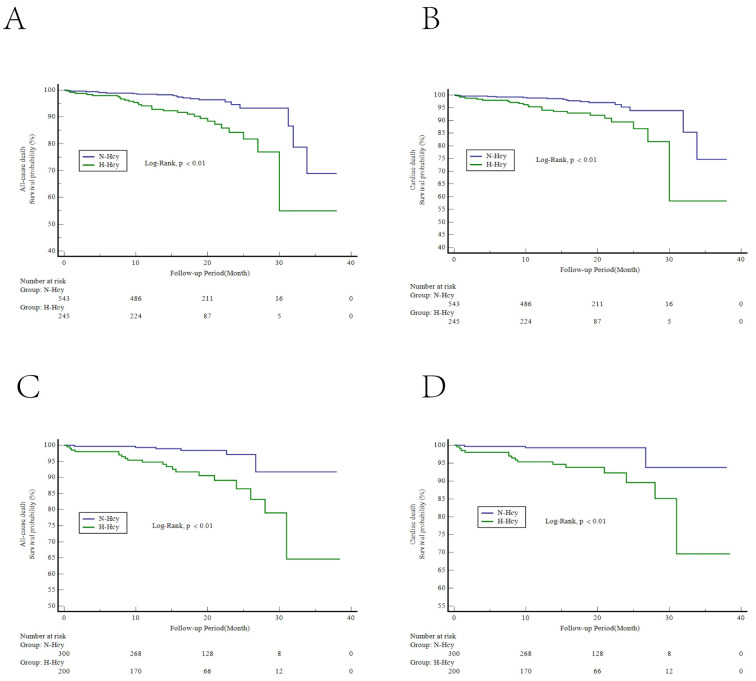 Fig. 2
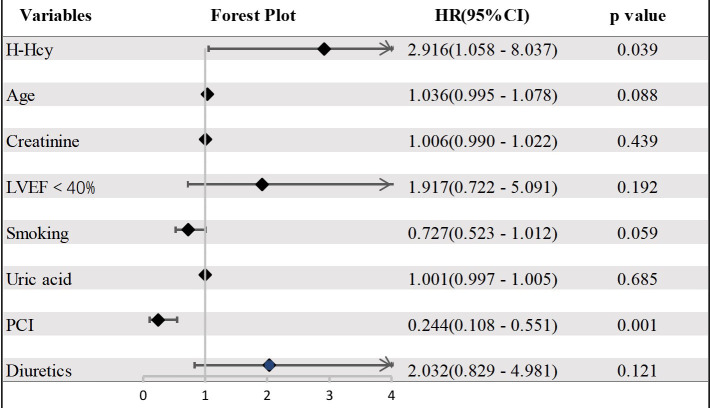 Fig. 3
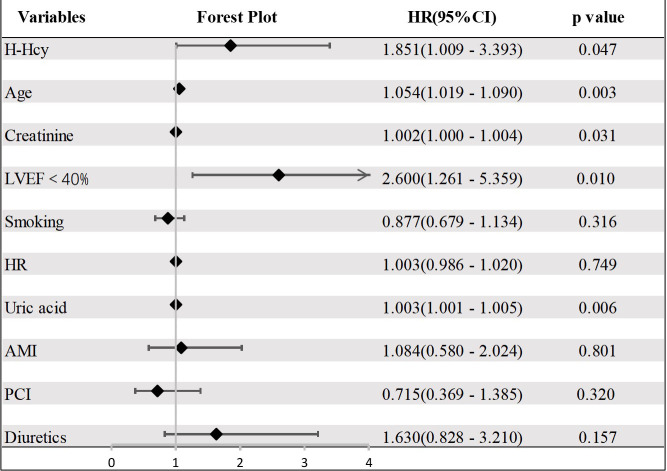 Fig. 4
| Variable | Total population | Hypertension (n = 788) | Non-hypertension (n = 500) |
| |
| Age, years | 66.58 | 68.75 | 63.17 | ||
| Female, n (%) | 358 (27.8) | 267 (33.9) | 91 (19.2) | ||
| Smoking, n (%) | 492 (38.2) | 254 (32.2) | 238 (47.6) | ||
| Previous PCI, n (%) | 112 (8.7) | 71 (9.0) | 41 (8.2) | 0.615 | |
| Previous stroke, n (%) | 72 (5.6) | 59 (7.5) | 13 (2.6) | ||
| Diabetes mellitus, n (%) | 406 (31.5) | 290 (36.8) | 116 (23.2) | ||
| SBP, mmHg | 132.78 | 138.13 | 124.42 | ||
| HR, bpm | 77.72 | 76.92 | 78.97 | 0.024 | |
| cTnT, pg/mL | 24.65 (9.88, 434.33) | 22.17 (10.34, 289.00) | 33.96 (8.47, 1042.5) | 0.109 | |
| BNP, pg/mL | 135.80 (66.95, 429.18) | 131.75 (67.13, 429.18) | 139.35 (62.25, 429.18) | 0.857 | |
| Creatinin, µmol/L | 77.05 (65.03, 92.40) | 79.85 (65.80, 96.00) | 73.95 (64.50, 87.93) | ||
| Uric acid, µmol/L | 378.44 | 387.00 | 364.94 | 0.001 | |
| FBG, mmol/L | 7.31 | 7.42 | 7.15 | 0.202 | |
| Triglyceride, mmol/L | 1.40 (1.02, 2.13) | 1.44 (1.03, 2.18) | 1.37 (1.00, 1.98) | 0.132 | |
| Total cholesterol, mmol/L | 4.37 (3.62, 5.18) | 4.31 (3.58, 5.20) | 4.40 (3.43, 5.15) | 0.617 | |
| LDL-C, mmol/L | 2.64 (2.09, 3.28) | 2.59 (2.05, 3.28) | 2.71 (2.19, 3.28) | 0.064 | |
| HDL-C, mmol/L | 1.12 (0.95, 1.34) | 1.14 (0.96, 1.35) | 1.11 (0.94, 1.33) | 0.532 | |
| Lp (a), mg/L | 153.20 (66.23, 276.15) | 138.8 (65.7, 267.88) | 173.5 (69.63, 308.43) | 0.148 | |
| Hcy, µmol/L | 13.40 (10.70, 17.59) | 13.83 (11.04, 18.44) | 12.85 (10.40, 16.50) | 0.001 | |
| H-Hcy, n (%) | 445 (34.5) | 245 (31.1) | 200 (40.0) | 0.001 | |
| Multivessel disease, n (%) | 732 (56.8) | 469 (59.5) | 263 (52.6) | 0.015 | |
| Calcified lesions, n (%) | 138 (10.7) | 106 (13.5) | 32 (6.4) | ||
| Thrombosis, n (%) | 49 (3.8) | 22 (2.8) | 27 (5.4) | 0.017 | |
| LVEF | 55.18 | 55.25 | 55.05 | 0.715 | |
| LVEF | 95 (7.5) | 60 (7.6) | 36 (7.2) | 0.783 | |
| Premature ACS (%) | 291 (22.6) | 144 (18.3) | 147 (29.4) | ||
| AMI, n (%) | 693 (53.8) | 389 (49.4) | 304 (60.8) | ||
| Diagnosis, n (%) | |||||
| UA | 595 (46.2) | 399 (50.6) | 196 (39.2) | ||
| NSTEMI | 297 (23.1) | 185 (23.5) | 112 (22.4) | ||
| STEMI | 396 (30.7) | 204 (25.9) | 192 (38.4) | ||
| PCI, n (%) | 1102 (85.6) | 674 (85.5) | 428 (85.6) | 0.973 | |
| Discharge medications | |||||
| Aspirin, n (%) | 1224 (95.0) | 756 (95.9) | 468 (93.6) | 0.060 | |
| P2Y12 receptor inhibitor, n (%) | 1265 (98.2) | 778 (98.7) | 487 (97.4) | 0.079 | |
| Statins, n (%) | 1231 (95.6) | 750 (95.2) | 481 (96.2) | 0.385 | |
| 893 (69.3) | 547 (69.4) | 346 (69.2) | 0.935 | ||
| ACEI/ARB, n (%) | 584 (45.3) | 458 (58.1) | 126 (25.2) | ||
| Diuretics, n (%) | 225 (17.5) | 162 (20.6) | 63 (12.6) | ||
| Variable | Hypertension (n = 788) | Non-hypertension (n = 500) | |||||
| H-Hcy (n = 245) | N-Hcy (n = 543) |
| H-Hcy (n = 200) | N-Hcy (n = 300) |
| ||
| Age, years | 70.82 | 67.82 | 65.52 | 61.6 | |||
| Female, n (%) | 55 (22.4) | 212 (39.0) | 31 (15.5) | 60 (20.0) | 0.20 | ||
| Smoking, n (%) | 78 (31.8) | 176 (32.4) | 0.873 | 92 (46) | 146 (48.7) | 0.56 | |
| previous PCI, n (%) | 24 (9.8) | 47 (8.7) | 0.605 | 19 (9.5) | 22 (7.3) | 0.387 | |
| Previous stroke, n (%) | 29 (11.8) | 30 (5.5) | 10 (5) | 3 (1) | |||
| Diabetes mellitus, n (%) | 92 (37.6) | 198 (36.5) | 0.77 | 35 (17.5) | 81 (27) | 0.014 | |
| SBP, mmHg | 134.35 | 139.72 | 0.003 | 125.76 | 123.61 | 0.208 | |
| HR, bpm | 74.87 | 77.84 | 0.011 | 80.34 | 78.06 | 0.143 | |
| cTnT, pg/mL | 28.13 (13.62, 285.90) | 19.71 (8.77, 290.00) | 0.013 | 37.94 (8.43, 1231.00) | 33.96 (8.47, 730.70) | 0.876 | |
| BNP, pg/mL | 175.2 (78, 577.1) | 120.4 (59.2, 378.5) | 170.85 (68, 435.49) | 130.9 (59.25, 365.45) | 0.028 | ||
| Creatinin, µmol/L | 96 (80.15, 126.5) | 74.7 (62.9, 87.6) | 79.95 (68.27, 95.5) | 70.9 (62.37, 81.47) | |||
| Uric acid, µmol/L | 441.93 | 362.22 | 397.24 | 343.41 | |||
| FBG, mmol/L | 7.21 | 7.36 | 0.602 | 7.34 | 7.31 | 0.919 | |
| Triglyceride, mmol/L | 1.41 (1.01, 2.13) | 1.45 (1.04, 2.2) | 0.358 | 1.33 (0.97, 1.99) | 1.38 (1, 1.97) | 0.873 | |
| Total cholesterol, mmol/L | 4.3 (3.51, 5.11) | 4.32 (3.6, 5.23) | 0.323 | 4.29 (3.51, 4.99) | 4.47 (3.84, 5.2) | 0.027 | |
| LDL-C, mmol/L | 2.44 (1.94, 3.08) | 2.63 (2.06, 3.34) | 0.014 | 2.65 (2.1, 3.25) | 2.76 (2.24, 3.34) | 0.14 | |
| HDL-C, mmol/L | 1.09 (0.9, 1.31) | 1.14 (0.97, 1.37) | 1.11 (0.94, 1.35) | 1.1 (0.94, 1.32) | 0.543 | ||
| Lp (a), mg/L | 133 (60.1, 265.52) | 144 (67.9, 273.3) | 0.405 | 189.6 (76.9, 266.55) | 163.35 (65.77, 327.75) | 0.644 | |
| Multivessel disease, n (%) | 150 (61.2) | 319 (58.7) | 0.512 | 110 (55) | 153 (51) | 0.38 | |
| Calcified lesions, n (%) | 36 (14.7) | 70 (12.9) | 0.492 | 19 (9.5) | 13 (4.3) | 0.021 | |
| Thrombosis, n (%) | 7 (2.9) | 15 (2.8) | 0.940 | 9 (4.5) | 18 (6.0) | 0.467 | |
| LVEF | 53.44 | 56.06 | 53.45 | 56.12 | |||
| LVEF | 28 (11.4) | 32 (5.9) | 17 (8.5) | 19 (6.3) | 0.359 | ||
| Premature ACS (%) | 29 (11.8) | 115 (21.2) | 49 (24.5) | 98 (32.7) | 0.05 | ||
| AMI, n (%) | 133 (54.3) | 256 (47.1) | 0.064 | 125 (62.5) | 179 (59.7) | 0.525 | |
| PCI, n (%) | 205 (83.7) | 469 (86.4) | 0.319 | 166 (83.0) | 262 (87.3) | 0.176 | |
| Diagnosis, n (%) | 0.104 | 0.516 | |||||
| UA | 112 (45.7) | 287 (52.9) | 75 (37.5) | 121 (40.3) | |||
| NSTEMI | 68 (27.8) | 117 (21.5) | 50 (25.0) | 62 (20.7) | |||
| STEMI | 65 (26.5) | 139 (25.6) | 75 (37.5) | 117 (39) | |||
| Discharge medications | |||||||
| Aspirin, n (%) | 236 (96.3) | 520 (95.8) | 0.711 | 183 (91.5) | 285 (95.0) | 0.117 | |
| 242 (98.8) | 53.6 (98.7) | 0.940 | 193 (96.5) | 294 (98.0) | 0.302 | ||
| Statins, n (%) | 237 (96.7) | 513 (94.5) | 0.171 | 191 (95.5) | 290 (96.7) | 0.504 | |
| 159 (64.9) | 388 (71.5) | 0.064 | 134 (67.0) | 212 (70.7) | 0.384 | ||
| ACEI/ARB, n (%) | 133 (54.3) | 325 (59.9) | 0.143 | 62 (31.0) | 64 (21.3) | 0.015 | |
| Diuretics, n (%) | 65 (26.5) | 97 (17.9) | 0.005 | 34 (17.0) | 29 (9.7) | 0.015 | |
| Hypertension (n = 788) | Non-hypertension (n = 500) | |||||
| H-Hcy (n = 245) | N-Hcy (n = 543) |
| H-Hcy (n = 200) | N-Hcy (n = 300) |
| |
| All-cause death, n (%) | 30 (12.2) | 21 (3.9) | 21 (10.5) | 6 (2.0) | ||
| Cardiac death, n (%) | 23 (9.4) | 17 (3.1) | 16 (8.0) | 3 (1.0) | ||
| Non-fatal MI, n (%) | 8 (3.3) | 12 (2.2) | 0.383 | 7 (3.5) | 7 (2.3) | 0.439 |
| Unplanned revascularization, n (%) | 22 (9.0) | 43 (7.9) | 0.616 | 13 (6.5) | 26 (8.7) | 0.376 |
| Non-fatal stroke, n (%) | 3 (1.2) | 4 (0.7) | 0.791 | 1 (0.5) | 2 (0.7) | |
- —Science and Technology Department of Sichuan
- —National Natural Science Foundation of China
- —Chengdu High-level Key Clinical Specialty Construction Project
Peer Reviews
No public reviews on file for this paper yet. If you reviewed it on a platform where reviews are public (OpenReview, ICLR, NeurIPS, ICML), you can paste yours below so the community can read it here.
Videos
No videos yet. Explain this paper in a talk, walkthrough, or lecture? Add one.
Taxonomy
TopicsFolate and B Vitamins Research · GDF15 and Related Biomarkers · Esophageal and GI Pathology
1. Introduction
Acute coronary syndrome (ACS) remains a serious type of coronary atherosclerotic disease (CAD) with high morbidity and mortality worldwide [1]. Despite receiving the optimum treatment recommended by modern guidelines, including early revascularization of lesions, dual antiplatelet treatment and intensive lipid-lowering therapy, some ACS patients are still at risk for recurrence of adverse cardiovascular events. Identifying high-risk ACS populations based on prognostic risk factors, including cardiometabolic factors, and providing them with optimal comprehensive treatment and nursing care is necessary to further improve their prognosis [2].
Homocysteine (Hcy), derived from methionine (Met) metabolism, along with uric acid, proinflammatory molecules (such as C-reactive protein), glucose metabolism, dyslipidemia, overweight or obesity and hypertension, has received attention as a newly emerging cardiometabolic risk factor for cardiovascular disease (CVD) [3] by promoting plaque formation and atherosclerosis, causing platelet aggregation and blood coagulation, altering lipid metabolism, and triggering inflammatory responses [4]. Previous studies have illustrated that elevated serum Hcy was associated with higher risks of cardiovascular events in ACS patients [5, 6, 7]. In contrast, a Mendelian randomization study indicated that there is no causal relationship between plasma Hcy and CVD or acute myocardial infarction (AMI) [8]. Thus, the conflicting findings from current studies render the relationship between Hcy and the outcome of ACS controversial.
In addition, an elevated Hcy level is strongly associated with the occurrence and progression of hypertension by inhibiting endogenous hydrogen sulfide generation and activating angiotensin-converting enzymes [9, 10]. Previous studies have reported that hypertension and hyperhomocysteinemia have a significant synergistic effect on the prognosis of CVD [11, 12]. Hcy could have a different influence on prognosis in ACS patients with or without hypertension. However, most studies currently adopt the definite Hcy classification criteria for all ACS patients to guide risk stratification, regardless of their blood pressure status, which might misestimate their actual risk. Therefore, our study intended to adopt different cut-off values determined by receiver operating characteristic (ROC) curve analysis in hypertensive and nonhypertensive patients with ACS to explore the prognostic significance of Hcy in the intermediate-term outcomes of patients with different blood pressure statuses.
2. Materials and Methods
2.1 Study Population and Design
A total of 1288 ACS patients from 11 general hospitals in Chengdu from June 2015 to December 2019 were consecutively included in this observational study. The diagnosis of ACS, including ST-elevation myocardial infarction (STEMI), non-ST-elevation myocardial infarction (NSTEMI), and unstable angina pectoris (UA), was guided by the corresponding guidelines [13, 14]. The exclusion criteria were as follows: (1) age younger than 18 years; (2) incomplete baseline data; (3) loss to follow-up; (4) uncompensated chronic renal dysfunction with creatinine clearance (CrCl) 15 mL/min; (5) complicated severe chronic disease with a life expectancy 1 year; and (6) death in hospital.
The demographic, clinical, biochemical, and angiographic data and discharge medications were gathered by trained professionals from the hospital medical records system. Patients were classified into two groups based on their discharge diagnosis: hypertension and nonhypertension. To further increase the prognostic importance of the study, the optimum cut-off value for plasma Hcy concentration to measure intermediate-term mortality was evaluated by ROC curve analysis. According to the optimum cut-off value of each group, hypertensive patients were further subdivided into hyperhomocysteinemia (H-Hcy) (n = 245) and normal homocysteinemia (N-Hcy) groups (n = 543) (the area under the ROC curve (AUC) was 0.639, the sensitivity was 58.8%, the specificity was 71.0%, and the optimal cut-off value was 16.81 µmol/L, *p * 0.001, Fig. 1A). Similarly, nonhypertensive patients were subdivided into H-Hcy (n = 200) and N-Hcy groups (n = 300) (the AUC was 0.692, the sensitivity was 77.8%, the specificity was 62.2%, and the optimal cut-off value was 14.0 µmol/L, *p * 0.001, Fig. 1B).
ROC curve analysis determined the optimum cut-off value of plasma homocysteine concentration to measure intermediate-term mortality. (A) ROC curve analysis in hypertension. (B) ROC curve analysis in nonhypertension. AUC, area under the ROC curve; ROC, receiver operating characteristic.
The study was registered in the Chinese Clinical Trials Registry in China (ChiCTR1900025138). We affirm that our protocol was conducted in compliance with the Declaration of Helsinki and approved by the local ethics committee. Due to its retrospective nature, the committee waived the requirement for formal informed consent.
2.2 Follow-up and Definitions
After discharge, regular follow-up was performed by a professional cardiologist at 1, 3, 6, and 12 months and then annually thereafter. Prognostic information was obtained by consulting electronic medical records or telephone inquiries. We discontinued follow-up when death was recorded. The primary endpoint was defined as all-cause death. The secondary endpoints included cardiac death, nonfatal myocardial infarction (MI), unplanned revascularization, and nonfatal stroke.
Hypertension was defined as a systolic blood pressure (SBP) 140 mmHg and/or a diastolic blood pressure (DBP) 90 mmHg during hospitalization or a history of hypertension [15]. Premature ACS referred to the occurrence of ACS in men younger than 55 years old and women younger than 65 years old [16]. Multivessel disease meant stenosis 50% in 1 of the major coronary arteries [17].
Cardiac death meant death driven by MI, heart failure (HF) and/or arrhythmia and included sudden death without a definite cause [18]. Unplanned revascularization meant the recurrent revascularization of any lesion by percutaneous coronary intervention (PCI) or coronary artery bypass grafting (CABG) [19]. Stroke was defined as ischaemic or hemorrhagic stroke during the follow-up period as confirmed by imaging and diagnosed by professional neurologists.
2.3 Statistical Analysis
Continuous data are expressed as the mean standard deviation (SD) or interquartile range (IQR). They were compared using Student’s t-test or the Mann‒Whitney U test. Categorical variables are expressed as percentages and were compared using the chi-square test or Fisher’s exact test. The optimum cut-off value of serum Hcy was obtained from ROC curve analysis. The time-to-event data were plotted using the Kaplan‒Meier method, and the log-rank test was applied to evaluate discrepancies between the groups. With all-cause death as the dependent variable, univariate Cox analysis was conducted. Then, multivariate Cox analysis was done to evaluate whether elevated Hcy concentrations were linked to a worse prognosis. MedCalc Statistical Software, version 19.6.1 (MedCalc Software, Ostend, Belgium), was used for all statistical analyses. All statistical tests were 2-tailed, and a p value 0.05 was considered to be statistically significant.
3. Results
3.1 Baseline Characteristics
This analysis included 1288 ACS patients (595 UA, 396 STEMI, and 297 NSTEMI), including 788 hypertensive patients (61.2%) and 500 nonhypertensive patients (38.8%), with an average age of 66.58 12.12 years. The median plasma Hcy level was 13.82 (IQR, 11.04–18.44) µmol/L in the hypertension group and 12.85 (IQR, 10.4–16.5) µmol/L in the nonhypertension group. The baseline characteristics stratified by different blood pressure statuses are presented in Table 1. The hypertension group was older; included more women; had a higher prevalence of diabetes mellitus, stroke history, multivessel disease and calcified lesions; and had higher levels of SBP, serum creatinine, uric acid, and plasma Hcy (*p * 0.05). However, their proportions of current smokers, thrombosis, and AMI were lower than those in nonhypertensive patients (*p * 0.05). Regarding discharge medications, there were significant differences in the use of angiotensin converting enzyme inhibitor/angiotensin II receptor blocker (ACEIs/ARBs) and diuretics between the patients with and without hypertension.
Table 1.: Baseline characteristics of the study patients stratified by blood pressure status.
Table 2 summarizes the baseline demographic, clinical, biochemical, and
angiographic data of hypertension and nonhypertension groups when stratified by
the cut-off value for plasma Hcy. H-Hcy subjects were older and had higher levels
of serum B-type natriuretic peptide (BNP), creatinine, and uric acid and lower left ventricular ejection fraction (LVEF) in both hypertension
and nonhypertension groups (*p *
0.05 for both). In addition, the
proportions of patients with a history of stroke and the use of diuretics were
higher in the population with H-Hcy in both groups (*p *
0.05 for
both). In the hypertension group, the H-Hcy subgroup had fewer women and lower
SBP, heart rate (HR), low-density lipoprotein cholesterol (LDL-C) and high-density lipoprotein cholesterol (HDL-C) levels (*p *
0.05) than the N-Hcy group.
Moreover, the proportion of heart failure (LVEF 40%) in the subgroup with
H-Hcy was higher (*p *
0.05). In the nonhypertension group, H-Hcy
patients had a larger proportion of calcified coronary lesions, and these
patients had a lower level of total cholesterol (*p *
0.05).
Additionally, smoking habit, previous revascularization therapy, diabetes
mellitus, multivessel disease, and the levels of triglycerides and Lp(a) did not
differ between hypertension and nonhypertension subgroups (*p *
0.05).
Table 2.: Baseline characteristics of patients in different Hcy subgroups.
3.2 Intermediate-Term Clinical Outcomes
The median follow-up duration was 18 (range: 13.83–22.37) months, and 78 (6.05%), 59 (4.58%), 34 (2.64%), 104 (8.07%), and 10 (0.77%) cases of all-cause death, cardiac death, nonfatal MI, revascularization, and nonfatal stroke were recorded, respectively. The number of all-cause mortality and cardiac death events was higher in the H-Hcy subgroup than in the N-Hcy subgroup of both hypertensive and nonhypertensive patients (*p * 0.01) (Table 3). The survival analysis illustrated that the H-Hcy subgroup had a lower survival probability from all-cause death and cardiac death than the N-Hcy subgroup in both the hypertension (Fig. 2A,B) and nonhypertension groups (Fig. 2C,D) (*p * 0.01).
Kaplan-Meier curves of intermediate-term clinical outcomes. Kaplan-Meier curves for the survival probability of all-cause death (A) and cardiac death (B) in the hypertension group and all-cause death (C) and cardiac death (D) in the nonhypertension group. H-Hcy, hyperhomocysteinemia; N-Hcy, normal homocysteinemia.
3.3 Predictors of Intermediate-Term All-Cause Death
The univariate analysis results are presented in Supplementary Table 1. In the nonhypertension group, H-Hcy, age, creatinine, LVEF 40%, smoking, uric acid, diuretics, and PCI were relevant to the risk of all-cause death. After adjusting for confounding factors, multivariate Cox analysis indicated that H-Hcy was an independent predictor of all-cause death (HR 2.916, 95% CI: 1.058 to 8.037, p = 0.039) (Fig. 3, Supplementary Table 2). Conversely, in the hypertension group, multivariate Cox regression analysis implied that the independent predictors of all-cause death were age (HR = 1.054, 95% CI: 1.019 to 1.090, p = 0.003), H-Hcy (HR = 1.851, 95% CI: 1.009 to 3.393, p = 0.047), creatinine (HR = 1.002, 95% CI: 1.000 to 1.004, p = 0.031), LVEF 40% (HR = 2.600, 95% CI: 1.261 to 5.359, p = 0.010), and uric acid (HR = 1.003, 95% CI: 1.001 to 1.005, p = 0.006) (Fig. 4, Supplementary Table 2).
Forest plot of all-cause death in the nonhypertension group. CI, confidence interval; LVEF, left ventricular ejection fraction; PCI, percutaneous coronary intervention; H-Hcy, hyperhomocysteinemia; HR, hazard radio.
Forest plot of all-cause death in the hypertension group. CI, confidence interval; LVEF, left ventricular ejection fraction; PCI, percutaneous coronary intervention; H-Hcy, hyperhomocysteinemia; AMI, acute myocardial infarction; HR, heart rate.
4. Discussion
The results of this study revealed that (1) H-Hcy patients had higher all-cause mortality and cardiac death events than those with normal Hcy in ACS, regardless of the status of blood pressure; (2) elevated serum Hcy concentration was an independent predictor of intermediate-term all-cause mortality in ACS patients with or without hypertension; and (3) ACS patients with or without hypertension could have different thresholds of serum Hcy for predicting intermediate-term mortality, which might be conducive to optimizing the risk stratification of ACS in clinical practice.
Serum Hcy, as a classic biomarker, has been reported to be an independent risk factor for cardio-cerebrovascular diseases [3, 7, 20, 21] and is associated with plaque formation and atherosclerosis progression [4, 22] by damaging vascular endothelial cells, altering lipid metabolism, and triggering inflammatory responses. In addition, it can participate in acute coronary events by disrupting the balance between blood coagulation and fibrinolysis, leading to platelet aggregation and blood coagulation [23]. Thus, Hcy has been regarded as a prognostic factor for CAD. Li S et al. [24] found that H-Hcy (HR = 1.075, 95% CI: 1.032–1.120, *p * 0.01) is an independent predictor of adverse cardiovascular and cerebrovascular events in patients with CAD who underwent drug-eluting stent implantation. A meta-analysis revealed that elevated serum Hcy in patients who underwent PCI increased the risks of all-cause mortality by an average of 3.19-fold (HR = 3.19, 95% CI: 1.90–5.34, *p * 0.01), major adverse cardiovascular events by 1.51-fold (HR = 1.51, 95% CI: 1.23–1.85, *p * 0.01), and cardiac death by 2.76-fold (HR = 2.76, 95% CI: 1.44–5.32, *p * 0.01) [7].
Genetic background, eating habits, and living habits all affect the serum level of Hcy [25]. The mean Hcy levels vary between different regions or races. The threshold for H-Hcy has been inconsistent among various studies [24, 26]. Therefore, using definite cut-off values of Hcy concentrations defined by guidelines or previous classical studies to guide risk stratification might misestimate the actual risk in a given patient. In addition, because Hcy and hypertension have a synergistic effect on the prognosis of cardiovascular disease [11], Hcy could have different effects on the prognosis of ACS patients with different blood pressure statuses. Based on this fact, we divided ACS patients into hypertension and nonhypertension groups and used ROC curve analysis to determine the optimum critical value of Hcy for predicting intermediate-term mortality in ACS patients with hypertension and the critical value in those without hypertension. The two groups were then subdivided into two subgroups based on their respective optimum cut-off values: an H-Hcy subgroup and a normal Hcy subgroup. We think the research method we adopted in this study may be more reasonable than those used in other studies. The results ultimately showed that the cut-off value of Hcy for predicting intermediate-term mortality was 16.81 µmol/L in patients with hypertension and 14.0 µmol/L in patients without hypertension, which could be conducive to individualized risk stratification of ACS patients.
Kaplan‒Meier curves demonstrated that H-Hcy was associated with intermediate-term mortality, including all-cause mortality and cardiac death, during the 18-month median follow-up in the two groups, consistent with previous studies [5, 7]. After adjusting for other risk factors, multivariate Cox regression revealed that H-Hcy was strongly associated with intermediate-term mortality in both hypertensive and nonhypertensive patients. We speculate that this outcome could have the following explanations. The patients in the H-Hcy group were older and had higher levels of serum BNP, creatinine, and uric acid and a lower ejection fraction. Some of the above factors are part of the GRACE score, which is an established tool that well predicts the prognosis of ACS patients [27, 28]. Calim A* et al*. [6] recently reported a significant positive correlation between Hcy and GRACE risk score in ACS patients. Homocysteine, together with uric acid, proinflammatory molecules (represented by C-reactive protein), glucose metabolism, dyslipidemia, overweight or obesity and hypertension, are emerging cardiometabolic risk factors that could aggravate poor prognosis by resulting in systemic inflammation, oxidative stress, and ultimately the progression of atherosclerosis and CVDs [3, 29]. Although controversies exist [8], Hcy has received attention as an independent prognostic factor for CVDs.
Consistent with classical theory [30], we also found that the proportion of complicated strokes was higher in the H-Hcy group than in the N-Hcy group. A study conducted in six centers in China revealed that the risk of stroke in a high-Hcy population increased by 87% [31]. However, the study that we conducted failed to establish a link between Hcy and nonfatal stroke during the follow-up. This outcome could be due to the small sample size, short follow-up time, and few endpoints observed in this study. In addition, previous studies have shown that the use of folate can reduce the risk of stroke but not the risk of heart attack [32, 33, 34]. Patients with hyperhomocysteinemia can receive folic acid treatment early, so an increased risk of stroke in patients with hyperhomocysteinemia was not observed in this study.
Our investigation has several limitations. First, this study only explored the relationship between Hcy levels and the intermediate-term prognosis of ACS. Whether homocysteine-lowering therapy could improve the prognosis of ACS was not evaluated because critical data were not available in some centers. Second, there was inevitable bias due to the retrospective nature of this study with its relatively small sample size and relatively short follow-up duration. Third, there are differences in the ability of different hospitals to comprehensively manage and treat ACS patients, which might have influenced the observed results. Additionally, there could be discrepancies in the Hcy detection ability in different hospitals.
5. Conclusions
This paper suggests that elevated serum Hcy level is independently associated with all-cause mortality in ACS patients regardless of hypertension. For these patients, Hcy levels should be monitored during in-hospital stays and follow-up to help with risk stratification and management decisions, and positive and individualized interventions should be performed if necessary.
The reference list from the paper itself. Each links out to its DOI / PubMed record.
- 1Toušek P Bauer D Neuberg M NováčkováM Mašek P Tu Ma P et al Patient characteristics, treatment strategy, outcomes, and hospital costs of acute coronary syndrome: 3 years of data from a large high-volume centre in Central Europe European Heart Journal Supplements 202224 B 3B 93537050210.1093/eurheartjsupp/suac 001PMC 8971736 · doi ↗ · pubmed ↗
- 2Qi LY Liu HX Cheng LC Luo Y Yang SQ Chen X et al Prognostic Value of the Leuko-Glycemic Index in Acute Myocardial Infarction Patients with or without Diabetes Diabetes, Metabolic Syndrome and Obesity 2022151725173610.2147/DMSO.S 356461 PMC 919183335706475 · doi ↗ · pubmed ↗
- 3Li JJ Liu HH Li S Landscape of cardiometabolic risk factors in Chinese population: a narrative review Cardiovascular Diabetology 2022211133572955510.1186/s 12933-022-01551-3PMC 9215083 · doi ↗ · pubmed ↗
- 4Mc Cully KS Homocysteine and the pathogenesis of atherosclerosis Expert Review of Clinical Pharmacology 201582112192565312510.1586/17512433.2015.1010516 · doi ↗ · pubmed ↗
- 5Zhu M Mao M Lou X Elevated homocysteine level and prognosis in patients with acute coronary syndrome: a meta-analysis Biomarkers 2019243093163082152210.1080/1354750 X.2019.1589577 · doi ↗ · pubmed ↗
- 6Calim A Turkoz FP Ozturkmen YA Mazi EE Cetin EG Demir N et al The Relation between Homocysteine Levels in Patients with Acute Coronary Syndrome and Grace Score Sisli Etfal Hastanesi Tip Bulteni 2020543463503331203410.14744/SEMB.2018.77864 PMC 7729712 · doi ↗ · pubmed ↗
- 7Zhang Z Xiao S Yang C Ye R Hu X Chen X Association of Elevated Plasma Homocysteine Level with Restenosis and Clinical Outcomes After Percutaneous Coronary Interventions: a Systemic Review and Meta-analysis Cardiovascular Drugs and Therapy 2019333533613077880710.1007/s 10557-019-06866-0 · doi ↗ · pubmed ↗
- 8Miao L Deng GX Yin RX Nie RJ Yang S Wang Y et al No causal effects of plasma homocysteine levels on the risk of coronary heart disease or acute myocardial infarction: A Mendelian randomization study European Journal of Preventive Cardiology 2021282272343383804210.1177/2047487319894679 · doi ↗ · pubmed ↗