Adaptation of the TIMBRE methodology for brownfields gully erosion analysis in urban areas
Caiubi Emanuel Souza Kuhn, Fábio Augusto Gomes Vieira Reis, Flávia Regina Pereira Santos, Christiane Zarfl, Peter Grathwohl, Victor Cabral

TL;DR
This study adapts the TIMBRE methodology to analyze gully erosion in urban areas, helping prioritize remediation efforts in Bauru, Brazil.
Contribution
The study adapts the TIMBRE methodology for gully erosion analysis in urban brownfields.
Findings
The inventory identified 175 gullies in 2004 and 189 in 2020, with a decrease in affected area due to some gully recovery.
Quinta da Bela Olinda was identified as the highest priority area for remediation due to its business potential, attractiveness, and environmental risk.
Abstract
Soil erosion is a concern in many parts of the world, causing environmental and social impacts. Aiming at obtaining indicators of the recovery of brownfields created by gullies in urban areas, this study adapts the Tailored Improvement of Brownfield Regeneration in Europe (TIMBRE) for the analysis and classification of areas affected by gullies in the city of Bauru, Brazil. The TIMBRE methodology assists in the decision-making of priority areas for remediation and their reinsertion in urban spaces. The inventory of areas affected by gullies was compiled based on the analysis of two image sets (2004 and 2020) available on Google Earth. For the classification of brownfields, three classes were considered: Class 1 - local potential for business development, Class 2 - attractiveness and marketing, and Class 3 – environmental risks. These results demonstrate a correlation between gullies and…
Genes, proteins, chemicals, diseases, species, mutations and cell lines named across the full text — each resolved to its canonical identifier and authoritative record.
Click any figure to enlarge with its caption.
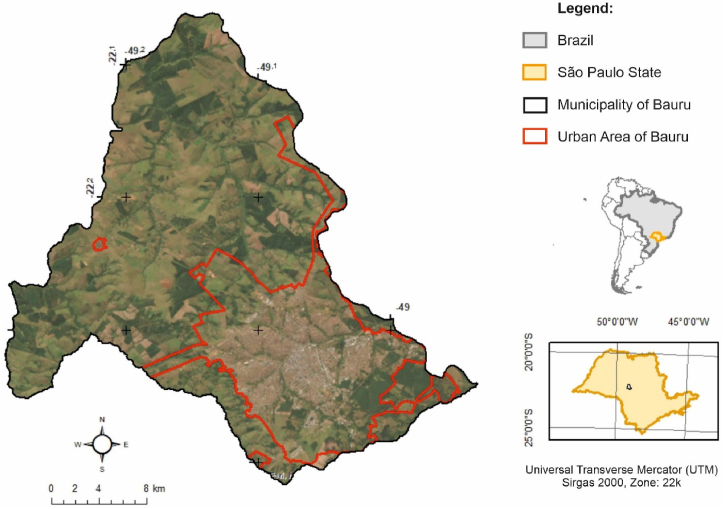 Figure 1
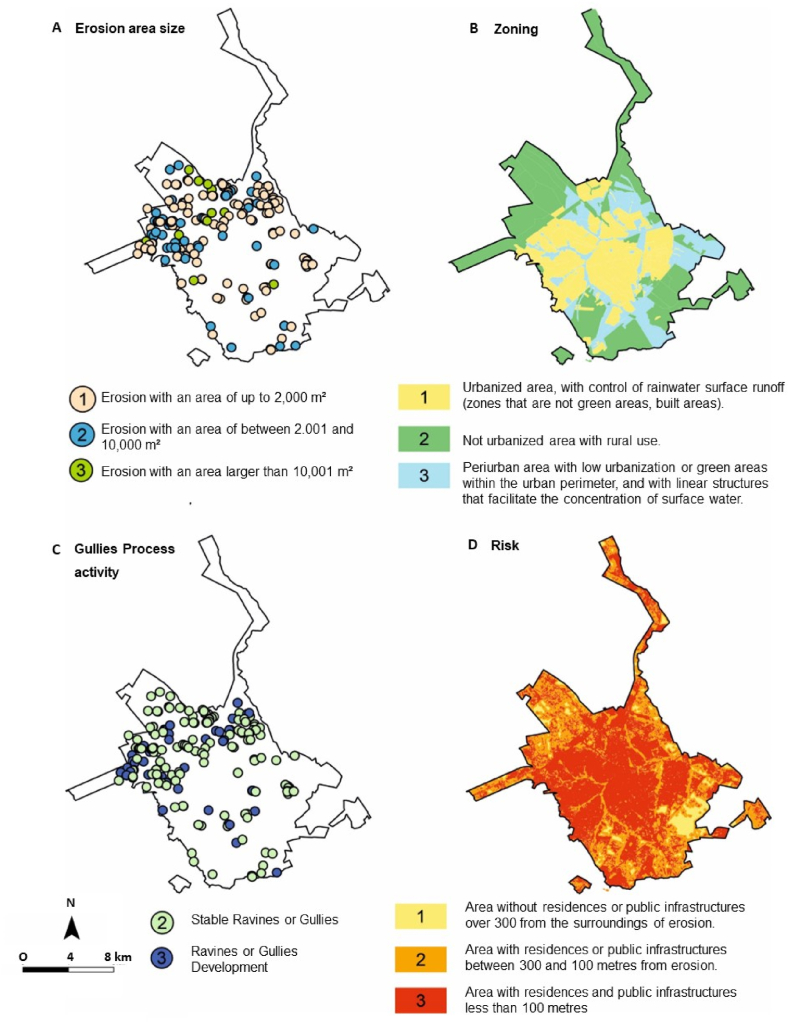 Figure 2
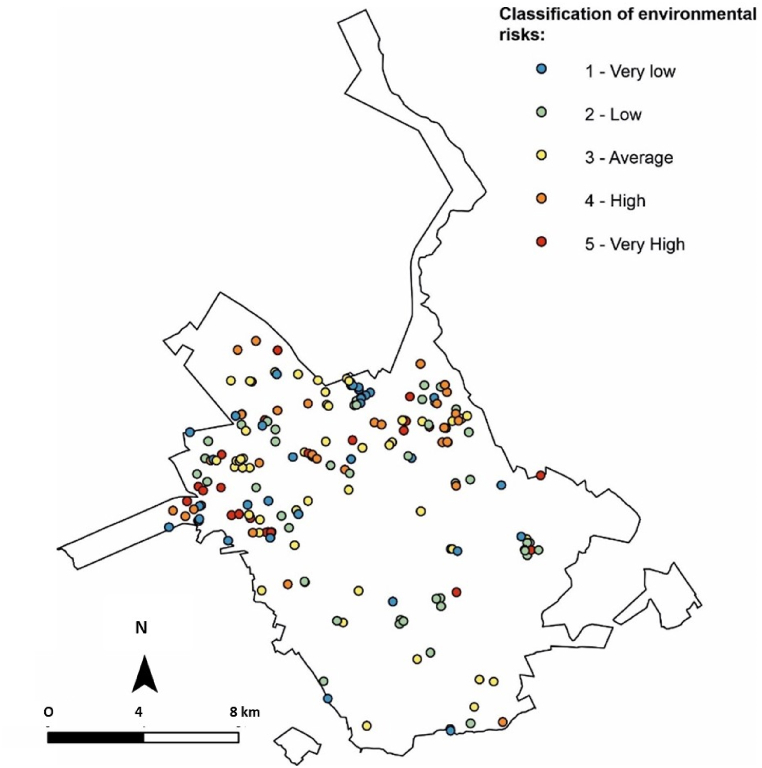 Figure 3
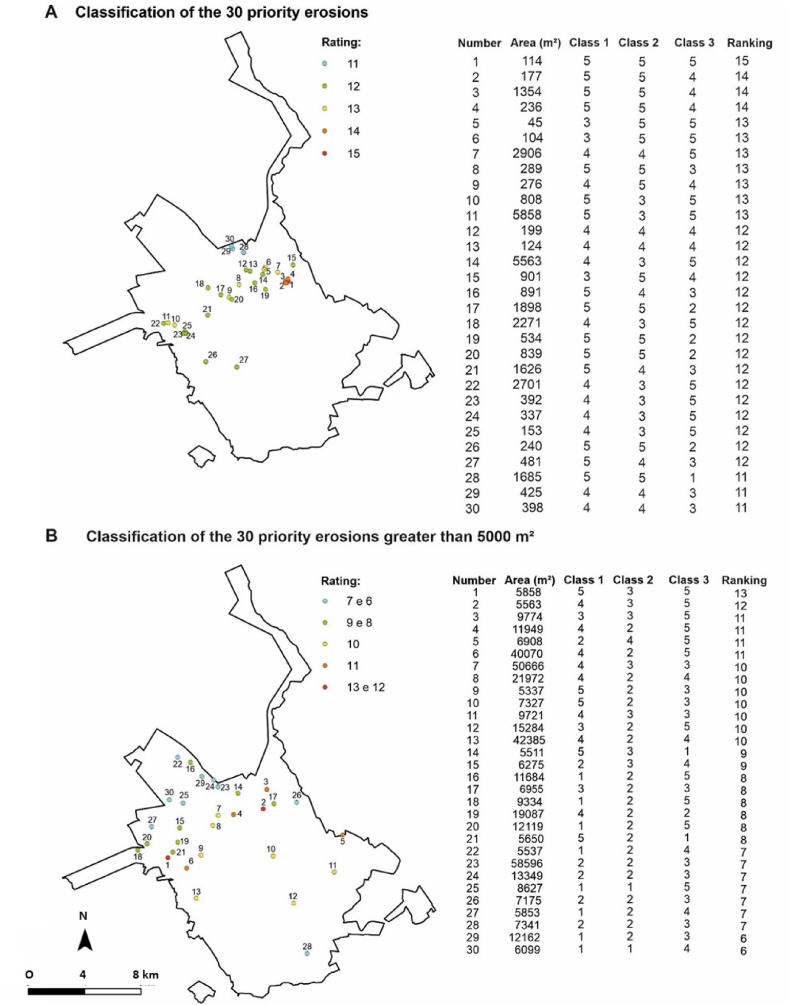 Figure 4
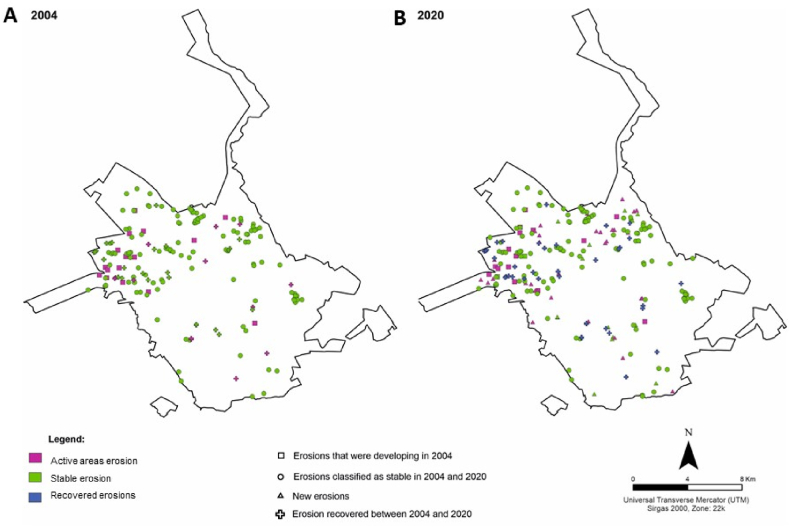 Figure 5
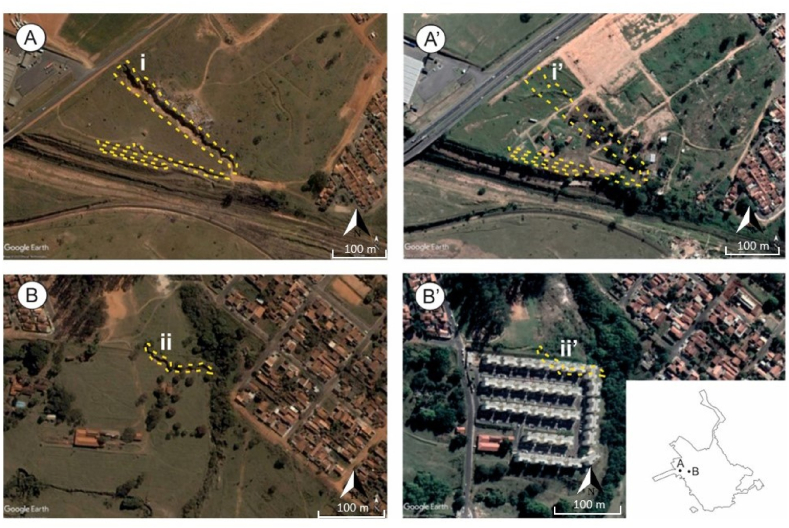 Figure 6
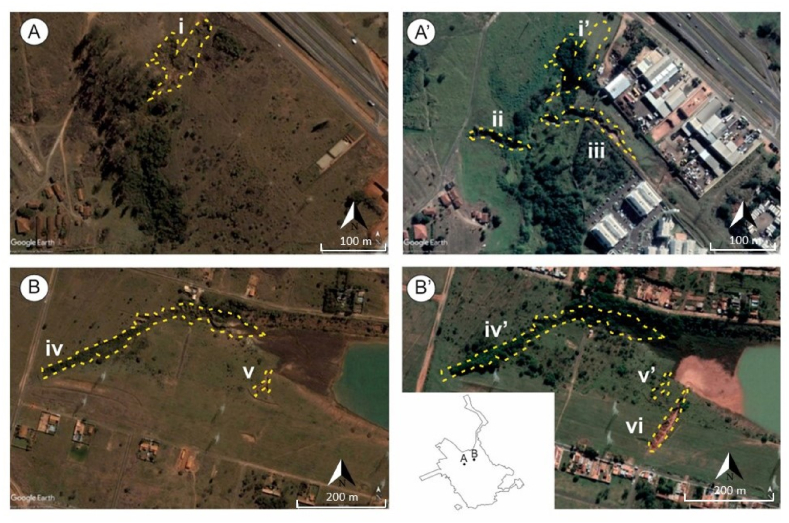 Figure 7
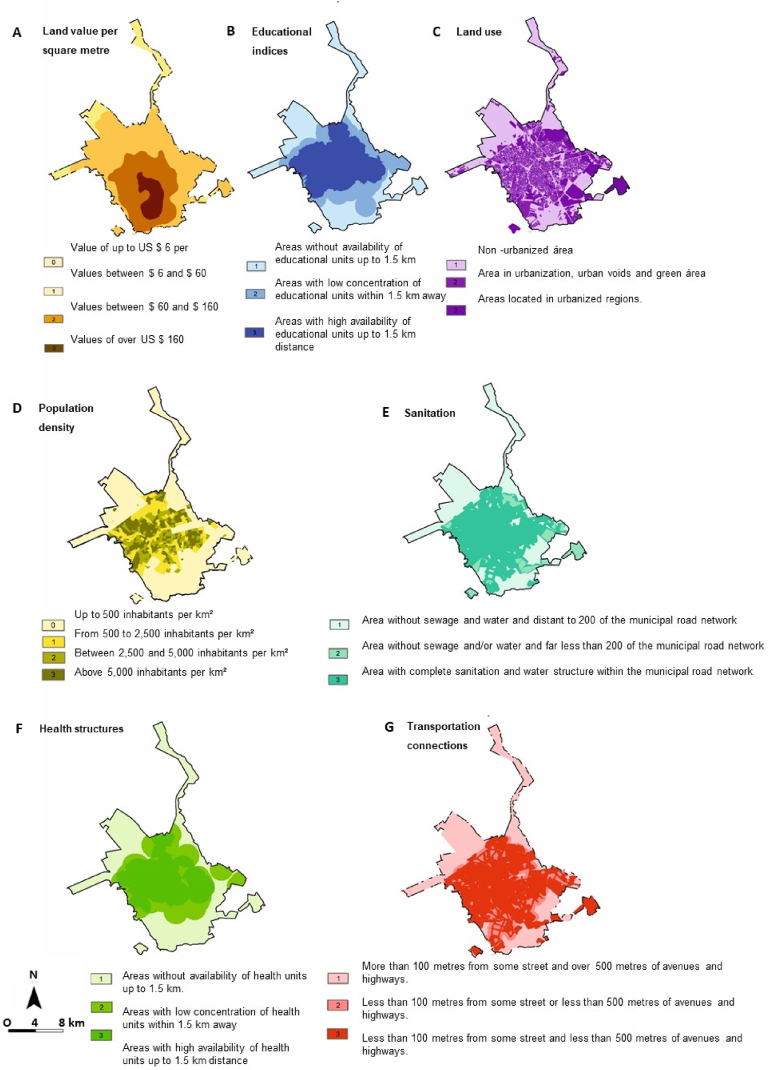 Figure 8
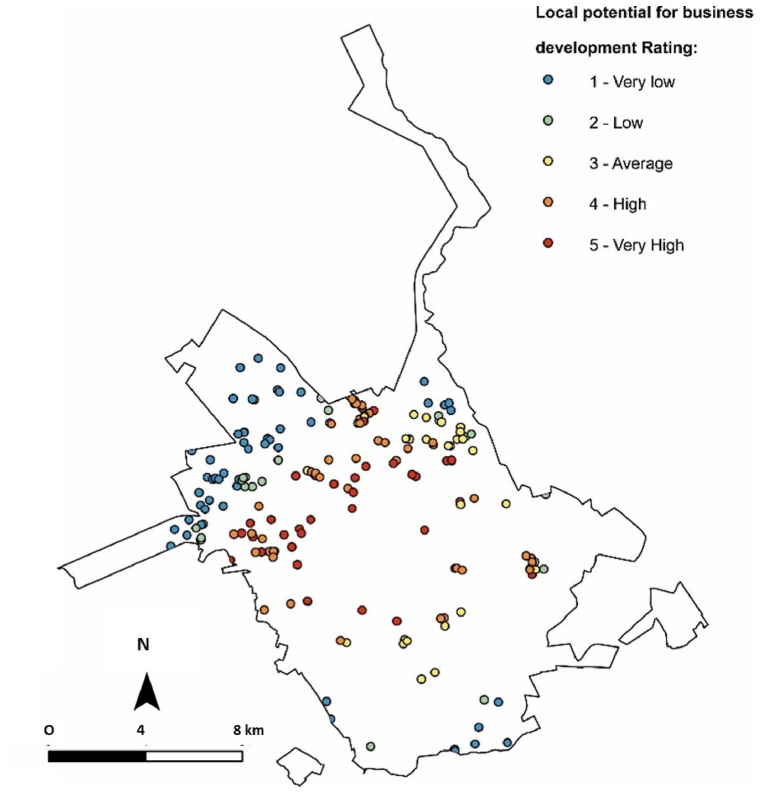 Figure 9
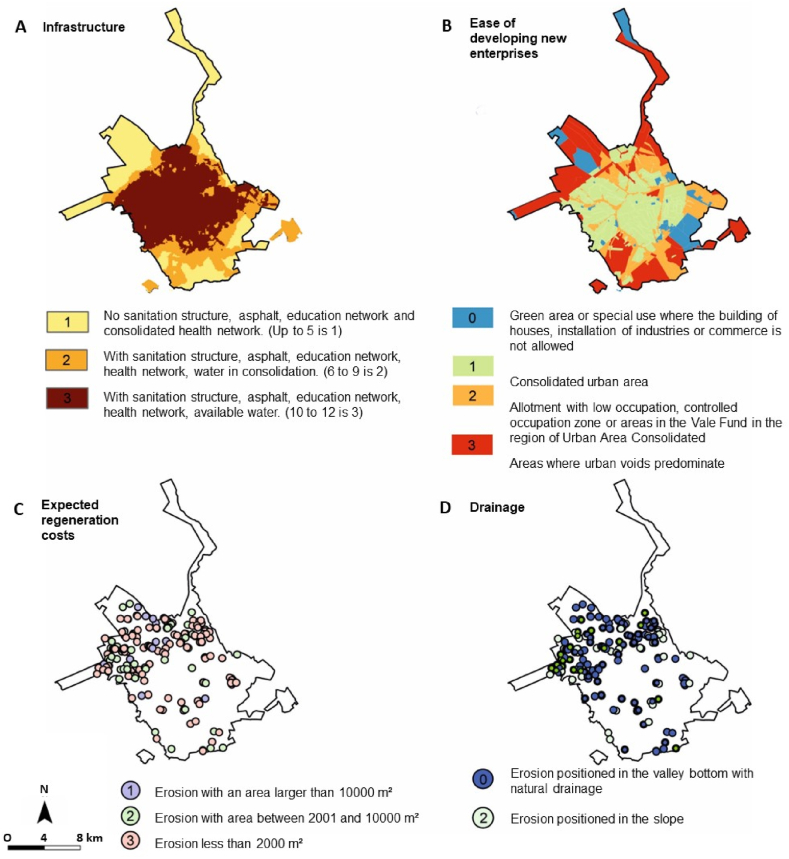 Figure 10
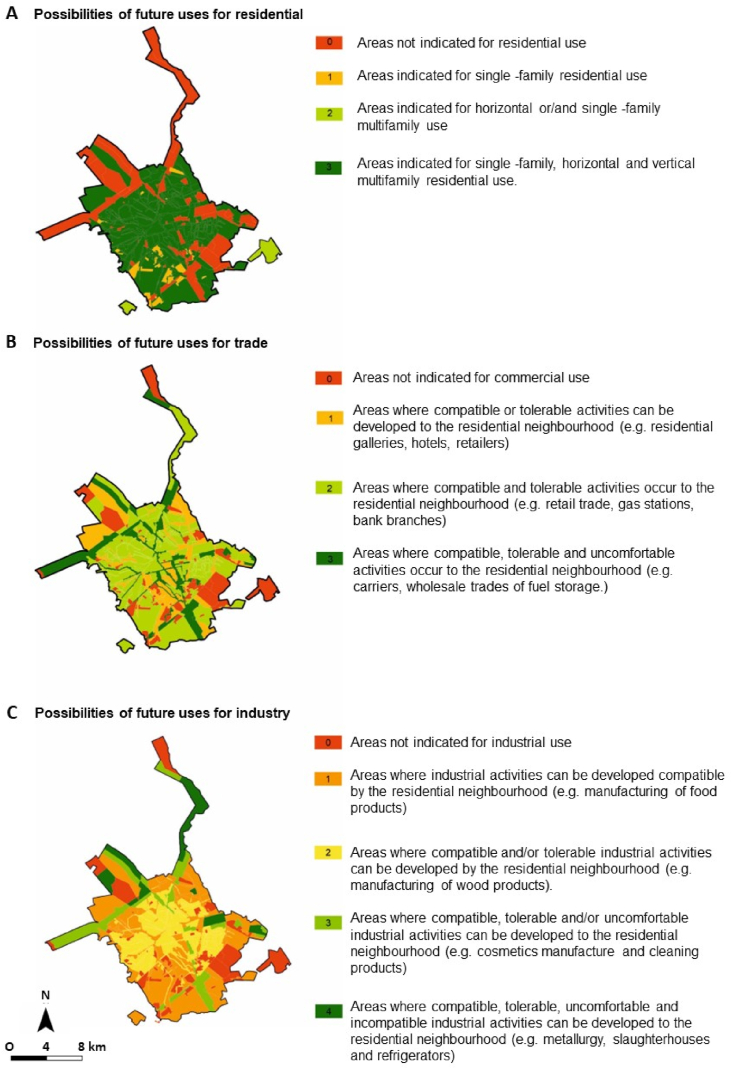 Figure 11
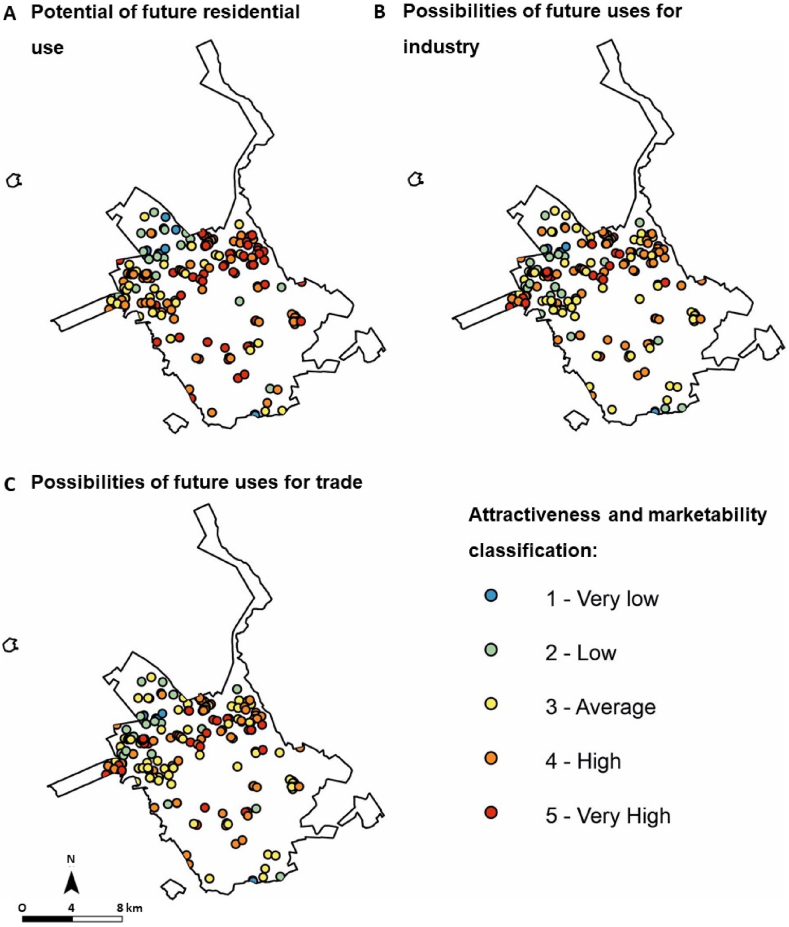 Figure 12
Peer Reviews
No public reviews on file for this paper yet. If you reviewed it on a platform where reviews are public (OpenReview, ICLR, NeurIPS, ICML), you can paste yours below so the community can read it here.
Videos
No videos yet. Explain this paper in a talk, walkthrough, or lecture? Add one.
Taxonomy
TopicsEnvironmental Justice and Health Disparities · Soil erosion and sediment transport · Geography and Environmental Studies
Introduction
1
Gully erosion is a global concern of soil deterioration; it limits land use, affects infrastructure and, in cities, it creates urban voids/brownfields [[1], [2], [3]]. The impact of gullies on economic and ecosystem services are most commonly registered in Brazil, India, China, the Democratic Republic of Congo, Ethiopia and the United States, but damage also occurs in countries such as Algeria, Argentina, Australia, Iran, Italy, Mexico, Nigeria, Polonia, Portugal, Romania, Russia, Slovakia, South Africa, Spain, Swaziland, Tanzania, Tunisia, Turkey, Ukraine and the United Kingdom [4].
Although studies that address the development of gullies in rural areas are common [[5], [6], [7]], only 3.1 % of published studies about gullies investigated gully erosion in urban areas [5]. Gullies are recorded in hundreds of cities in Brazil, in some cases causing significant damage to urban structures [8]. The issue of gullies in urban space was also the object of studies in Nigeria [9], in Kinshasa, and in the Democratic Republic of Congo [10], among other countries [2,3,5]. In addition to the impacts caused on urban structures, gullies affect significant areas, making the use of these urban spaces unfeasible. Areas affected by gullies can be restored, but if the necessary interventions are not enacted, they become urban voids [1,11].
Although factors such as relief, climate, extreme rainfall events, geology, and soil type can influence susceptibility to the development of gullies, there is a consensus in the literature that human action or extreme events are important triggers for their development [3,5,12,13]. Gully control results in various positive effects, such as on water flow regulation and biological diversity, and it reduces siltation and the risk of infrastructure damage [14].
In cities where there are hundreds of gullies, especially in developing countries, where financial resources are scarce [4,[9], [10], [11]], creating criteria to know which erosions should be prioritized for remediation and reinsertion of the area into the urban environment becomes a necessary action. This study presents contributions to ranking erosion to assist in decision making, using as a basis methods developed for brownfield analysis.
Gullies in urban spaces create problems in territorial and environmental management comparable to brownfields [11]. Brownfields [15] are "places that have been affected by previous uses of the surrounding place or land; they are abandoned or underused areas that are mainly in totally or partially developed urban spaces, requiring intervention to bring them back to beneficial use and may have real or perceived contamination problems”. The areas affected by gullies also had a previous use, and after the triggering event, the area is underused or abandoned, requiring intervention to remediate the area and, when possible, return it to beneficial use [4,8,11]. Brownfields are not necessarily contaminated areas, they can be considered areas with previous use, which have not been reintroduced for a new one [16,17]. Thus, in cities heavily affected by gullies [[8], [9], [10]], this process can be considered as a form of brownfield.
Brownfield rehabilitation is a topic that has attracted the attention of researchers in recent decades in countries such as the United States, England, Canada, Germany, China, Italy, Czech Republic, Spain and Australia [18]. Decision support tools are potentially effective for brownfield evaluation and for the development of strategies for remediation or management of affected areas [19].
Recovery of brownfields preserves the environment. or the so-called Greenfields, which provide important ecosystem services [20]. However, brownfield recovery requires significant resource allocation in terms of time and cost, which often exceeds the cost of greenfield development [21].
The Brownfield Prioritization Tool “TIMBRE” is a decision-supporting methodology created for Brownfields analysis considering the economic, social and environmental dimensions [21,22]. Brownfield analysis is performed in three steps [23]: 1) Inventory (mapping, problem identification and analysis), 2) Prioritization (assessment of redevelopment potential and environmental risks), and 3) Marketing (fundraising and investor search).
This work aims at applying a multiple criteria analysis based on the adaptation of the criteria of the Brownfield Prioritization Tool “TIMBRE”,for the analysis of areas affected by gullies. The city of Bauru in Brazil is selected as our test-site, due to the impacts that gullies have on urban structures. We hypothesize that the TIMBRE methodology allows quick responses to gully management.
Method
2
The TIMBRE methodology proposes different levels of decision hierarchies to analyse brownfields [23], which we adapted for the analysis of gully-affected areas. In the adaptation proposed, three stages are used: a) Inventory - in which the gullies are classified according to their activity level; b) Prioritization - three classes are used, based on the sum of the scores of the proposed parameters described in section 2.2; c) Marketing - where the results are integrated to identify and discuss priority areas for recovery. The urban perimeter of the city of Bauru was chosen for the case study (Fig. 1).Fig. 1. Location of the study area (red: urban perimeter of Bauru). (For interpretation of the references to colour in this figure legend, the reader is referred to the Web version of this article.)Fig. 1
Inventory
2.1
The inventory step includes the mapping, identification and analysis of gullies. The identification of gully scars was performed using images from Google Earth from 2004 to 2020, extracting the location and size of the area affected on the two dates analysed. The use of aerial images for gullies analysis is a common method in many studies [[24], [25], [26], [27]]. Gullies were classified into three classes: a) “recovered areas”, which represents areas that had their function in relation to land use recovered between 2004 and 2020 (e.g., they were filled with materials, aiming at the construction of houses, streets, urban parks, among others); b) “stable areas”, representing where no further evolution of gullies in the considered period was visible, such as areas with consolidated vegetation (trees or grass) that do not show signs of sediment removal (e.g., silted areas); and c) “unstable”, where gullies progressed visibly in satellite images (vegetation not consolidated and siltation occurred in channels or in downstream locations).
Prioritization
2.2
Prioritization was based on the analysis of land use and occupation according to Bauru's Master Plan [28]. Thematic maps were used to obtain information on urban infrastructure, population density, education and sanitation infrastructure, characteristics of soil use, transport structures, health services, development areas for new enterprises and proximity to watercourses. For development of the index of risks, gullies magnitude and activity, the results from the inventory stage were used. Land value was calculated based on the territorial taxes charged per square metre by the municipality [29]. The proximity of gullies to built areas was defined based on a map composition of spectral bands produced with the use of Landsat 8 orbital images extracted from the Portal of the National Institute for Space Research (INPE). The set of data used must be suitable for the municipal scale; i.e., to provide an analysis on the scale used by municipal managers to make decisions on urban planning.
The classification maps were created with arithmetic functions in geoprocessing software, so that the parameter scores could be established. The functions used were union, intersection and subtraction of polygons from the shapefiles of the Master Plan database provided by Bauru City Hall [29] or development of contour maps, created using the Inverse Distance Weighting interpolation method to establish the spatial variation of the value of the characteristic. The gullies were identified and georeferenced in a shapefile of points due to the adopted scale, which were classified by attributes, and later intersected with the areas of the municipality. The priority categories were defined as follows: 1) Class 1: “local potential for business development” comprising land value, population density, educational index, entrepreneurial activity, periphery and transportation connections (Table 1); 2) Class 2: “attractiveness and marketing potential” considering specific location, previous use, infrastructure, and expected regeneration costs (Table 2); and 3) Class 3: “environmental risks” accounting for gullies magnitude, activity (stable or dynamic) of the erosive process, location with respect to urban zonation and proximity to built areas (Table 3). The priority ranking was evaluated on a scale score from 0 to 4. Three Table 1, Table 2, Table 3 summarize the methods of the prioritization.Table 1. Classification of “Local potential for business development”.Table 1. ParameterMethod for calculationScoreDescriptionLand value per square metreland value per square metre provided by the municipality of Bauru0Properties located in rural or urban area with value of up to US 6.1 and 60.1 and 160.1 per square metre.Population densityHeatmap on housing density0Up to 500 inhabitants per km^2^1Between 501 and 2500 inhabitants per km^2^2Between 2501 and 5000 inhabitants per km^2^3Above 5001 inhabitants per km^2^Educational indicesDistance to an educational unit (schools and university)1Areas without availability of educational units within a radius of up to 1.5 km2Areas with one educational unit within a radius of 1.5 km3Areas with two or more educational units up to 1.5 km distanceSanitationDistance from road with networks of water and sewage collection1Area without sewage and water and more than 200 m away from the municipal road network2Area without sewage and/or water and far less than 200 m from the municipal road network3Area with complete sanitation and water structure within the municipal road networkLand useUse of the areas indicated in the Master Plan1Non-urbanized area2Area in urbanization, urban voids and green area3Areas located in urbanized regions.Transportation connectionsDistance from the main access roads1More than 100 m from some street and over 500 m from avenues and highways.2Less than 100 m from some street or less than 500 m of avenues and highways.3Less than 100 m from some street and less than 500 m from avenues and highways.Health structuresHeatmap considering the distance from health facilities1Areas without availability of health units within a radius of up to 1.5 km.2Areas with low concentration of health units within a radius of 1.5 km3Areas with high availability of health units within a 1.5 km-distance“Local potential for business development” was quantified by summing the scores attributed to each parameter (e.g., Land value per square metre + Population Density + Educational Indices + Sanitation + Land use + Transportation connections + Health Structure).Table 2. Attractiveness and marketing potential.Table 2. ParameterMethod for calculationScoreDescriptionInfrastructureCalculated according to the availability of paved roads, water and sewage network, distance from schools and health units1No sanitation structure, paved roads, education network and consolidated health network.2With sanitation structure, paved roads, education network, health network, water in consolidation.3With sanitation structure, paved roads, education network, health network, available water.Potential of future residential useCalculated as used in the Municipal Master Plan, considering the possibilities of use for homes.0Areas not indicated for residential use1Areas indicated for single -family residential use2Areas indicated for horizontal or/and single -family multifamily use3Areas indicated for single -family, horizontal and vertical multifamily residential use.Possibilities of future uses for tradeCalculated as used in the Municipal Master Plan, considering the possibilities of use for trade0Areas not indicated for trade use1Areas where compatible or tolerable activities can be developed in residential areas (e.g. residential galleries, hotels, retailers)2Areas where compatible and tolerable activities occur in residential areas (e.g. retail trade, gas stations, bank branches)3Areas where compatible, tolerable and uncomfortable activities occur in residential areas (e.g. carriers, wholesale trades of fuel storage.)Possibilities of future uses for industryCalculated as used in the Municipal Master Plan, considering the possibilities of use for the industry.0Areas not indicated for industrial use1Areas where industrial activities can be developed in accordance to residential areas (e.g. manufacturing of food products)2Areas where compatible and/or tolerable industrial activities can be developed by the residential area (e.g. manufacturing of wood products).3Areas where compatible, tolerable and/or uncomfortable industrial activities can be developed to the residential areas (e.g. cosmetics manufacture and cleaning products)4Areas where compatible, tolerable, uncomfortable and incompatible industrial activities can be developed to the residential areas (e.g. metallurgy, slaughterhouses and refrigerators)Expected regeneration costsCalculated according to the size of the area of each scar of gully.1Gully with an area larger than 10000 m^2^2Gully with area between 2001 and 10000 m^2^3Gully less than 2000 m^2^Ease of developing new enterprisesCalculated considering restrictions on use and the size of the surrounding areas. The larger the unused area the better the score, because the cost of giving recovery is more easily diluted in areas that can be used by large enterprises.0Green area or special use where the building of houses, installation of industries or commerce is not allowed1Consolidated urban area2Allotment with low occupation, controlled occupation zone or areas in river valleys located in consolidated Urban Area3Areas where urban voids predominateDrainageConsider whether Gully is in a natural drainage area. There are restrictions on Brazilian law for the development of enterprises in areas of drainage or source.0Gully positioned in the valley bottom with natural drainage2Gully positioned in the slope“Attractiveness and marketing potential” was quantified by summing up the scores attributed to parameter infrastructure, expected regeneration costs, ease of developing new ventures and drainage. The possibilities of future uses can be considered according to municipal planning (residence or commercial or induction).Table 3. Environmental risks.Table 3. ParameterMethod for calculationScoreDescriptionGully area sizeThe higher the size of the gully the higher the risk1Gully with an area of up to 2000 m^2^2Gully with an area Gully area size of between 2.001 and 10,000 m^2^3Gully with an area larger than 10,001 m^2^Erosive Process activityScore according to stability of the area of Gully.2Stable or Gullies3Gullies unstableZoningCalculated according to the proximity to urban infrastructure, being considered the highest grade for areas without structure and close to the urban perimeter.1Urbanized area, with control of rainwater surface runoff (zones that are not green areas, built areas).2Not urbanized area with rural use.3Periurban area with low urbanization or green areas within the urban perimeter, and with linear structures that facilitate the concentration of surface water.RiskCalculated according to the proximity of the gullies of built areas, based on the analysis of orbital image compositions.1Area without residences or public infrastructures over 301 from the surroundings of gully.2Area with residences or public infrastructures between 300 and 101 m from gully.3Area with residences and public infrastructures less than 100 m“Environmental risk” was quantified by summing up the scores attributed to the parameters (gully area size + Erosive Process Activity + Zoning + Risk), considering the sum of all assigned values.
Marketing
2.3
Marketing potential was assessed based on the integration of data from the previous steps, aiming at obtaining indications for future use, as well as identifying trends in relation to land use and occupation in the municipality of Bauru.
In the “attractiveness and marketing class”, the score used for final classification considered the infrastructure, expected recovery (or restauration) costs, connection to drainage and ease of developing new enterprises. The score regarding the possibilities of future, commercial, residential and industrial uses was not considered because each area of the city has specific restrictions for use, as indicated in the Municipal Master Plan for each neighbourhood in the municipality; in this way, only the sum of the other parameters was considered, they being: expected regeneration costs, ease of developing new enterprises, drainage, and infrastructure.
Results
3
Inventory
3.1
The inventory of gullies demonstrated that in 2004 (Fig. 2 A), 175 gullies existed in the urban area occupying an area of more than 64.1 ha. In 2020 (Fig. 2 B), the number of gullies had increased to 189, with an affected area of 62.5 ha (Table 4).Fig. 2. Gullies inventory in 2004 (A) and 2020 (B).Fig. 2. Table 4Number of gullies and affected area in 2004 and 2020. Stable areas, where no further evolution of gullies during the analysed time interval; and unstable where erosion progressed visibly in satellite images.Table 4. ClassificationGullies number and percentages of totalAffected area m^2^ percentages of totalGullies in 2004stable14582,9 %47242573,6 %unstable3017,1 %16904326,4 %Total in 2004175641468Gullies in 2020stable13973,5 %46640074,5 %unstable5026,5 %15952725,5 %Total in 2020189625927
Between 2004 and 2020, a total of 37 gullies were mitigated and reintroduced into urbanization with an area of 6.2 ha (Table 5). Most recovered gullies were already stable with vegetation inside the gully channel. However, the area affected by the 13 active gullies that were recovered represented approximately 2/3 of the recovering area (Fig. 3 A, B). Large areas affected by gullies were recovered during this period, generally for residential use or for the construction of urban infrastructure.Table 5. Areas where gullies were recovered between 2004 and 2020.Table 5. Gullies recovered between 2004 and 2020Number and percentagesAffected area m^2^ percentages of totalClassified as “stable” in 20042464.9 %2142034.1 %Classified as “unstable” 20041335.1 %4141065.9 %Total3762830Fig. 3(A) large gully (i) active in 2004; (A′) after remediation channel covered (i’) and reintroduction of the area in the urban environment; (B) gully channel (ii) connected to a watercourse in 2004; (B″) area with social use recovered in 2020, after remediation of the area affected by gullies and the construction of residential buildings (ii’).Fig. 3
Between 2004 and 2020, 51 new gullies (Fig. 4 A, B) were identified, most of which were already active in 2020. However, the number of new gullies is greater than the number of recovered gullies. The new gullies are smaller than the gullies that were recovered, which contributed to the reduction in the area affected by them. Most gullies that were not stabilized in 2004 showed changes in channel development in 2020. The gully-affected area in 2020 is lower than in 2004, but the number of existing gullies is higher (Table 6).Fig. 4. Some areas affected by new gullies between 2004 and 2020; (A) area with stable gully (i) in 2004; (A′) Gully channel development near residential condominium (iii) in 2020; (B) Quinta da Bela Olinda: area with two (iv and v) stable gullies in 2004; (B′) Quinta da Bela Olinda in 2020: area with two stable gullies (iv’ and v’) and a newly developed gully (vi).Fig. 4. Table 6Existing gullies in the study area in 2020.Table 6. ClassificationGully number and percentages of totalAffected area m^2^ percentages of totalGullies that emerged between 2004 and 2020stable168.5 %11,0771.8 %unstable3518.5 %33,2655.3 %Gullies classified as stable in 2004 and 202012164 %451,00572 %Situation in 2020 of gullies classified as under development in 2004stable21 %43180.7 %unstable158 %126,26220.2 %Total189625,927
Classification of priority gullies
3.2
Based on the analysis performed in the inventory, the existing gullies in 2020 were classified according to “local potential for business development”, “attractiveness and marketing”, and “environmental risks”.
Local potential for business development – Class 1
3.2.1
Seven parameters were analysed (Fig. 5 and Table 7). Regarding value per square metre, approximately 85 % of gullies occurred in areas with costs between 60 US dollars. At least 50 % of gullies are in areas with a population density of up to 500 people per hectare. In total, 54 % are in areas of urban expansion with still open spaces. Approximately 50 % of the areas with gullies are in regions close to educational institutions, and 59 % are in regions with a complete sanitation structure, 51 % have good transportation connections. The only parameter that did not obtain any parameter with values greater than 50 % was health structures, the classification showed a distribution of the values between the parameters. The overall classification of this criterion indicated that the areas with the highest scores are in urban expansion zones or in urban open spaces (Fig. 6).Fig. 5. Analysis of the proposed parameters and scores in the work methodology for “Local potential for business development” classification: (A) Land Value per Square Metro; (B) Educational indices; (C) Land use; (D) Population density; (E) Sanitation; (F) Health structure; and (G) Transportation connections. Prepared based on the Master Plan maps [28].Fig. 5. Table 7Relationship between identified gullies and parameters established in the methodology for “Local potential for business development” analysis.Table 7. ParameterScoreNumber of gulliesPercentageLand Value per Square Metro000.0 %116285.7 %23116.4 %363.2 %Population density09650.8 %16031.7 %22412.7 %394.8 %Educational indices13719.6 %25730.2 %39550.3 %Sanitation16735.4 %221.1 %311259.3 %Land use110354.5 %22111.1 %36534.4 %Transportation connections16634.9 %22513.2 %39851.9 %Health structure16132.3 %25629.6 %37238.1 %Fig. 6. Map indicating the ranking of gullies in relation to the “Local potential for business development”.Fig. 6
Attractiveness and marketing of the area affected by gullies – Class 2
3.2.2
The analysis of the attractiveness and marketing of areas affected by the gullies is shown in Fig. 7 and Table 8. Some parameters indicated a correlation greater than 50 % with areas affected by gullies.Fig. 7. Maps produced for analysis of the proposed parameters and scores in the work methodology for classification of attractiveness and marketing: (A) infrastructure; (B) ease of developing new enterprises; (C) expected regeneration costs; and (D) drainage. Prepared based on the Master Plan maps [28].Fig. 7. Table 8Relationship between identified gullies and parameters established in the methodology for attractiveness and marketing analysis.Table 8. ParametersScoreNumberPercentageInfrastructure14624.3 %24322.8 %310052.9 %Expected regeneration costs1126.3 %25328 %312465.6 %Ease of developing new enterprises0136.9 %13920.6 %27137.6 %36634.9 %Drainage010555.6 %28444.4 %Possibilities of future uses for residence04925.9 %110.5 %200 %313973.5 %Possibilities of future uses for trade0147.4 %17841.3 %25730.2 %34021.2 %Possibilities of future uses for industry0147.4 %111560.8 %22513.2 %32915.3 %463.2 %
Most gullies, 52 %, are in areas with good municipal urban structure. Approximately 65 % of gullies affect an area less than 2000 m^2^, and most gullies are in slope areas without contact with natural drainage. The ease of developing new ventures has not indicated any correlation.
Among the possible uses for the areas (Fig. 8), most of them, 73 %, can be used for different residential uses. Use for small business or industrial activities compatible with residential use is indicated in 41 % and 60 %, respectively. As three distinct analyses of use were applied, residential, commercial and industrial, three different rating were also generated (Fig. 9). The result indicates the three different classifications for the “attractiveness and marketing potential” class, according to the existing municipal master plan restrictions for residential, commercial or industrial use.Fig. 8. Map with the different possible uses, as indicated in the Municipal Master Plan for each region of the city, considering the (A) possibilities of future uses for residence; (B) possibilities of future uses for trade; and (C) possibilities of future uses for industry [28].Fig. 8. Fig. 9Map indicating the rating of gullies regarding “attractiveness and marketing potential” class, considering the possibilities of (A) residential, (B) industrial and (C) trade use.Fig. 9
Environmental risks - Class 3
3.2.3
Four parameters were analysed (Table 9 and Fig. 10). Environmental risk analyses considered the size of the area of gully; whether gully was active or still developing, urban zoning in relation to urbanized areas, areas with urban voids and nonurbanized areas and green areas, and, in the risk analysis, proximity to urban structures was considered.Table 9. Relationship between identified gullies and parameters established in the methodology for environmental risk analysis.Table 9. ParametersScoreNumberPercentageGullies area size112465.6 %25328 %3126.3 %Gullies Process activity213973.5 %35026.5 %Zoning13920.6 %27841.3 %37238.1 %Risk: Proximity with urban structures100 %29550.3 %39449.7 %Fig. 10. Maps produced for analysis of the proposed parameters and scores in the work methodology for environmental risk classification: (A) gullies area size; (B) zoning; (C) gullies process activity; and (D) risk: proximity with urban structures. Prepared based on the Master Plan maps [28].Fig. 10
Most gullies, 65 %, have an area of less than 2000 m^2^. The analysis indicates a correlation with gully activity, and 73 % of gullies are classified as stable. In the zoning class, there was no strong correlation with any of the classes. All gullies analysed are at least 300 m from some public or private infrastructure. Based on the criteria analysed, gullies were classified in relation to environmental risks (Fig. 11).Fig. 11. Map indicating the classification of gullies in relation to environmental risks.Fig. 11
Analysis of priority areas
3.3
The classification can be analysed individually for each of the 3 classes or analysed in an integrated way. Gullies that have a high rating considering the 3 classes, are cases where, if prioritized, they can at the same time reduce the risk and present economic gains if the area is reintroduced for urban use.
The 30 best classified gullies when adding the rating of the 3 classes analysed are concentrated mostly in urban expansions, northwest of the city (Fig. 12 A). The 7 gullies with the highest potential are concentrated in the Quinta da Bela Olinda region (Fig. 4C and D). The data indicate that this is the area with the highest development potential today and has gully with the highest risk of activities.Fig. 12. Considering the three classes considered: local potential for business development (Class 1); attractiveness and marketing potential (Class 2); and environmental risks (Class 3), the figure shows the classification of priority gullies: a) map with the 30 best classified gullies; B) map with the 30 gully larger than 5000 m^2^ better classified.Fig. 12
When considering the 30 best classified gullies with an area greater than 5000 m^2^ (Fig. 12 B), although there is still a larger concentration of gullies in the northwest sector of the city, well-classified gullies also occur in other sectors, indicating a greater dispersion of erosive processes.
Discussion
4
The inventory indicated an increase in the number of gullies between 2004 and 2020 from 175 to 189. The area directly affected by gully channels decreased from 64.1 ha to 62.5 ha. The contrast between the increased number of gullies and the reduced area is the result of the remediation of large channels among the 37 recovered gullies; most small gullies (51 new channels) emerged between 2004 and 2020, indicating that gullies will increase in number, but these gullies still have a smaller size. Although the reduction in the affected area is good news, the existence of a greater number of gullies may indicate a growth trend in the medium term.
Brownfields are found in urban centers and have potential land resources that can be important areas to reduce land scarcity [30]. Brownfield can be areas of old factories, buildings, railways, military areas, but there are also authors who consider mining areas, semi-urban areas and agricultural areas [31,32]. Gullies are generated by natural and anthropogenic factors [33], and in urban areas they are related to inadequate land use [4,8]. In other cities in Brazil and around the world, gullies also occupy significant areas and are a challenge for the development of cities, due to the creation of abandoned areas [4,8,[33], [34], [35]]. Gullies can therefore be classified as a form of Brownfield, as they are generated due to inadequate soil use, making the use of land in areas that could previously be occupied unfeasible, but in the same way as occurs with other Brownfields, if the necessary interventions, these areas can be reinserted for land use.
Although the area directly affected by gully channels is 62.5 ha, the surrounding area indirectly affected can easily be 10 times larger, as the gullies make the use of the surrounding area unfeasible. This demonstrates that gullies represent a problem with very significant dimensions. Reintroducing these spaces for urban use is crucial in city management. Although they are a significant challenge, the existence of large urban areas without occupation is also an opportunity, and the size of brownfields in hectares was a positive parameter for areas to be recovered [36]. The recovery of areas affected by gully also prevents new damage in the vicinity. The inventory indicated that the areas of urban expansion have the largest number of gullies, while in consolidated urban areas, new gullies in most cases are related to inadequate drainage structures.
Regarding the class “local potential for business development”, among the parameters, the strongest correlation was in relation to costs per square metre between 60, which was one of the lowest scores in the analysis. This indicates a relationship between the existence of gully and the low value of the property. However, this correlation can also indicate an opportunity. Low land prices increase attractiveness for potential investors [17]. However, the data also indicated that most areas affected by gully are in places close to educational institutions and with public sanitation and good transportation calls. Thus, the recovery of areas affected by gullies can be a good opportunity considering the existing public infrastructures in the surroundings. In the long run, the trend is that the areas affected by gullies that are not considered today for new enterprises become attractive due to their location in the city. Local potential analyses developed in this work can accelerate this process due to the creation of indicators that demonstrate the competitive differences of each area.
The class “attractiveness and marketing” showed that most gullies are positioned in places with good urban infrastructure and have a scar with an area of less than 2000 m^2^. According to Ref. [37], small gullies have not only lower costs for regeneration but also less technical complexity than large gullies. Regarding the ease of development of new enterprises, a strong correlation with any proposed class was not indicated. However, large urban voids may provide excellent opportunities for large enterprises, which helps to cover eventual remediation costs [36].
The analysis of attractiveness and marketing allows us to relate gullies to the possibilities provided for in the city's master plan. This is interesting to identify areas most suitable for specific use according to municipal standards. Residential use was the most suitable in 73 % of cases, but small industries and trades were also possible in 60 % and 41 % of areas, respectively. If enterprises seek the construction of large industries and trades, the map produced also allows an easy view of the areas possible to develop this activity.Low potential areas for these three uses (residential, industries and trades) can be used as green space or left as brownfield, which does not involve the construction of infrastructure [38]. Alternative uses may be connected to geotourism and education programs [39]. Municipal public policies and tax incentives can assist in more sustainable land use, allowing the best option to be taken for the urban community [17].
Risk analysis has indicated that all existing gullies in the area are at least 300 m from some public or private infrastructure. This indicates the need for monitoring all gullies, as in some cases, these gullies may have a rapid evolution, and if mediation measures are not performed, they can destroy infrastructures and even cause fatalities. Most gullies are less than 2000 m^2^ and classified as stable, so the reactivation of these channels or the rapid growth of smaller channels may occur when soil use and occupation change or extreme weather events occur.The three priority categories can be analysed separately according to the user's interest; for example, if the interest is to find areas with good local potential, only class 1 should be considered, but if the goal is to analyse or monitor the evolution of the gully risk, class 3 will indicate priority gullies that may cause significant economic or environmental damage.The final priority analysis indicated that the area of Quinta da Bela Olinda has better classified gullies, considering the sum of the three priority categories. This reinforces the analysis performed by Ref. [11], who estimated that approximately 80.7 ha in that region are affected due to the existence of gullies. The environmental and economic impacts calculated by the authors demonstrate that losses exceed $76.4 Million over the last few decades. The area was planned for residential use, but the development of gullies over the last three decades made it impossible to use the site. Reintegrating this area into the urban environment represents a good opportunity for municipal entrepreneurs and managers, but this requires creating marketing strategies to convince local actors. The creation of databases that bring together information on the techniques used to regenerate the areas, existing costs and monitoring measures applied may represent a risk reduction factor and improve agility in decision-making and application of resources more assertively.
The analysis carried out by applying the TIMBRE methodology allows us to visualize which areas affected by gullies have the greatest potential to return them to use. The classification can indicate among hundreds of gullies which of them are in areas with high potential for urban use. After the classification carried out by the methodology, it is necessary to carry out on-site analyses of the priority gullies. Geomorphology (slope, drainage basin size, strand shape), Geology (rock type, aquifer characteristics), soil (cohesion, permeability, erodibility, soil thickness) and other factors such as characteristic of vegetation and anthropogenic changes in land use, can be important conditions in the gullies analysis, to view details related to any technical difficulties existing in the area [[2], [3], [4],12,13].
The inventory demonstrated that several areas were reintroduced into the urban environment in the municipality of Bauru during the time interval analysed, thus indicating that the reintroduction of gully brownfields is possible. However, the creation of urban green areas in places affected by gullies is also an alternative. The TIMBRE methodology applied to gully classification can be an important ally for managers' decision-making.Although the data collected in this study provide important information on the areas with the highest potential, it is necessary to consult the population and local managers to build consensus and establish priorities for use for the affected areas. This will also depend on land ownership (public vs. private land).
To convince stakeholders, dialogue strategies must be developed [40]. identified five groups interested in brownfield regeneration: site owners, authorities, neighbours and others interested in the problems related to the area, service providers, and scientific community. These same authors propose a participatory methodology consisting of five phases, which involves (i) planning and preparatory work, (ii) mapping of stakeholders, (iii) development of activities such as workshops and lectures to foster engagement, (iv) application of a devolutionary questionnaire and (V) feedback for each of the stakeholders involved.
The establishment of a governance strategy through policies is another factor that can help in the regeneration of Brownfields, as the time required for complete implementation of a municipal or even project strategy may be longer than the period of managers' electoral mandates [41]. The classification presented here provides an important indicator for gully brownfield management, just as it is already done with other types of brownfield portfolios. To identify the variables that are most relevant for area recovery. The construction of databases assisting the analysis of territorial evolution can be an important metric to make decision-making increasingly assertive.
Application of this method to other places is possible provided it is adjusted to local data. The development of decision support systems (DSS) for gullies management in urban areas can help solve the complexity involved in the areas, as proposed for contaminated areas [42]. Tools also help identify and manage the specific opportunities and risks of each remediation project [43].
The methodology can also help other types of analysis, for example, for insurance companies to establish the prices for lands or buildings according to the risk scores. It can also help investors to define the risks that exist for investments in areas affected by gullies. Thus, the proposed method's main strength is the ability to visualize and classify many gullies in a wide area. However, this regional analysis is based on simplifications, which is a limitation of the work. Therefore, after choosing the priority gullies, it is necessary to detail the characteristics related to the physical and social environment of each of them.
Conclusions
5
This work demonstrated that the TIMBRE method can be successfully adapted for the analysis brownfields caused by gullies. This adaptation allows for an investigation of which are the priority areas for gully development, facilitating decision-making by managers, communities and investors in cities where this problem is relevant. The use of this type of analysis can help in the reintroduction of important idle spaces in cities in developing countries, where the disorderly growth of urban areas has favoured the creation of gully-derived brownfields.
The inventory performed by this work showed an increase in the number of gullies in the urban perimeter; however, the area affected by gully scars was reduced by approximately 2 ha. The recovery of areas affected by gully was mainly due to urban structure works and residential construction. Brownfields are concentrated in peripheral regions and in the urban growth zone. However, many of these areas have a good urban infrastructure and several services nearby. Creating pathways that facilitate reintroduction reduces the cost of development of new housing, industries or trade.
The adaptation of the gullies analysis methodology is a first step, but further research needs to be performed to create more complete databases that allow sharing knowledge between different cities and countries that have gully-derived brownfield problems. The construction of this type of database allows for an analysis of good practices or even the registration and study of unsuccessful cases.
CRediT authorship contribution statement
Caiubi Emanuel Souza Kuhn: Writing – original draft, Methodology, Formal analysis, Data curation, Conceptualization. Fábio Augusto Gomes Vieira Reis: Writing – review & editing, Conceptualization. Flávia Regina Pereira Santos: Writing – review & editing. Christiane Zarfl: Writing – review & editing. Peter Grathwohl: Writing – review & editing. Victor Cabral: Writing – review & editing.
Declaration of competing interest
The authors declare that they have no known competing financial interests or personal relationships that could have appeared to influence the work reported in this paper.
The reference list from the paper itself. Each links out to its DOI / PubMed record.
- 1Rotta C.M.S.Zuquette L.V.Erosion feature reclamation in urban areas: typical unsuccessful examples from Brazil Environ. Earth Sci.72201453555510.1007/s 12665-013-2974-y · doi ↗
- 2Pani P.Controlling gully erosion: an analysis of land reclamation processes in Chambal Valley, India Dev. Pract.26820161047105910.1080/09614524.2016.1228831 · doi ↗
- 3Dagar J.C.Ravines: formation, extent, classfication, evolution and measures of prevention and control Dagar J.C.Singh A.K.Ravine Lands: Greening for Livelihood and Environmental Security 201810.1007/978-981-10-8043-2_2 · doi ↗
- 4Kuhn C.E.S.Reis F.A.G.V.Zarfl C.Grathwohl P.Ravines and gullies, a review about impact valuation Nat. Hazards 202310.1007/s 11069-023-05874-6 · doi ↗
- 5Castillo C.Gomez J.A.A century of gully erosion research: urgency, complexity and study approaches Earth Sci. Rev.160201630031910.1016/j.earscirev.2016.07.009 · doi ↗
- 6Yang X.Dai W.Tang G.Li M.Deriving ephemeral gullies from VHR image in loess hilly areas through directional edge detection ISPRS Int. J. Geo-Inf.611201737110.3390/ijgi 6110371 · doi ↗
- 7Dai W.Hu Gh Yang X.Identifying ephemeral gullies from high-resolution images and DE Ms using flow-directional detection J. Mt. Sci.1720203024303810.1007/s 11629-020-6084-5 · doi ↗
- 8Kuhn C.E.S.Reis F.A.G.V.Lazaretti A.F.Zarfl C.Grathwohl P.The record and trends of natural disasters caused by gullies in Brazil Environ. Earth Sci.82202352410.1007/s 12665-023-11213-6 · doi ↗