Differentially expressed heterogeneous overdispersion genes testing for count data
Yubai Yuan, Qi Xu, Agaz Wani, Jan Dahrendorff, Chengqi Wang, Arlina Shen, Janelle Donglasan, Sarah Burgan, Zachary Graham, Monica Uddin, Derek Wildman, Annie Qu

TL;DR
This paper introduces a new method for identifying differentially expressed genes in RNA-seq data that improves detection power when sample sizes are small.
Contribution
The novel DEHOGT method uses heterogeneous overdispersion modeling to better detect differentially expressed genes in RNA-seq data.
Findings
DEHOGT outperforms DESeq2 and EdgeR in detecting differentially expressed genes in synthetic RNA-seq data.
DEHOGT detects more differentially expressed genes in microglial cells under stress hormone treatments.
The method enhances detection power when the number of replicates is limited but the number of conditions is large.
Abstract
The mRNA-seq data analysis is a powerful technology for inferring information from biological systems of interest. Specifically, the sequenced RNA fragments are aligned with genomic reference sequences, and we count the number of sequence fragments corresponding to each gene for each condition. A gene is identified as differentially expressed (DE) if the difference in its count numbers between conditions is statistically significant. Several statistical analysis methods have been developed to detect DE genes based on RNA-seq data. However, the existing methods could suffer decreasing power to identify DE genes arising from overdispersion and limited sample size, where overdispersion refers to the empirical phenomenon that the variance of read counts is larger than the mean of read counts. We propose a new differential expression analysis procedure: heterogeneous overdispersion genes…
Genes, proteins, chemicals, diseases, species, mutations and cell lines named across the full text — each resolved to its canonical identifier and authoritative record.
Click any figure to enlarge with its caption.
 Figure 1
 Figure 2
 Figure 3
 Figure 4
 Figure 5
 Figure 6
 Figure 7
 Figure 8
 Figure 9
 Figure 10
 Figure 11
 Figure 12
 Figure 13
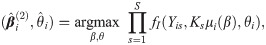 Figure 14
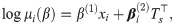 Figure 15
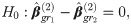 Figure 16
 Figure 17
 Figure 18
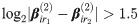 Figure 19
 Figure 20
 Figure 21
 Figure 22
 Figure 23
 Figure 24
 Figure 25
 Figure 26
 Figure 27
 Figure 28
 Figure 29
 Figure 30
 Figure 31
 Figure 32
 Figure 33
 Figure 34
 Figure 35
 Figure 36
 Figure 37
 Figure 38
 Figure 39
 Figure 40
 Figure 41
 Figure 42
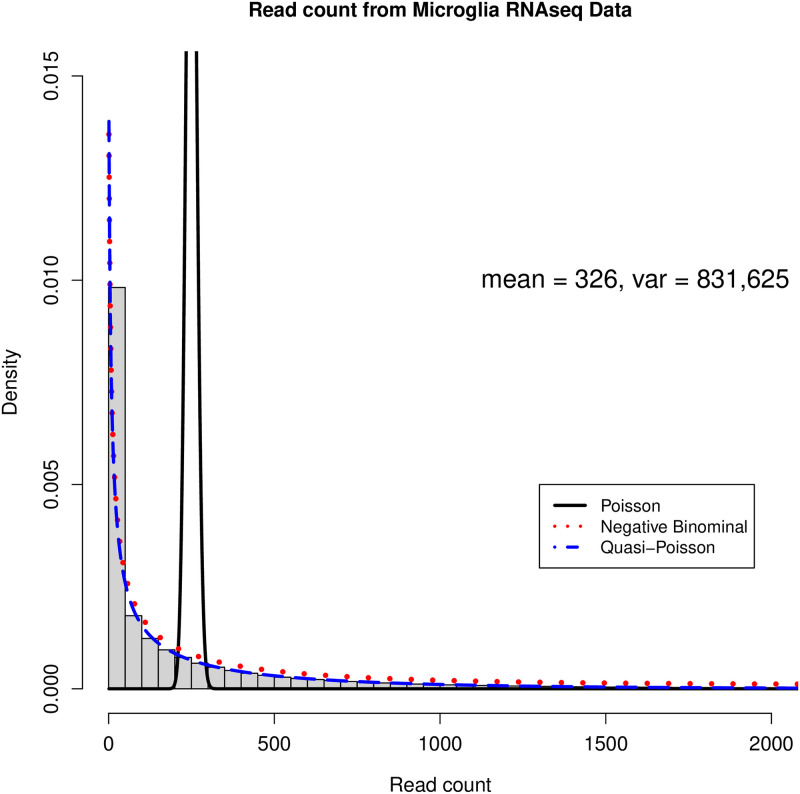 Figure 43
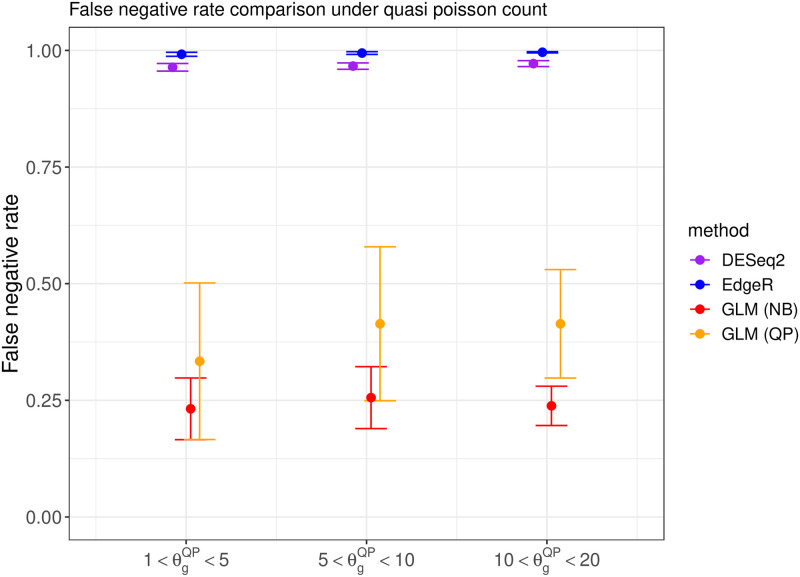 Figure 44
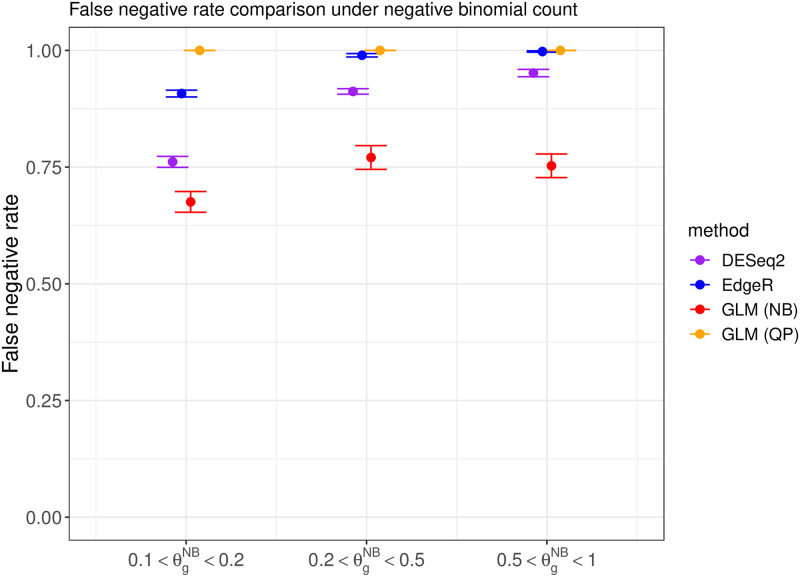 Figure 45
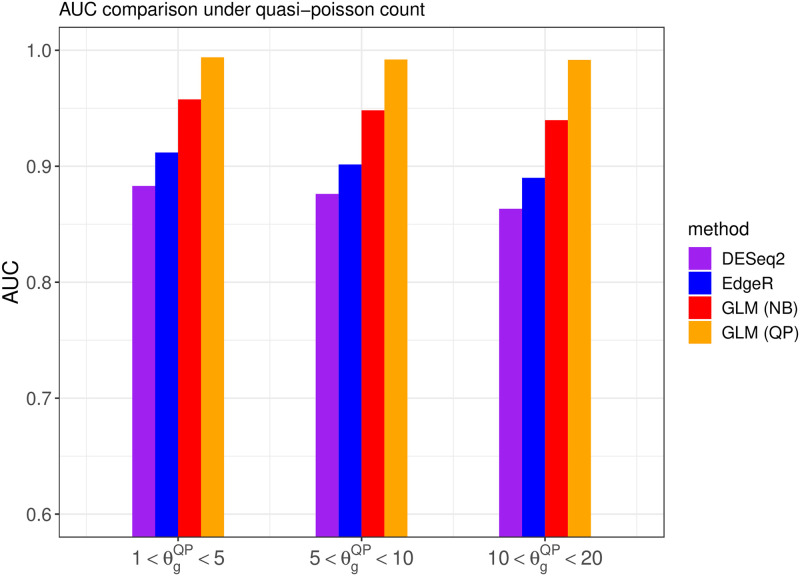 Figure 46
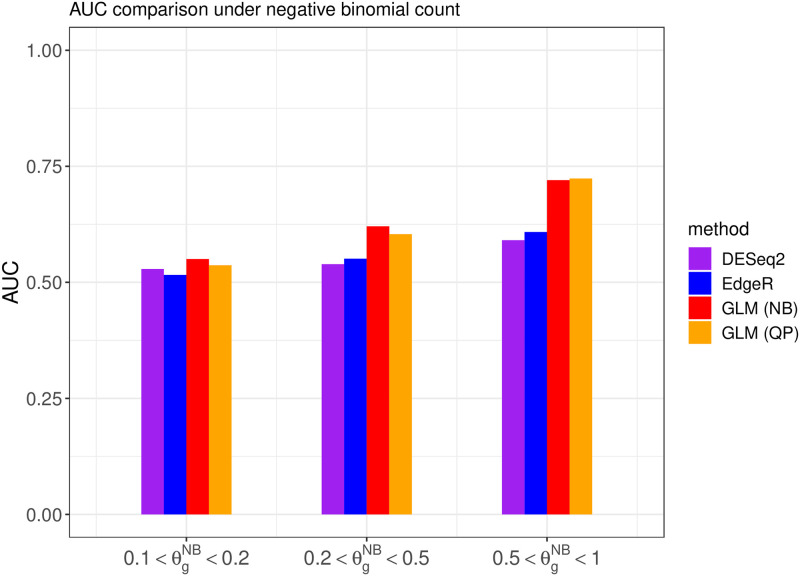 Figure 47
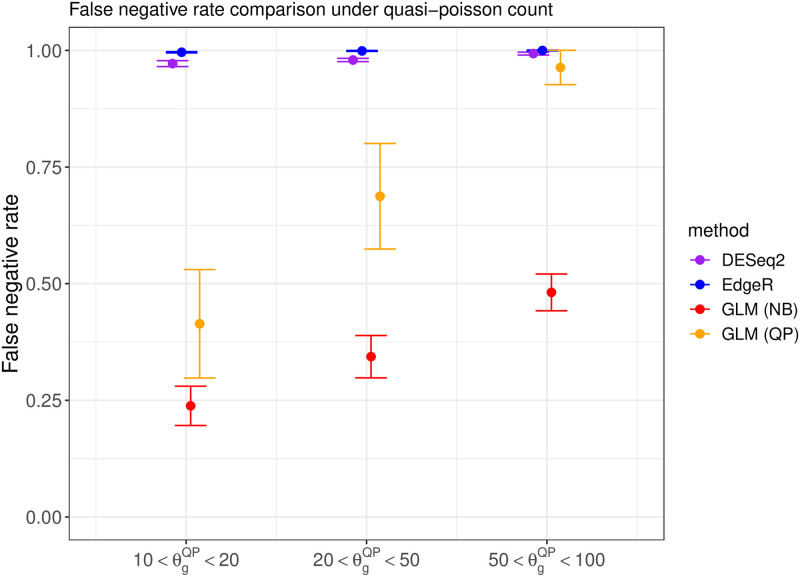 Figure 48
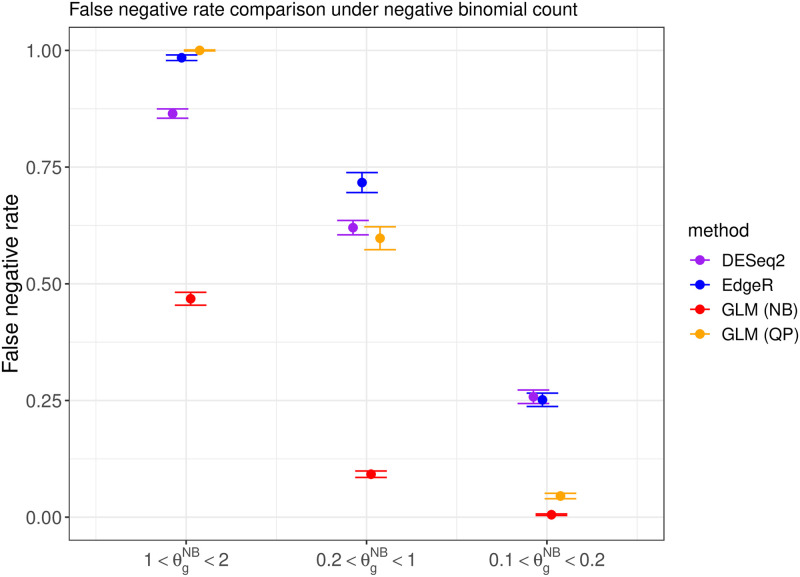 Figure 49
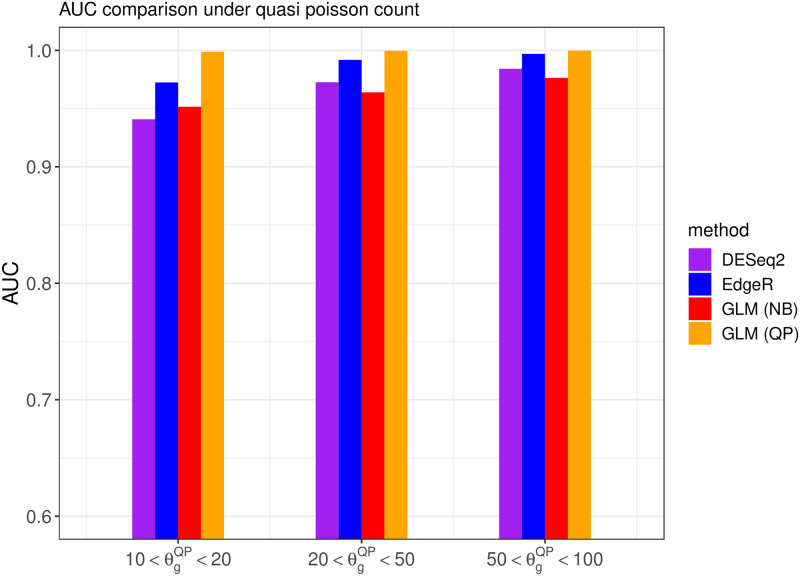 Figure 50
Peer Reviews
No public reviews on file for this paper yet. If you reviewed it on a platform where reviews are public (OpenReview, ICLR, NeurIPS, ICML), you can paste yours below so the community can read it here.
Videos
No videos yet. Explain this paper in a talk, walkthrough, or lecture? Add one.
Taxonomy
TopicsMetabolomics and Mass Spectrometry Studies · Statistical Methods and Inference · Cancer-related molecular mechanisms research