USAF Characteristic K Approach: A Robust Tool for Predicting Fatigue Crack Growth under Various Underload Spectra
Kushagra Tiwari, Alankar Alankar, R. K. Singh Raman, Rhys Jones

TL;DR
This paper shows that a specific fracture mechanics method can accurately predict how small cracks grow in aluminum alloy under various loads.
Contribution
The paper is the first to demonstrate the effectiveness of the USAF Characteristic K method with the Hartman–Schijve equation for predicting small crack growth under underload spectra.
Findings
The USAF Characteristic K method combined with the Hartman–Schijve equation accurately predicts small crack growth in aluminum alloy AA7050-T7451.
Published crack growth curves for five underload spectra show good agreement with predictions.
This approach is effective for evaluating component durability under limited life conditions.
Abstract
This paper forms part of an ongoing investigation into the tools required in linear elastic fracture mechanics (LEFM) for evaluating the durability of components designed for limited life replacement. In this study, we demonstrate that the USAF ‘Characteristic K’ method, when combined with the Hartman–Schijve adaptation of the NASGRO crack growth formula, can predict the impact of underloads on the propagation of small cracks in aluminum alloy AA7050-T7451 with reasonable accuracy. The published da/dN versus ΔK small crack growth curves associated with five specific underload spectra are examined. It is found that, in each case, there is reasonably good agreement between the predicted and the measured curves. To the best of the author’s knowledge, this paper is the first to highlight the ability of the USAF Characteristic K approach, when coupled with the Hartman–Schijve equation, to…
Genes, proteins, chemicals, diseases, species, mutations and cell lines named across the full text — each resolved to its canonical identifier and authoritative record.
Click any figure to enlarge with its caption.
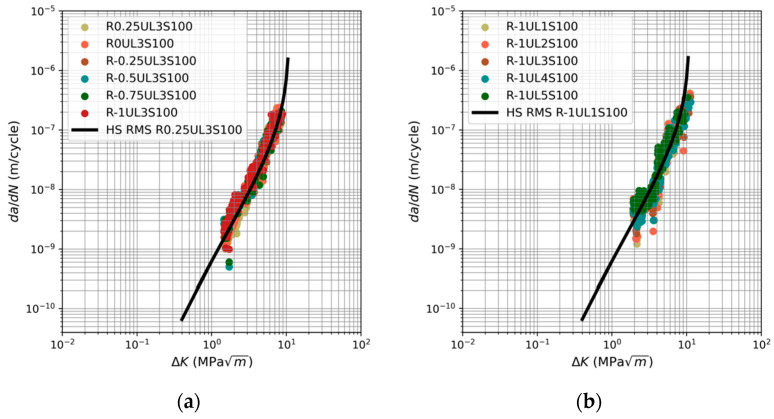 Figure 1
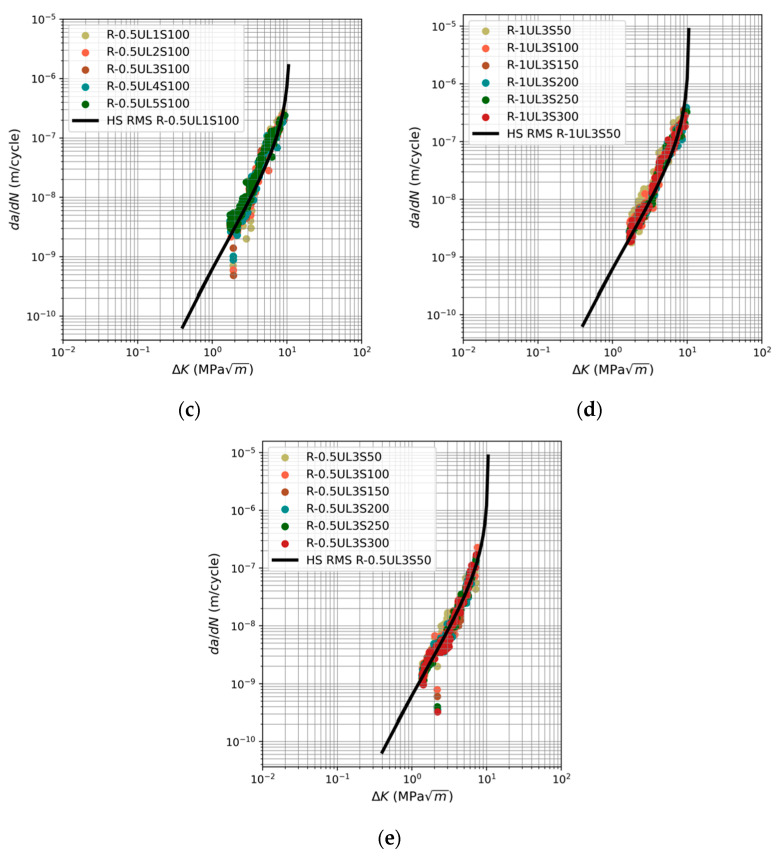 Figure 2
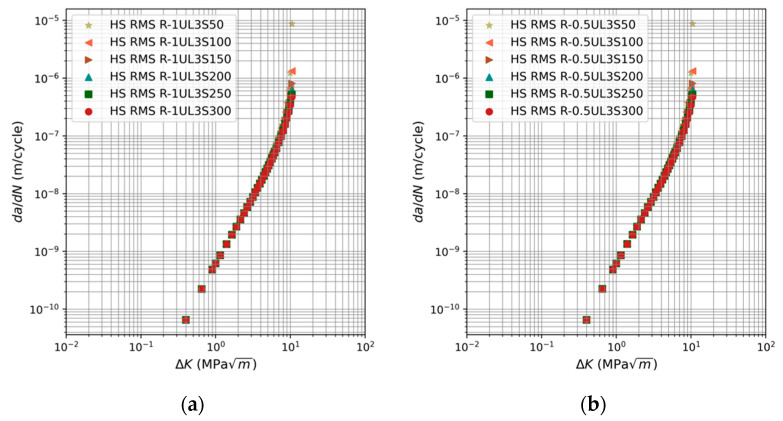 Figure 3
 Figure 4
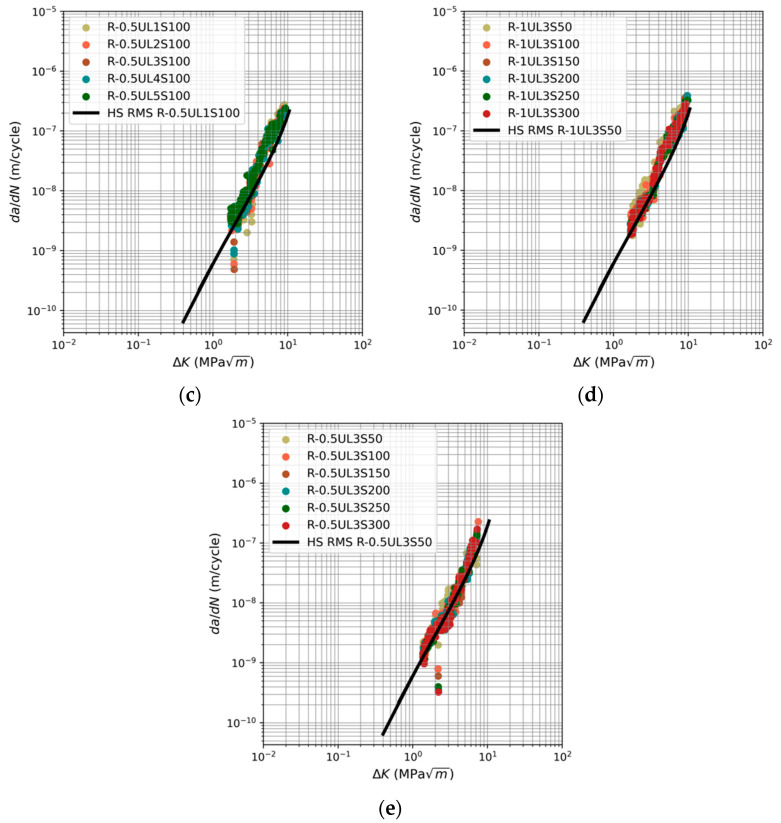 Figure 5
- —US Army International Technology Center, Indo-Pacific (ITC–IPAC), Tokyo
Peer Reviews
No public reviews on file for this paper yet. If you reviewed it on a platform where reviews are public (OpenReview, ICLR, NeurIPS, ICML), you can paste yours below so the community can read it here.
Videos
No videos yet. Explain this paper in a talk, walkthrough, or lecture? Add one.
Taxonomy
TopicsFatigue and fracture mechanics · Probabilistic and Robust Engineering Design · Non-Destructive Testing Techniques
1. Introduction
The 2019 memo [1] mandated the implementation of additive manufacturing (AM) practices across the United States Department of Defense (DoD). US Army Directive 2019-29 [2] highlighted the transformative potential of additive manufacturing in battlefield logistics by enabling the immediate fabrication of parts close to where they are needed. USAF Structures Bulletin EZ-19-01 [3] identified one of the primary obstacles in the airworthiness certification of AM components as “accurate prediction of structural performance”, particularly in terms of DADT (durability and damage tolerance). An important feature of AM is that, as outlined in [1,2,3,4], it enables the production of structural components on demand. Although these components may have a shorter lifespan than originally designed, they are adequate to maintain operational capabilities until a traditionally manufactured replacement is available. However, according to Structures Bulletin EZ-19-01 and MIL-STD-1530Dc [5], evaluating the airworthiness of a part with limited life necessitates a durability analysis. By this, it is meant that an accurate prediction of the growth of small naturally occurring cracks is required [6,7,8] (Here the terminology “small crack” is as defined in the ASTM fatigue test standard ASTM E647-13a [9]). Consequently, one challenge facing the airworthiness certification of AM parts is the development and validation of analysis tools capable of predicting the durability of AM parts. The same challenge is faced for the airworthiness certification of cold spray repairs, alternatively referred to as supersonic particle deposition or SPD repairs and which involves repair using an additive metal deposition process, to military aircraft [10,11,12,13].
Within this framework, it is important to acknowledge the requirements set forth in MIL-STD-1530Dc [5] and noted in the US Joint Services Structural Guidelines [14], that the analyses should follow a building block approach. Furthermore, as delineated in the NASA Fracture Control Handbook NASA-HDBK-5010 [15], given the variability which can be associated with the da/dN versus ΔK curves (hereinafter referred to as ‘fatigue curves’) associated with both long and small cracks in both conventionally and additively manufactured materials [6,8,16,17,18,19], NASA-Handbook-5010 mandates that the certification analysis should use an upper bound (worst case) crack growth curve.
In this scenario, it is pertinent to highlight that, as shown in [20,21,22,23,24], underloads in a fatigue spectrum can accelerate the growth of long cracks. (Underloads are characterized as loading cycles where the minimum stress is considerably lower than that seen in the neighboring cycles.) Hence, to be consistent with the mandated building block approach to certification of limited life parts, it is important to be able to account for the effect of underloads on the growth of small naturally occurring cracks.
At this point in the discussion, it is important to acknowledge that the USAF Damage Tolerance Design Handbook [25,26] outlines this from a design perspective, and the growth of cracks in operational aircraft can often be determined by approximating the flight load spectra as a series of repeating constant amplitude load blocks. We will term this approach the USAF ‘Characteristic K’ approach. Examples of the use of various variants of the Characteristic K approach can be found in [6,7,17,27,28,29,30,31].
Consequently, it is noted that:
- USAF MIL-STD-1530Dc stipulates that the airworthiness certification of military aircraft necessitates a durability analysis. This analysis should follow a building block approach, where the equation describing crack growth under constant amplitude loads must demonstrate its capability to handle more intricate, real-world load spectra;
- Refs. [6,7,17,28,29] indicate that methods based on the Characteristic K approach may be appropriate for sustainment-related analyses;
- Refs. [6,7,8,17,18,32,33,34,35,36,37,38,39,40,41] show that the Hartman–Schijve equation for crack growth is frequently applicable for forecasting the durability of materials manufactured both conventionally and through AM processes;
- Refs. [12,17] demonstrates that the Hartman–Schijve equation for crack growth is often effective in estimating the durability of cold spray repairs, addressing both simulated corrosion damage and intergranular corrosion around fastener holes;
- Refs. [42,43] indicate that the Hartman–Schijve equation for crack growth is frequently applicable for modeling the durability of parts produced via cold spray additive manufacturing;
- While the 2014 review paper [7] notes, that several crack growth equations are typically employed for assessing the damage tolerance of conventionally manufactured metals, their effectiveness in accurately forecasting the growth of small, naturally occurring cracks in AM components and cold spray repairs has not yet been confirmed.
This paper primarily aims to investigate if the USAF Characteristic K approach, when used in conjunction with the Hartman–Schijve variant of the NASGRO crack growth equation [7], can be used to predict the da/dN versus ΔK small crack growth curves associated with AA7050-T7451 alloy specimens subjected to the different underload spectra that were studied in [44]. These test cases were chosen since the aluminium alloy AA7050-T7451 is widely used in the Boeing F/A-18E/F Super Hornet, the Boeing EA-G Growler, and in the Lockheed Martin F-35 Lightning II. The outcome of this investigation is that it is found that the fatigue curves seen in the various underload tests reported in [44] can be reasonably well predicted using the USAF Characteristic K approach. Here it is worth mentioning that, as far as the authors are aware, there has been no prior study establishing the ability of the Characteristic K approach to reasonably accurately predict the growth of small cracks under various underload spectra.
2. The USAF Characteristic K Approach
The USAF Damage Tolerant Design Handbook [25,26] explains that the damage tolerance analysis of many real-world engineering problems that involve complex variable amplitude load spectra can be simplified by expressing the load spectra as a sequence of recurring constant amplitude load blocks. In such instances, [25,26] suggest that crack growth can be computed using an equation of the form
Here, da/dB represents the increase in length of the crack with each load block (B), with m and D being constants. K_char_ denotes a characteristic stress intensity factor value that is associated with the load block, and is given as
Here σ_char_ is the corresponding characteristic stress in the load block and β is the beta (geometry) factor associated with the problem being analyzed. Two of the most commonly used forms for the characteristic stresses are the maximum stress (σ_max_) and the root mean square (RMS) stress (σ_rms_) in the block [7,17,25,28]).
The version of the characteristic K variant of the Hartman–Schijve crack growth equation presented in [7] is:
In this context, K_max_ represents the peak value of the stress intensity factor within a specified load block, i.e.,
where σ_max_ denotes the highest stress within the load block, ΔK_char_,thr acts as a term akin to a fatigue threshold, and A represents the cyclic fracture toughness. Setting ΔK_char_ = ΔK_rms_, where
Equation (3) reduces to
where ΔK_rms_,thr is the corresponding fatigue threshold. As per [17], it is convenient to introduce term f_rms_ to relate ΔK_rms_ to K_max_, i.e.,
The term f_rms_ is calculated as
where N_i_ and R_i_ denote the number of cycles and the corresponding R ratio of the ith load block, respectively, and n represents the total number of load blocks. As outlined in [7,8,12,17,36,39,40,41], when using this formulation to predict the worst-case (fastest) crack growth curve associated with the growth of small cracks, the threshold term ΔK_rms_,thr, or the term ΔK_thr_ depending on if the Characteristic K approach is or is not used, should be set to a small value, typically in the range 0.1 to 0.3 MPa √m. (The fastest growing cracks in an airframe are commonly referred to as “lead cracks” [6,16,45,46]). Whilst, as noted above, this formulation has been used to accurately compute the growth of small cracks subject to a range of variable amplitude spectra, its applicability to spectra having underloads has not yet, to the best of the author’s knowledge, been studied.
Consequently, the ensuing question emerges: Can this equation (Equation (6)) be used for predicting crack growth from small naturally occurring cracks subjected to different underload spectra? This question will be addressed in the next section.
3. Fatigue Crack Growth under a Range of Underload Spectra
Field et al. [44] examined the impact of underload on small three-dimensional surface breaking cracks, with depths of approximately 0.1 mm, in 7050-T7451. The effect of underload magnitude, spacing and consecutive application on crack growth is discussed in detail. In the study by Field et al. [44], a total of six different loading spectra were studied. Each spectrum consisted of a number of load blocks. The nomenclature used by Field et al. [44] to describe each of these various spectra and the load blocks that made up each spectrum, followed the format Ry_1_ULy_2_Sy_3_, where y1 denotes the R ratio (of underloads), y2 indicates the consecutive underloads, and y3 represents the number of baseline cycles that had R ratio as 0.5 and were applied between each underload application. See [44] for more details. To help clarify this notation, a few examples are presented in Table 1.
It should also be noted that each of these repeated spectra were followed by (separated by) 500 cycles at R = 0.7. The maximum stress in each spectrum and load block was held constant at 240 MPa. The values of f_rms_ associated with the different load blocks that made up the various spectra are given in Table 2.
The constants D, and p for 7050-T7451 were given in [18,40,41] as 7.0 × 10^−10^ and 2, respectively. For this specific material 7050-T7451, the fracture toughness was taken from the ASM Materials data sheet [47], namely A = 32 MPa √m. Consequently, following the approach outlined above, setting the fatigue threshold term (Δ ) related to the growth of small naturally occurring lead cracks as Δ = 0.1 MPa √m, we obtain:
Equation (9) was subsequently employed to forecast the fatigue curves detailed in [44] for each spectrum analyzed. These predictions are also shown in Figure 1. This also shows the actual crack growth data (da/dN vs. ΔK) that is extracted from [44].
Figure 1 indicates that the various fatigue curves given in [44] are generally predicted with good accuracy by the USAF Characteristic K method. It should also be noted that, whilst the objective of this study was not to fit the measured data, the coefficient of determination (R^2^) associated with the fits to the fastest data sets, i.e., the data shown in Figure 1e, is greater than 0.8. That said, it should be noted that each figure shows only one prediction. The similarity in term f_rms_ values for a specific load spectrum results in predicted curves that are closely aligned. This phenomenon is clearly demonstrated in Figure 2, where the curves corresponding to spectra R-1UL3S50:300 and R-0.5UL3S50:300 are depicted respectively. Consequently, presenting just one prediction provides a clearer picture of the concordance between the predicted curves and the measured data.
Whilst the consistency between the measured and the predicted fatigue curves is very good, the question emerges regarding how variations in the value of A influence the various calculated crack growth curves. To investigate this effect, the analyses were repeated using the value of A given in [40,41], namely A = 47 MPa √m. The consequent measured and computed curves are displayed in Figure 3. Here it is seen that, whilst using the value listed in the ASM data sheet gave excellent predictions, using a value of A = 47 MPa √m nevertheless yields reasonably good predictions. As such, it would appear that the sensitivity of the predicted curves to the value of A is not a particularly significant issue.
4. Conclusions
This paper forms part of an ongoing investigation into the linear elastic fracture mechanics (LEFM) tools needed to assess the durability of both limited life AM replacement parts and cold spray repairs. The USAF Damage Tolerance Design Handbook permits the application of the ‘Characteristic K’ methodology in studies related to airworthiness certification. At the same time, MIL-STD-1530Dc requires a predictive capability. This study illustrates how the USAF Characteristic K method, when used in conjunction with the Hartman–Schijve version of the NASGRO crack growth equation, reasonably accurately predicts the impact of underloads on the growth of small cracks in the aluminium alloy AA7050-T7451. The specific test cases analysed were chosen since the aluminium alloy AA7050-T7451 is widely used in the Boeing F/A-18E/F Super Hornet, the Boeing EA-G Growler, and in the Lockheed Martin F-35 Lightning II. In this context, it should be noted that [44] reported that the underload spectra studied were deliberately constructed so as to investigate the influence of underload spacing, consecutive application, and magnitude on crack growth rates. The study demonstrates that the USAF Characteristic K method effectively predicts the fatigue crack growth rate across all five analyzed underload spectra. Furthermore, it was found that the sensitivity of the predicted curves to the value of parameter A is not a significant issue.
Based on the author’s knowledge, this paper represents the first instance of demonstrating the Characteristic K approach’s capacity to predicting the growth of small cracks under various underload spectra with reasonable accuracy. To further validate and solidify its effectiveness, future work will involve applying this approach to other materials subjected to different underload spectra, ultimately establishing it as a robust predictive tool.
The reference list from the paper itself. Each links out to its DOI / PubMed record.
- 1Under Secretary of Defense Acquisition and Sustainment, Directive-Type Memorandum (DTM)-19-006-Interim Policy and Guidance for the Use of Additive Manufacturing (AM) in Support of Material Sustainment. Pentagon: Washington, DC, USA Available online: https://oldcc.gov/sites/default/files/news/Directive-type-Memorandum.pdf(accessed on 13 April 2024)
- 2US Army Directive 2019-29 Enabling Readiness and Modernization through Advanced Manufacturing. Secretary of the Army, Pentagon: Washington, DC, USA Available online: https://armypubs.army.mil/epubs/DR_pubs/DR_a/pdf/web/ARN 19451_AD 2019-29_Web_Final.pdf(accessed on 13 April 2024)
- 3Structures Bulletin EZ-SB-19-01 Durability and Damage Tolerance Certification for Additive Manufacturing of Aircraft Structural Metallic Parts Available online: https://daytonaero.com/usaf-structures-bulletins-library/(accessed on 15 February 2024)
- 4Mc Michael E. Frazier W. NAVAIR Additive Manufacturing Joint Federal Aviation Administration–Air Force Workshop on Qualification/Certification of Additively Manufactured Parts (DOT/FAA/TC-16/15)Available online: http://www.tc.faa.gov/its/worldpac/techrpt/tc 16-15.pdf(accessed on 4 January 2024)
- 5MIL-STD-1530 D Department of Defense Standard Practice Aircraft Structural Integrity Program (ASIP)Military and Government Specs & Standards (Naval Publications and Form Center) (NPFC)Philadelphia, PA, USA 2016 Available online: http://everyspec.com/MIL-STD/MIL-STD-1500-1599/MIL-STD-1530 D_55392/(accessed on 2 January 2024)
- 6Molent L. Aircraft Fatigue Management Springer Berlin/Heidelberg, Germany 202410.1007/978-981-99-7468-9 · doi ↗
- 7Jones R. Fatigue crack growth and damage tolerance Fatigue Fract. Eng. Mater. Struct.20143746348310.1111/ffe.12155 · doi ↗
- 8Kundu S. Jones R. Peng D. Matthews N. Alankar A. Raman S.R.K. Huang P. Review of requirements for the durability and damage tolerance certification of additively manufactured aircraft structural parts and AM repairs Materials 202013134110.3390/ma 1306134132183483 PMC 7143087 · doi ↗ · pubmed ↗