Improving the identification of bone‐specific physical activity using wrist‐worn accelerometry: A cross‐sectional study in 11–12‐year‐old Australian children
Gemma Brailey, Brad Metcalf, Lisa Price, Sean Cumming, Alex Rowlands, Timothy Olds, Peter Simm, Melissa Wake, Victoria Stiles

TL;DR
This study finds that short bursts of high-intensity physical activity, measured using improved wrist-worn accelerometers, are most beneficial for bone health in children.
Contribution
The study introduces improved accelerometry methods using 1-second epochs and 50 mg intensity thresholds to better identify bone-specific physical activity.
Findings
Physical activity above 700 mg intensity (equivalent to running ~10 km/h) was positively associated with bone density and strength in children.
Using 1-second epochs and incremental intensity thresholds improved the identification of bone-relevant physical activity.
Traditional methods underestimated the impact of short, high-intensity activity bursts on bone health.
Abstract
Physical activity (PA) during childhood and adolescence is important for the accrual of maximal peak bone mass. The precise dose that benefits bone remains unclear as methods commonly used to analyze PA data are unsuitable for measuring bone‐relevant PA. Using improved accelerometry methods, this study identified the amount and intensity of PA most strongly associated with bone outcomes in 11–12‐year‐olds. Participants (n = 770; 382 boys) underwent tibial peripheral quantitative computed tomography to assess trabecular and cortical density, endosteal and periosteal circumference and polar stress‐strain index. Seven‐day wrist‐worn raw acceleration data averaged over 1‐s epochs was used to estimate time accumulated above incremental PA intensities (50 milli‐gravitational unit (mg) increments from 200 to 3000 mg). Associations between time spent above each 50 mg increment and bone outcomes…
Genes, proteins, chemicals, diseases, species, mutations and cell lines named across the full text — each resolved to its canonical identifier and authoritative record.
Click any figure to enlarge with its caption.
 FIGURE 1
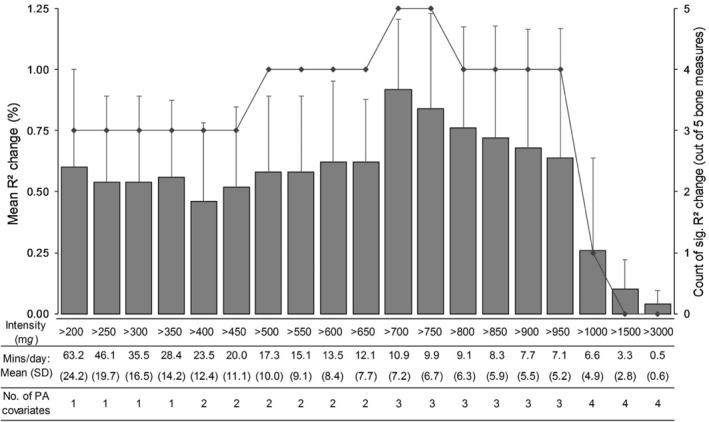 FIGURE 2
| All ( | Boys ( | Girls ( | |
|---|---|---|---|
| Age (years) | 11.9 (0.4) | 11.9 (0.4) | 11.9 (0.4) |
| Body height (cm) | 153.1 (7.9) | 152.5 (8.0) | 153.7 (7.9) |
| Body mass (kg) | 44.8 (10.3) | 44.2 (10.6) | 45.4 (10.0) |
| BMI (kg/m2) | 19.0 (3.4) | 18.9 (3.5) | 19.1 (3.2) |
| Puberty | |||
| Pre‐pubertal | 84 [10.9] | 63 [16.5] | 21 [5.4] |
| Early/mid‐pubertal | 589 [76.5] | 305 [79.9] | 284 [73.2] |
| Late/post‐pubertal | 97 [12.6] | 14 [3.7] | 83 [21.4] |
| Disadvantage (SEIFA) | 1028 (60) | 1030 (60) | 1027 (61) |
| Bone and muscle measurements from pQCT | |||
| Cortical BMD (m | 1018.9 (37.4) | 1010.5 (35.7) | 1027.1 (37.2) |
| Trabecular BMD (m | 197.7 (25.9) | 195.2 (23.4) | 200.2 (27.8) |
| Endosteal circumference (mm) | 61.9 (8.3) | 63.0 (8.4) | 60.9 (8.1) |
| Periosteal circumference (mm) | 81.2 (7.2) | 81.9 (7.5) | 80.5 (6.9) |
| Polar stress‐strain index (mm³) | 1700 (387) | 1709 (396) | 1692 (378) |
| Muscle CSA (mm2) | 4362 (704) | 4313 (725) | 4410 (682) |
| Bone outcome | >700 m | 700–1500 m | ||||
|---|---|---|---|---|---|---|
| ∆ |
|
| ∆ |
|
| |
| Cortical density | 1.3 | −1.3 | 0.001 | 1.4 | −2.7 | <0.001 |
| Trabecular density | 1.1 | 0.8 | 0.001 | 0.8 | 1.4 | 0.006 |
| Endosteal circumference | 0.6 | 0.2 | 0.020 | 1.0 | 0.5 | 0.002 |
| Periosteal circumference | 0.9 | 0.2 | 0.001 | 1.2 | 0.5 | <0.001 |
| Polar SSI | 0.7 | 9.7 | <0.001 | 0.8 | 20.0 | <0.001 |
| Mean ± SD | 0.92 ± 0.29 | 1.04 ± 0.26 | ||||
- —Australian National Health and Medical Research Council
- —Royal Children's Hospital Foundation 10.13039/100014607
- —NIHR Leicester Biomedical Research Centre 10.13039/501100020013
- —Victorian Deaf Education Institute
- —Economic and Social Research Council 10.13039/501100000269
- —University of Melbourne 10.13039/501100001782
- —National Heart Foundation of Australia 10.13039/501100001030
- —Collaboration for Leadership in Applied Health Research and Care East Midlands
- —Financial Markets Foundation for Children 10.13039/501100005381
- —NHMCR Principal Research Fellowship
- —Murdoch Children's Research Institute 10.13039/100014555
Peer Reviews
No public reviews on file for this paper yet. If you reviewed it on a platform where reviews are public (OpenReview, ICLR, NeurIPS, ICML), you can paste yours below so the community can read it here.
Videos
No videos yet. Explain this paper in a talk, walkthrough, or lecture? Add one.
Taxonomy
TopicsBody Composition Measurement Techniques · Lower Extremity Biomechanics and Pathologies · Occupational Health and Performance
INTRODUCTION
1
Globally, osteoporosis is responsible for 8.9 million fractures per annum and conveys substantial social and economic burden (Johnell et al., 2006). A large proportion of osteoporosis risk (∼60%) is determined by the amount of bone accrued at the point of peak bone mass (PBM) in early adulthood (Bonjour et al., 2009). Whilst non‐modifiable genetic factors account for a large degree of the variability in PBM (60%–80%), one of the most important modifiable influences is physical activity (PA) experienced during childhood and adolescence (Weaver et al., 2016). However, identification of specific doses of PA that confer benefits to bone health remains problematic (Weaver et al., 2016).
Accelerometers have become the method of choice for assessing PA in relation to health outcomes (Trost, 2020) with the wrist wear‐location becoming increasingly popular due to the improved wear compliance and more complete depictions of free‐living PA that are obtained (Fairclough et al., 2016). However, the accelerometry methods most widely used in studies assessing PA‐bone relationships average proprietary outputs over long (e.g., 15–60‐s) epochs and classify this output into intensity categories (e.g., moderate PA [MPA] and vigorous PA [VPA]), using cut‐points (numerous) that are selected at the outset (Brailey et al., 2022). As a result, the short bursts of high‐intensity activity that are required to initiate osteogenesis (Turner et al., 2003) and sporadically performed by children (Bailey et al., 1995; Baquet et al., 2007) are “over‐smoothed” and misclassified as lower intensity activity (Nilsson et al., 2002). Further, different cut‐points result in divergent PA estimates (Freedson et al., 2005; Routen et al., 2012) and prevent direct comparison between studies (Bornstein et al., 2011). Thus, a crucial opportunity to aggregate data and identify important trends between PA, health and disease is missed (Bornstein et al., 2011). Although familiar to researchers, the continued use of these methods contributes to the lack of clarity regarding the dose‐response relationship between PA and bone health in youth.
To improve the identification of bone‐specific PA in free‐living situations, a recent systematic review of studies assessing accelerometer‐derived habitual PA in relation to bone outcomes recommended that shorter 1‐s epochs be used to ensure that brief dynamic episodes of osteogenic activity are captured more in their entirety (Brailey et al., 2022). It was also stated that a data‐driven approach that identifies the intensities of activity most strongly associated with bone outcomes may be more informative than investigating the associations with pre‐defined intensity cut‐points (such as MPA, moderate‐vigorous PA (MVPA), and VPA) that are calibrated against measures of energy expenditure (Brailey et al., 2022). An example of this approach already exists in a study of adult women from UK Biobank (Stiles et al., 2017). Open‐source software was used to process raw acceleration from a wrist‐worn device in 1‐s epochs and instead of applying cut‐points a priori, time accumulated in incremental intensities of acceleration (50 milli‐gravitational units (mg)) was used to identify that on average, only a few minutes of activity/day above 750 and 1000 mg (found to be equivalent to slow‐medium paced running) was associated with bone health in post‐ and pre‐menopausal women, respectively. Using this approach, an estimate of the volume of PA accumulated can also be obtained (Stiles et al., 2018). This technique gives more value to brief periods of high‐intensity activity in the analysis, a characteristic of PA, which may be particularly pertinent to generating an osteogenic response (Stiles et al., 2018), especially in children where PA tends to be accumulated in short bursts (Bailey et al., 1995; Baquet et al., 2007).
As the opportunity to accrue bone is enhanced during growth, the amount and intensity of habitual PA found to benefit bone is likely to differ in children and adolescents compared to adults (Bailey et al., 1999; Baxter‐Jones et al., 2011) and warrants further investigation. Large scale observational studies, such as Australia's Child Health CheckPoint (Clifford et al., 2019), have been instrumental in demonstrating that significant associations between bone outcomes and habitual PA measured using a wrist‐worn accelerometer in children do exist, with higher activity levels resulting in greater bone mass, geometry and strength (Osborn et al., 2018), contributing to a reduction in fracture risk (Kalkwarf et al., 2011). However, the use of traditional intensity classifications (e.g., MVPA) and long epoch lengths has prevented the precise amount and intensity of PA required to benefit bone health from being identified (Brailey et al., 2022). Therefore, this study aims to use open‐source software to process and analyze raw acceleration data using methods that have been modified to better detect bone‐relevant PA to identify the intensity of acceleration most strongly associated with pQCT‐derived measures of bone health in a large cross‐sectional study of 11–12‐year‐olds.
MATERIALS AND METHODS
2
Study population
2.1
Participants were part of the Child Health CheckPoint (Clifford et al., 2019), a cross‐sectional physical health and biomarker module, that was embedded within the population‐based Longitudinal Study of Australian Children (LSAC) (Edwards, 2014). The LSAC and CheckPoint studies are described in detail elsewhere (Clifford et al., 2019; Edwards, 2014). In 2004, a two‐stage cluster randomized design was used to recruit a nationally representative cohort of 5107 infants (B cohort) to LSAC. Children and families enroled in LSAC are followed biennially with 6 data collection waves completed up until 2015 (73.7% retention rate). CheckPoint data collection took place from February 2015 to March 2016 between LSAC's sixth and seventh waves when B cohort children were 11–12‐years‐old. Written informed consent for LSAC was provided by the child's parent/guardian. At the beginning of wave 6, families provided written consent to be contacted by the CheckPoint team to undertake additional testing.
From December 2014, consenting families were invited to attend either a main assessment center, mini assessment center or home visit. Details of each assessment center and measures conducted are in the CheckPoint Data User Guide (Clifford et al., 2018). Since bone measures were only taken at the main assessment center, only participants who attended the main assessment center were eligible for inclusion in this study. Study data were collected and managed using Research Electronic Data Capture (REDCap) electronic data capture tools (Harris et al., 2009, 2019) hosted at the Murdoch Children's Research Institute.
Anthropometric measures
2.2
Anthropometric measures were conducted in line with previous methods (Marfell‐Jones et al., 2006). Standing height was measured (to the nearest 0.1 cm) using a portable stadiometer (Model IP0955, Invicta) with the head in the Frankfort plane and shoes and socks removed. Two measures were taken and if these differed by >0.5 cm, a third was conducted. The average of the two closest measurements was reported. Weight was measured once (to the nearest 0.1 kg) using four‐limb bioelectrical impendence analysis scales (InBody230 scales; InBody Co Ltd.). Children wore light clothing, removed shoes and socks and held the two horizontal handles whilst standing on the scales. Body mass index (kg/m^2^) was calculated using weight (kg)/height (m)^2^.
Pubertal assessment
2.3
Pubertal status was self‐reported using the Pubertal Development Scale (PDS; Petersen et al., 1988), and participants were assigned to pre‐, early, mid‐, late and post‐pubertal categories. The PDS is a validated, reliable method of assessing pubertal status (Brooksgunn et al., 1987; Petersen et al., 1988) and asks questions relating to growth spurt in height and changes in body hair and skin in both males and females, along with sex‐specific questions regarding deepening of voice and facial hair in males and breast growth and menarche in females.
Socioeconomic status
2.4
Socio‐economic status was assessed using The Australian Bureau of Statistics' Socio‐economic Indicators for Areas (SEIFA) 2011 Index of Relative Socio‐economic Disadvantage Score (Statistics ABo, 2011). This census‐based measure was determined from each participant's postcode and considers household education level, income, employment status and disability. A higher score indicates greater advantage. The populations mean score for Australia is 1000 with an standard deviation (SD) of 100.
Bone health assessment
2.5
One of the three licensed research assistants performed a peripheral quantitative computed tomography (pQCT) scan of the non‐dominant distal tibia (dominance classified as the leg preferentially used to kick a ball) using a single Stratec XCT 2000L pQCT scanner (Medizintechnik); methods and descriptive values have been reported elsewhere (Vlok et al., 2019). Participants were allocated 7 min for one scout scan and two research scans of the lower leg at the relative distances of 4% and 66%, respectively. Quality control was measured daily using a standard phantom (XCT2000L, 0.370 1/cm) and every 30 days using a cone phantom. A standard measuring tape was used to manually assess tibial length. This was defined as the distance between the superior edge of the medial malleolus and the medial edge of the tibial plateau (Moyer‐Mileur et al., 2008) and was identified through palpation and marked with a pen. Seated participants then extended their non‐dominant leg through the scanner gantry and their foot (shoeless) was secured to the pQCT footrest. As the scanner gantry was only 14 cm in diameter, participants with larger calves had scans at the 4% site only. A scout scan identified the distal epiphyseal plate and allowed placement of a reference line at its proximal edge. The 4% (ankle) and 66% (shin) sites of the tibia were then identified by the researcher using this reference line in relation to limb length. One tomographic image was taken at each site (scan speed 20 mm/s, slice thickness 2.4 mm, and voxel size 0.4 mm).
Using Stratec XCT 2000 software (version 6.20C), one of two trained research assistants reviewed the regions of interest around the total image at the 4% and 66% sites and adjusted where necessary. The MACRO analysis function was then used to generate bone measures with near perfect inter‐rater agreement (ICC >0.99). At the 4% distal cross‐section, trabecular bone mineral density (BMD; mg/cm^3^) was calculated using a threshold of 169.0 mg/cm^3^, peel and contour modes: 1 and a trabecular area of 45% (Biggin et al., 2013). At the 66% proximal cross‐section, cortical BMD (mg/cm^3^), endosteal circumference (mm) and periosteal circumference (mm) were calculated using a threshold of 710 g/cm^3^, contour mode: 1 and peel and cortical modes: 2 (Farr et al., 2011; Sherk et al., 2012). The polar stress‐strain index (SSI; mm^3^) was calculated at the 66% site from geometry and density measures (threshold = 480.0 mg/cm^3^, peel and contour modes = 1 and filter = F01 (Brookes et al., 2015)). Muscle cross‐sectional area (MCSA) was calculated by subtracting the CSA of bone from the combined muscle and bone CSA (threshold 50–540 mg/cm³, contour mode: 3, peel mode: 1 and filter: F03F05 (Brookes et al., 2015; Sherk et al., 2012)). Each scan was reviewed and using methods similar to Blew et al. (2014) given a quality score of 1 (best) to 5 (worst) based on image resolution, presence of motion artifacts and a clearly definable region of interest. Images were excluded if they were graded 4 or 5 and had motion artifact that affected the region of interest (inner 45% of trabecular bone in 4% scans or cortical bone in 66% scans).
PA monitoring and data processing
2.6
At the end of the visit, participants were given a wrist‐worn triaxial GENEActiv accelerometer (dynamic range ±8 g, where g = the value of gravity (9.81 m/s^2^); Activinsights Ltd.); methods and descriptive values have been reported elsewhere (Fraysse et al., 2019). Monitors were configured using the GENEActiv PC software (version 2.9) to capture and store raw acceleration at 50 Hz for 14 days. Participants were instructed to wear the accelerometer on the non‐dominant wrist continuously for 8 days (wear started on the day of the visit, but recording did not begin until midnight), removing only for prolonged water immersion (swimming and bath) or sports where they were not permitted. Devices were returned in a pre‐paid postal envelope.
Data were downloaded (GENEActiv PC software; version 2.9 Activinsights Ltd.) and saved in raw format as .bin files. The open‐source R‐package GGIR Version 1.9‐0 in R (http://cran.r‐project.org) (van Hees et al., 2013, 2014) was used to analyze accelerometer files. Processing of accelerometer data in GGIR involves autocalibration using local gravity as a reference (van Hees et al., 2014), detection of sustained abnormally high values, non‐wear detection and calculation of the average magnitude of dynamic acceleration corrected for gravity (Euclidean Norm minus 1 g; ENMO) (van Hees et al., 2013). ENMO values were averaged over 1‐s epochs and expressed in milli‐gravitational units (mg). To ensure any activity registered due to movement during travel/postage was not treated as meaningful activity, the GGIR script was restricted to 7 days to cover the main wear period. Accelerometer files that had a post‐calibration error >0.01 mg or less than 4 valid days wear (3 weekdays and 1 weekend day) were excluded. A valid day was defined as ≥16 h of wear during a 24‐h period (Rowlands et al., 2016). Non‐wear was identified when the SD of at least two of the three axes was <13 mg, and the value range was <50 mg assessed over 60 min windows with a 15‐min sliding window (da Silva et al., 2014). By default, when non‐wear was detected, invalid data were imputed by average data at similar time points from other days (described in detail elsewhere (van Hees et al., 2013)).
To avoid the application of any cut‐points to ENMO a priori, the time (minutes) accumulated in bins defined by incremental acceleration thresholds (10 mg increments from 0 to 50 mg; 50 mg increments from 50 to 3000 mg, for example, 50–99.99, 100–149.99, 150–199.99, … 3000 and in a single large bin from 3000 to 8000 mg (occurrence of time accumulated >3000 mg was rare)) was calculated for each day and averaged across all valid days. Time spent in each incremental acceleration bin for this “average day” was used to compile PA predictor variables of interest and respective covariates to assess associations with bone outcomes. Acceleration ranges representing a variety of activities were used to provide context and aid in the interpretation of activities that the most strongly associated intensity may represent (described previously in Rowlands et al. (2019)). Representative activities included walking (slow: ∼3 km/h, 100–200 mg; brisk: ∼5 km/h, >200–350 mg and fast: ∼6.5 km/h, >350–500 mg), running (slow: ∼8 km/h, >500–1000 mg; medium: ∼10 km/h, >1000–1500 mg and fast: ∼15 km/h, >1500–2000 mg) and sprinting/jumping (>2000 mg) (Rowlands et al., 2019). For comparison, published thresholds for MVPA and VPA for children range from 200–250 and 700–750 mg, respectively (Hildebrand et al., 2014; Phillips et al., 2013). To give value to short amounts of high‐intensity activity that are important for osteogenesis, a volume acceleration metric was also calculated from intensity and duration. The time in minutes in each 50 mg bin was multiplied by the average intensity of that bin (e.g., 725 mg was the average intensity for the 700–750 mg bin) to approximate the volume of each bin in mg minutes (Stiles et al., 2018). The bins were then summed to create a total volume variable for each threshold analyzed.
Statistical analyses
2.7
Descriptive statistics were calculated for anthropometric, bone and PA variables using mean (SD). Independent t‐tests were conducted to identify sex differences in anthropometric and bone variables. To identify the PA intensity most strongly and consistently associated with bone outcomes, the associations between each bone variable and the time spent above each incremental PA intensity threshold was examined using multiple linear regression. For each bone outcome, we ran 19 separate regression models each with a different PA intensity threshold. Each of these models was compared to the “covariate‐only” model, and the corresponding R ^2^ change and p‐values were recorded. The 19 intensity thresholds that we tested separately were >200, >250, >300, >350, >400, >450, >500, >550, >600, >650, >700, >750, >800, >850, >900, >950, >1000, >1500, and >3000 mg (designed to include accelerations that are typical of walking, through to sprinting and jumping in children (Rowlands et al., 2019)). This was done for each of the 5 bone outcomes to examine how the strength of associations (R ^2^ changes) varied between thresholds and to use these to identify the point at which the association between a threshold of acceleration was consistently the strongest across all 5 bone outcomes. The optimal intensity was determined by the magnitude of the mean R ^2^ change (calculated from the R ^2^ change for each bone outcome per intensity increment), the SD of the R ^2^ changes across all 5 bone outcomes per intensity increment, and on the number of bone outcomes that were significantly associated with each intensity increment.
Model 1 consisted of all potential covariates: age, sex, height, weight, pubertal status, SEIFA index and MCSA, which were selected a priori based on evidence of their influence on both PA and bone during growth (Cooper et al., 2015; Osborn et al., 2018; Weaver et al., 2016), and PA below the intensity of interest (e.g., 40–199 mg when intensity of interest >200 mg). Activity <40 mg was omitted to avoid multicollinearity and because PA <40 mg was considered non‐meaningful for bone outcomes (Osborn et al., 2018). When investigating higher intensities (e.g., >700 mg), PA covariates below the intensity of interest were split into smaller categories (e.g., activity classed as MPA (200–699 mg (Hildebrand et al., 2014; Phillips et al., 2013)) was divided into 200–399 mg and 400–699 mg) to account for activity at the lower or higher end of this category that may differ in impact magnitude and osteogenic potential. Model 2 included all variables entered in Model 1 with the addition of the intensity threshold of interest (e.g., >200 mg or >250 mg etc.). As there were no significant interactions of PA with maturity or sex, model coefficients are presented for boys and girls and all maturity groups combined. Residual plots were inspected for normality, linearity and homoscedasticity, and the variance inflation factor was used to assess whether there was any collinearity with the variable of interest. We did not adjust for multiple testing as we were not testing multiple PA variables, we were testing the same PA variable in each model just with different thresholds. The purpose was not to identify which PA variables were statistically significant and which were not but to record the magnitude of association (R ^2^ change) for each threshold and visually inspect a plot to identify the “optimal” threshold (akin to Receiver Operating Characteristic curve analyses where the true positive/false positive rate is recorded and plotted for each threshold on the classification scale in order). All analyses were conducted in IBM SPSS Version 27 (IBM).
RESULTS
3
Participant characteristics
3.1
Of the 3764 children that participated in wave 6 of LSAC, 1874 attended the Child Health CheckPoint. Of those attending main assessment centers (n = 1356), 967 children had full or partial pQCT data (93% full and 7% partial) and raw acceleration files. A further 197 participants were excluded due to lack of covariate data (PDS and MCSA), poor bone image quality (graded 4 or 5), failure to meet the accelerometer wear criteria of 16 h/day for 4 days (3 weekdays and 1 weekend day) or due to acceleration files having a post‐calibration error >0.01 g. A total of 770 children (382 boys) were included in the final sample. Participant flow and reasons for exclusion are detailed in Figure 1. Participants in the present study had similar descriptive characteristics to those in the Child Health CheckPoint who did not satisfy the study inclusion criteria (n = 918; 484 boys). Girls in the present study were significantly taller than boys (p = 0.04) and had significantly higher cortical and trabecular BMD (p < 0.001 and p = 0.008) but significantly lower endosteal and periosteal circumferences (p < 0.001 and p = 0.006). Girls were also at a more advanced pubertal stage than boys with a lower proportion categorized as pre‐pubertal (5.4% vs. 16.5%) and higher proportion categorized as late/post pubertal (21.4% vs. 3.7%). Descriptive characteristics are presented in Table 1.
Participant flow chart. CSA, cross‐sectional area; LSAC, Longitudinal Study of Australian Children (Gray et al., 2005).
Associations between bone outcomes and time spent above incremental intensity thresholds
3.2
All assumptions for the regression analyses were met. The mean R ^2^ change across all 5 bone outcomes, the number of outcomes that were significant from the regression analyses and the respective time spent above each 50 mg intensity increment are displayed in Figure 2. As the PA intensity threshold of interest increased in 50 mg increments from >200 to >700 mg, there was a gradual increase in mean R ^2^ change across the five bone outcomes. For example, when adding PA >200 mg or >500 mg or >700 mg to the covariate model, the mean R ^2^ change was 0.54%, 0.58% and 0.92% with 3/5, 4/5 and 5/5 of the bone outcomes being p < 0.05, respectively. Further incremental increases in PA intensity thresholds from this point resulted in a reduction in overall mean R ^2^ change and associations became non‐significant for all bone outcomes from >1500 mg (mean R ^2^ change = 0.10%, p = 0.1–0.9; Figure 2). The R ^2^ change, unstandardized beta coefficients and associated p values for each bone outcome and PA >700 mg are presented in Table 2. The >700 mg threshold was associated with higher (i.e., better) trabecular BMD, bigger endosteal and periosteal circumference (bone size) and higher polar SSI (torsional strength). However, a negative relationship was identified with cortical BMD (unstandardized beta = −1.3, p = 0.001; Table 2.). As a sensitivity analysis, the regression analyses were repeated without including any PA covariates below the threshold of interest and with all PA below the intensity of interest collapsed into one covariate. Results followed the same pattern with PA >700 mg still having a larger overall mean R ^2^ change compared to the other PA intensities examined. Due to some sports not permitting accelerometer wear, sensitivity analyses removing those reporting more than on average 20, 30, and 60 min/d in sport (n = 562, 500 and 328, respectively) were conducted. Results followed the same pattern as the whole sample findings with the >700 mg threshold achieving the highest overall mean R ^2^ change. The mean time spent in activity >700 mg was 10.87 min/day.
Mean R 2 change (%) (bar chart, error bars = standard deviation [SD]) for model 2 for all 5 bone outcomes (cortical density, trabecular density, endosteal circumference, periosteal circumference and polar stress‐strain index) from regression analyses with each 50 mg physical activity (PA) intensity increment from >200 to >1000 mg and for >1500 and >3000 mg intensities (model 1 adjusted for age, sex, height, weight, pubertal status, Socio‐economic Indicators for Areas index, muscle cross‐sectional area and PA intensities below the threshold of interest (from 40 mg onwards)). Model 2 = model 1 + PA intensity of interest. The line graph demonstrates the number of bone outcomes (out of 5) that were significantly associated with each intensity. The mean (SD) minutes/day for the whole sample as well as the number of PA covariates used in analyses for each intensity are presented below the chart. PA covariates used: 1 = 40 mg—intensity of interest; 2 = 40–199 mg + 200 mg—intensity of interest; 3 = 40–199 mg, 200–399 mg + 400 mg—intensity of interest and 4 = 40–199 mg, 200–399 mg, 400–699 mg + 700 mg—intensity of interest.
TABLE 2: R 2 change, unstandardized beta coefficients and p values from multiple linear regression analyses.
Associations with PA became non‐significant for all bone outcomes from >1500 mg onwards. The study sample spent 3.28 (±2.83) minutes/day engaged in PA above this intensity. Further regression analyses were performed for each bone outcome and time spent between 700 and 1500 mg to determine whether the removal of non‐bone associated PA (e.g., due to clapping or other rapid hand movements) improved the strength of associations observed. Removing activity >1500 mg led to a slight increase in mean R ^2^ change for activity between 700 and 1500 mg (0.92%–1.04%; Table 2). Like >700 mg, activity between 700 and 1500 mg was associated with better trabecular BMD, bone size and bone strength (Table 2). The mean time spent in activity between 700 and 1500 mg was 7.61 (±4.59) minutes per day. Results for the volume analyses (which gives value to short but meaningful amounts of high‐intensity activity) followed the same pattern as the analyses for the time spent in each intensity threshold (data not shown) and did not reveal any additional information regarding associations between bone outcomes and short bursts of high‐intensity activity. The analyses conducted on time spent are presented as they lend themselves to easier interpretation.
DISCUSSION
4
Using open‐source software and applying an outcome‐specific approach to the processing and analysis of wrist‐worn raw accelerometry data, this study has demonstrated that PA >700 mg was positively and most strongly associated with pQCT‐derived measures of bone density, geometry and strength in a large sample of 11–12‐year‐olds. The use of 1‐s epochs (the shortest epoch currently used in PA research) reduces the risk of misclassifying short, sporadic bursts of high‐impact activity (Aadland et al., 2020) and investigating associations with incremental 50 mg intensity thresholds (rather than applying traditional intensity cut‐points a priori) enabled a bone‐specific, beneficial intensity to be identified in this sample. Unlike more traditional approaches, the methods outlined provide a means for more precisely assessing free‐living, bone‐relevant PA and use open‐source software that permits the transparent and reproducible analysis of raw accelerometry data (Migueles et al., 2019), which will enhance the ability to quantify dose‐response associations in the future (Rowlands et al., 2018).
The beneficial intensity of >700 mg identified in the present study is equivalent to the VPA threshold identified in calibration studies using wrist‐worn raw accelerometry in children (Hildebrand et al., 2014; Phillips et al., 2013). Several previous cross‐sectional studies have also reported that accelerometer‐derived VPA is most strongly associated with bone outcomes in comparison to other pre‐defined PA intensities (e.g., MPA and MVPA) (Brailey et al., 2022). However, variability in the accelerometry methods used, particularly in the numerous cut‐point definitions employed and averaging of count‐based outputs over long epochs, heavily influences the PA data obtained (Bornstein et al., 2011; Nilsson et al., 2002; Routen et al., 2012), precluding comparisons between studies and preventing more precise amounts and intensities (and types of activity these likely represent) from being identified. Processing the data in smaller 50 mg intensity increments instead of pre‐defined intensity thresholds enabled a bone‐relevant intensity to be identified and using reference acceleration ranges to translate findings post‐hoc helped to provide context and an interpretable health message (Rowlands, 2018). In the present sample, the strongest associations with bone outcomes came from activity between 700 and 1500 mg, which has been shown to represent running at around 10 km/h in children and adolescents (Hildebrand et al., 2014; Phillips et al., 2013; Rowlands et al., 2019). To our knowledge, there are no other studies that have used raw acceleration averaged over 1‐s epochs to identify a bone‐specific intensity of PA in this population. However, in support of our findings, Deere and colleagues (Deere et al., 2012) assessed the number of impacts per day across a range of impact intensities from raw acceleration and found that impacts >4.2 g, which were also shown to approximate running at ∼10 km/h, were positively associated with hip BMD in older adolescents. Medium‐paced running is a simple, accessible activity that can be easily incorporated into activities of daily living and may therefore be a realistic and achievable option that can be promoted to improve bone health in this population.
In the present study, no significant associations were identified with activity >1500 mg. Acceleration values of >1500–2000 mg pertain to faster running (∼15 km/h) and >2000 mg to sprinting and jumping in children and adolescents (Rowlands et al., 2019). The lack of significant associations from >1500 mg is surprising as the osteogenic benefits of high‐impact jumping activities have consistently been demonstrated (Behringer et al., 2014). The mean time spent in activity >1500 mg was 3.3 min/day and 80%, 59% and 43% of the sample achieved at least 1, 2 or 3 min/day in this range. Therefore, the lack of association is unlikely due to a lack of statistical power. Instead, it is likely a result of little jumping activity occurring and the wrist‐worn accelerometer capturing non‐bone associated activities involving rapid hand movements but little body movement (e.g., from interactive computer games and clapping) rather than sporadically performed osteogenic activities, such as jumping. This is further supported by the fact that the incremental analysis using volume variables (which give more value to brief periods of high acceleration magnitudes) did not reveal any significant associations with higher acceleration magnitudes. However, a reliance on calibration studies to infer activity type means we cannot be certain about the activity that contributed to the time spent >1500 mg and why no significant associations were identified.
Counter to other observations in this study, PA was negatively associated with cortical BMD. This has previously been reported in the same cohort using compositional (Dumuid et al., 2020) and non‐compositional (Osborn et al., 2018) analyses of MVPA and is likely due to the accelerated rate of remodeling that occurs around peak growth (Parfitt, 1994) and in response to mechanical loading from PA (Liu et al., 2003), which causes a transitory reduction in cortical BMD (Parfitt, 1994). When subjected to mechanical loads, bone improves its mechanical competence through geometric adaptations (increases in size) at the expense of density to ensure that the resulting structure is as strong as possible with an economic amount of material (Liu et al., 2003). This supports our findings of greater periosteal circumference and bone strength with increased PA despite reduced cortical density.
The methods outlined in the present study provide a simple, accessible way of assessing free‐living bone‐relevant PA. The open‐source software used (GGIR) can be operated without significant prior programing expertize and can be easily applied to large datasets. Further, using demographic‐specific acceleration ranges to translate findings rather than imposing pre‐defined cut‐points a‐priori helps to maintain comparability of findings and facilitate the development of interpretable health messages (Rowlands, 2018). Nonetheless, these methods are still limited by the fact that they are unable to obtain information regarding activity type and continue to underutilize the richness of the raw signal by aggregating the data into epochs. However, more sophisticated approaches to characterizing PA behavior require complex analytical processes and in the short‐term, are unlikely to take the place of these approaches.
This study is also limited by the cross‐sectional design, which means it may be susceptible to reverse causality. Moreover, whilst several important confounders were controlled for, it was not possible to include information on nutrition, medical conditions or medication, all of which may impact bone. The removal of accelerometers for certain sports may have also impacted the PA data obtained; however, sensitivity analyses removing those reporting more than on average 20, 30 or 60 min/d sport demonstrated that >700 mg was still most strongly associated with bone outcomes, and the impact on results was likely minimal. To provide context to the optimal intensity, activity type was inferred from calibration studies, which include a limited range of activities (e.g., sitting, standing, walking and running at different speeds) and may not represent all of the activities being performed in this intensity range. However, sitting, standing and dynamic physical activities, such as walking and running, make up the majority of waking hours in most people and therefore, contribute to a large portion of daily activity (de Almeida Mendes et al., 2018; Hildebrand et al., 2014).
Whilst 1‐s epochs identify a higher proportion of the sporadic, high‐intensity activity performed by children and adolescents (Aadland et al., 2020), activities, such as jumping, occur over a much shorter time frame. Therefore, the averaging of raw data over 1‐s epochs may still underestimate the existence and intensity of these important osteogenic activities. This underestimation may have also been why associations were non‐significant >1500 mg. Whilst the use of raw acceleration to monitor impact peaks in relation to bone has been demonstrated at the hip (Haapala et al., 2022), future research should investigate whether it is possible to use this approach with wrist‐worn devices, which are less burdensome and have significantly greater wear compliance (Fairclough et al., 2016). The osteogenic indices obtained from analyzing raw data in this way are also not immediately interpretable, making it difficult to translate study findings into an understandable health message. Therefore, raw acceleration calibration studies are also needed to obtain reference acceleration ranges for impact loading and enable translation of findings from studies using this approach. Since changes in height, body composition and movement patterns that occur during maturation can impact accelerometer output (Welk, 2005), raw acceleration calibration studies should also consider whether maturation impacts the acceleration values obtained for a number of activities, and whether maturity‐specific acceleration values should be applied when translating study findings. Whatever future approaches might be employed to analyze raw data, an ability to either translate raw acceleration peaks via calibration studies into meaningful information regarding activity type or make an adjustment for differences in sample population when using algorithms designed to recognize activity type will likely be necessary.
Conclusions
4.1
To conclude, using a more precise, outcome‐specific approach to process and analyze wrist‐worn activity data, we found that ∼10 min/day of activity >700 mg (an intensity equivalent to running ∼10 km/h) (Rowlands et al., 2019) is associated with better bone density, geometry and strength in a population‐based sample of 11–12‐year‐olds. The methods outlined can be easily replicated using open‐source software, enabling associations between PA and bone outcomes to be examined and compared in other samples, which has not been possible with commonly used accelerometry methods. Greater comparability of study findings will help to significantly advance understanding of the PA‐bone dose‐response relationship, which in turn, will enable the provision of clear guidance to parents, schools and policy‐makers as to the most time‐economic recommendations for PA to benefit bone health in children at this critical prevention juncture in the course of life.
CONFLICT OF INTEREST STATEMENT
The authors declare no conflicts of interest.
The reference list from the paper itself. Each links out to its DOI / PubMed record.
- 1Aadland, Eivind , Lars Bo Andersen , Sigmund Alfred Anderssen , Geir Kåre Resaland , and Olav Martin Kvalheim . 2020. “Accelerometer Epoch Setting Is Decisive for Associations Between Physical Activity and Metabolic Health in Children.” Journal of Sports Sciences 38(3): 256–263. 10.1080/02640414.2019.1693320.31735120 · doi ↗ · pubmed ↗
- 2Bailey, D. A. , H. A. Mc Kay , R. L. Mirwald , P. R. E. Crocker , and R. A. Faulkner . 1999. “A Six‐Year Longitudinal Study of the Relationship of Physical Activity to Bone Mineral Accrual in Growing Children: The University of Saskatchewan Bone Mineral Accrual Study.” Journal of Bone and Mineral Research 14(10): 1672–1679. 10.1359/jbmr.1999.14.10.1672.10491214 · doi ↗ · pubmed ↗
- 3Bailey, Robert C. , Jodi Olson , Sara L. Pepper , Janos Porszasz , Thomas J. Barstow , and Dan M. Cooper . 1995. “The Level and Tempo of Children's Physical Activities: An Observational Study.” Medicine & Science in Sports & Exercise 27(7): 1033–1041. 10.1249/00005768-199507000-00012.7564970 · doi ↗ · pubmed ↗
- 4Baquet, Georges , Gareth Stratton , Emmanuel Van Praagh , and Serge Berthoin . 2007. “Improving Physical Activity Assessment in Prepubertal Children with High‐Frequency Accelerometry Monitoring: A Methodological Issue.” Preventive Medicine 44(2): 143–147. 10.1016/j.ypmed.2006.10.004.17157370 · doi ↗ · pubmed ↗
- 5Baxter‐Jones, Adam D. G. , Robert A. Faulkner , Mark R. Forwood , Robert L. Mirwald , and Donald A. Bailey . 2011. “Bone Mineral Accrual From 8 to 30 Years of Age: An Estimation of Peak Bone Mass.” Journal of Bone and Mineral Research 26: 1729–1739. 10.1002/jbmr.412.21520276 · doi ↗ · pubmed ↗
- 6Behringer, Michael , Sebastian Gruetzner , Molly Mc Court , and Joachim Mester . 2014. “Effects of Weight‐Bearing Activities on Bone Mineral Content and Density in Children and Adolescents: A Meta‐Analysis.” Journal of Bone and Mineral Research 29(2): 467–478. 10.1002/jbmr.2036.23857721 · doi ↗ · pubmed ↗
- 7Biggin, Andrew , Julie N. Briody , Kim A. Ramjan , Anna Middleton , M.‐Clare A. Waugh , and Craig F. Munns . 2013. “Evaluation of Bone Mineral Density and Morphology Using p QCT in Children After Spinal Cord Injury.” Developmental Neurorehabilitation 16(6): 391–397. 10.3109/17518423.2012.762590.23477616 · doi ↗ · pubmed ↗
- 8Blew, Robert M. , Vinson R. Lee , Joshua N. Farr , Daniel J. Schiferl , and Scott B. Going . 2014. “Standardizing Evaluation of p QCT Image Quality in the Presence of Subject Movement: Qualitative Versus Quantitative Assessment.” Calcified Tissue International 94(2): 202–211. 10.1007/s 00223-013-9803-x.24077875 PMC 3949118 · doi ↗ · pubmed ↗