Relevance of the correlation between tomography findings and laboratory test results in the accuracy of the diagnosis of pulmonary tuberculosis
Daniel Lopes da Cunha, Maria Lucia Rossetti, Evaldo Teixeira Nunes, Eduardo Bruno Lobato Martins, Aila de Menezes Ferreira, Sariane Coelho Ribeiro

TL;DR
This study shows that CT scans and lab tests together improve the accuracy of diagnosing pulmonary tuberculosis.
Contribution
The study identifies specific CT patterns correlated with lab results in diagnosing pulmonary tuberculosis.
Findings
Small nodules and tree-in-bud patterns on CT scans were more common in confirmed tuberculosis cases.
CT findings like septal thickening and lymph node enlargement correlated with positive lab results.
CT scans showed high predictive values for diagnosing PTB, especially when lab results were inconclusive.
Abstract
To evaluate the correlation between multidetector computed tomography (MDCT) findings and laboratory test results in patients with pulmonary tuberculosis (PTB). A total of 57 patients were evaluated. Patients with suspected PTB were divided into groups according to the final diagnosis (confirmed or excluded), and the groups were compared in terms of sociodemographic variables, clinical symptoms, tomography findings, and laboratory test results. Among the patients with a confirmed diagnosis of PTB, small pulmonary nodules with a peribronchovascular distribution were significantly more common in the patients with a positive sputum smear microscopy result (47.4% vs. 8.3%; p = 0.046), as were a miliary pattern (36.8% vs. 0.0%; p = 0.026), septal thickening (84.2% vs. 41.7%; p = 0.021), and lymph node enlargement (52.6% vs. 8.3%; p = 0.020). Small pulmonary nodules with a centrilobular…
Genes, proteins, chemicals, diseases, species, mutations and cell lines named across the full text — each resolved to its canonical identifier and authoritative record.
Click any figure to enlarge with its caption.
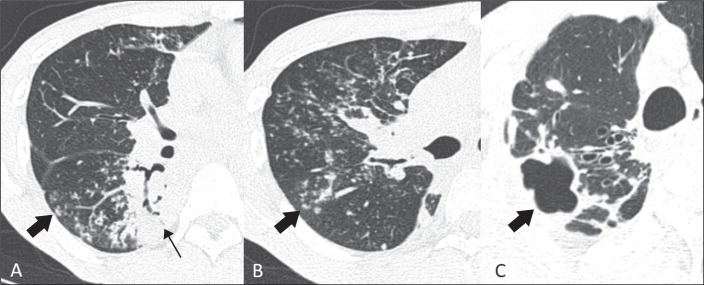 Figure 1
| Variable | Diagnosis of PTB | Total (N = 57) |
| |
|---|---|---|---|---|
| Confirmed (n = 31) | Excluded (n = 26) | |||
| Age (years), mean ± SD | 53.7 ± 19.6 | 47.1 ± 15.9 | 50.7 ± 18.2 | 0.169 |
| Sex, n (%) | 0.105 | |||
| Male | 22 (71.0%) | 13 (50.0%) | 35 (61.4%) | |
| Female | 9 (29,0%) | 13 (50.0%) | 22 (38.6%) | |
| Symptoms, n (%) | ||||
| Cough | 22 (71.0%) | 20 (76.9%) | 42 (73.7%) | 0.611 |
| Expectoration | 9 (29.0%) | 7 (26.9%) | 16 (28.1%) | 0.860 |
| Hemoptysis | 6 (19.4%) | 5 (19.2%) | 11 (19.3%) | 0.991 |
| Chest pain | 6 (19.4%) | 15 (57.7%) | 21 (36.8%) | 0.003 |
| Fever (> 38.5°C) | 19 (61.3%) | 10 (38.5%) | 29 (50.9%) | 0.086 |
| Night sweats | 1 (3.2%) | 5 (19.2%) | 6 (10.5%) | 0.083 |
| Weight loss | 15 (48.4%) | 16 (61.5%) | 31 (54.4%) | 0.321 |
| Dyspnea | 11 (35.5%) | 9 (34.6%) | 20 (35.1%) | 0.945 |
| Characteristic | Diagnosis of TBP | Total (N = 57) n (%) |
| |
|---|---|---|---|---|
| Confirmed (n = 31) n (%) | Excluded (n = 26) n (%) | |||
| Positive sputum smear microscopy result | 19 (61.3%) | 0 (0.0%) | 19 (33.3%) | <0.001 |
| Positive GeneXpert MTB/RIF result | 28 (90.3%) | 0 (0.0%) | 28 (50.0%) | <0.001 |
| Positive culture | 12 (46.2%) | 0 (0.0%) | 12 (23.5%) | <0.001 |
| MDCT findings | ||||
| Small pulmonary nodules (< 10 mm) | 18 (58.1%) | 6 (23.1%) | 24 (42.1%) | 0.008 |
| Centrilobular | 18 (58.1%) | 6 (23.1%) | 24 (42.1%) | 0.008 |
| Perilymphatic | 17 (54.8%) | 5 (19.2%) | 22 (38.6%) | 0.006 |
| Peribronchovascular | 10 (32.3%) | 2 (7.7%) | 12 (21.1%) | 0.023 |
| Septal | 11 (35.5%) | 3 (11.5%) | 14 (24.6%) | 0.036 |
| Subpleural | 14 (45.2%) | 5 (19.2%) | 19 (33.3%) | 0.039 |
| Random (miliary) distribution | 7 (22.6%) | 1 (3.8%) | 8 (14.0%) | 0.059 |
| Tree-in-bud pattern | 22 (71%) | 7 (26.9%) | 29 (50.9%) | 0.001 |
| Large pulmonary nodules (10-30 mm) | 3 (9.7%) | 2 (7.7%) | 5 (8.8%) | 0.999 |
| Lung mass (> 30 mm) | 2 (6.5%) | 0 (0%) | 2 (3.5%) | 0.495 |
| Ground-glass opacity | 14 (45.2%) | 9 (34.6%) | 23 (40.4%) | 0.419 |
| Consolidation | 19 (61.3%) | 7 (26.9%) | 26 (45.6%) | 0.009 |
| Cavitation | 14 (45.2%) | 4 (15.4%) | 18 (31.6%) | 0.016 |
| Bronchial wall thickening | 19 (61.3%) | 4 (15.4%) | 23 (40.4%) | <0.001 |
| Septal thickening | 21 (67.7%) | 10 (38.5%) | 31 (54.4%) | 0.027 |
| Fibrotic opacities/distortion of lung architecture | 23 (74.2%) | 12 (46.2%) | 35 (61.4%) | 0.030 |
| Pleural effusion | 15 (48.4%) | 4 (15.4%) | 19 (33.3%) | 0.008 |
| Lymph node enlargement (short axis > 1 cm) | 11 (35.5%) | 6 (23.1%) | 17 (29.8%) | 0.308 |
| Lymph node enlargement with central necrosis | 2 (6.5%) | 0 (0%) | 2 (3,5%) | 0.495 |
| MDCT findingss | Sputum smear microscopy (n = 31) | GeneXpert MTB/RIF | Culture (n = 26) | ||||||
|---|---|---|---|---|---|---|---|---|---|
| Positive (n = 19) n (%) | Negative (n = 12) n (%) |
| Positive (n = 28) n (%) | Negative (n = 3) n (%) |
| Positive (n = 12) n (%) | Negative (n = 14) n (%) |
| |
| Small pulmonary nodules | 13 (68.4) | 5 (41.7) | 0.141 | 18 (64.3) | 0 (0.0) | 0,064 | 7 (58.3) | 6 (42.9) | 0.431 |
| Centrilobular | 13 (68.4) | 5 (41.7) | 0.130 | 18 (64.3) | 1 (33.3) | 0,543 | 9 (75.0) | 5 (35.7) | 0.045 |
| Perilymphatic | 13 (68.4) | 4 (33.3) | 0.056 | 17 (60.7) | 0 (0.0) | 0,081 | 7 (58.3) | 6 (42.9) | 0.431 |
| Peribronchovascular | 9 (47.4) | 1 (8.3) | 0.046 | 10 (35.7) | 0 (0.0) | 0,533 | 3 (25.0) | 3 (21.4) | 1.000 |
| Septal | 9 (47.4) | 2 (16.7) | 0.128 | 11 (39.3) | 0 (0.0) | 0,535 | 5 (41.7) | 4 (28.6) | 0.683 |
| Subpleural | 11 (57.9) | 3 (25.0) | 0.073 | 14 (50.0) | 0 (0.0) | 0,232 | 7 (58.3) | 4 (28.6) | 0.126 |
| Random (miliary) distribution | 7 (36.8) | 0 (0.0) | 0.026 | 7 (25.0) | 0 (0.0) | 1,000 | 4 (33.3) | 2 (14.3) | 0.365 |
| Tree-in-bud pattern | 16 (84.2) | 6 (50.0) | 0.056 | 21 (75.0) | 1 (33.3) | 0,195 | 11 (91.7) | 6 (42.9) | 0.014 |
| Large pulmonary nodules (10-30 mm) | 3 (15.8) | 0 (0.0) | 0.265 | 3 (10.7) | 0 (0.0) | 1,000 | 2 (16.7) | 1(7-1) | 0.580 |
| Lung mass (> 30 mm) | 0 (0.0) | 2 (16.7) | 0.142 | 2 (7.1) | 0 (0.0) | 1,000 | 0 (0.0) | 2 (14.3) | 0.483 |
| Ground-glass opacity | 10 (52.6) | 4 (33.3) | 0.293 | 14 (50.0) | 0 (0.0) | 0,232 | 7 (58.3) | 6 (42.9) | 0.431 |
| Consolidation | 13 (68.4) | 6 (50.0) | 0.452 | 18 (64.3) | 1 (33.3) | 0,543 | 9 (75.0) | 7 (50.0) | 0.248 |
| Cavitation | 11 (57.9) | 3 (25.0) | 0.073 | 12 (42.9) | 2 (66.7) | 0,576 | 8 (66.7) | 4 (28.6) | 0.052 |
| Bronchial wall thickening | 13 (68.4) | 6 (50.0) | 0.452 | 18 (64.3) | 1 (33.3) | 0,543 | 9 (75.0) | 7 (50.0) | 0.248 |
| Septal thickening | 16 (84.2) | 5 (41.7) | 0.021 | 19 (67.9) | 2 (66.7) | 1,000 | 10 (83.3) | 9 (64.3) | 0.391 |
| Fibrotic opacities | 14 (73.7) | 9 (75.0) | 1.000 | 20 (71.4) | 3 (100.0) | 0,550 | 10 (83.3) | 11 (78.6) | 1.000 |
| Pleural effusion | 10 (52.6) | 5 (41.7) | 0.552 | 14 (50.0) | 1 (33.3) | 1,000 | 6 (50.0) | 6 (42.9) | 0.716 |
| Lymph node enlargement | 10 (52.6) | 1 (8.3) | 0.020 | 10 (35.7) | 1 (33.3) | 1,000 | 5 (41.7) | 5 (35.7) | 1.000 |
| Lymph node enlargement with central necrosis | 2 (10.5) | 0 (0.0) | 0.510 | 2 (7.1) | 0 (0.0) | 1,000 | 0 (0.0) | 2 (14.3) | 0.483 |
| MDCT findings | Sen. | Spe. | VPP | VPN |
|---|---|---|---|---|
| Small pulmonary nodules | 58.1 | 76.9 | 75.0 | 60.6 |
| Centrilobular | 61.3 | 80.8 | 79.2 | 63.6 |
| Perilymphatic | 54.8 | 80.8 | 77.3 | 60.0 |
| Peribronchovascular | 32.3 | 92.3 | 83.3 | 53.3 |
| Septal | 35.5 | 88.5 | 78.6 | 53.5 |
| Subpleural | 45.2 | 80.8 | 73.7 | 55.3 |
| Random distribution (miliary) | 22.6 | 96.1 | 87.5 | 51.0 |
| Tree-in-bud pattern | 71.0 | 73.1 | 75.9 | 67.9 |
| Large pulmonary nodules (10-30 mm) | 9.7 | 92.3 | 60.0 | 46.1 |
| Lung mass (> 30 mm) | 6.4 | 100.0 | 100.0 | 47.3 |
| Ground-glass opacity | 45.2 | 65.4 | 60.9 | 50.0 |
| Consolidation | 61.3 | 73.1 | 73.1 | 61.3 |
| Cavitation | 45.2 | 84.6 | 77.8 | 56.4 |
| Bronchial wall thickening | 61.3 | 84.6 | 82.6 | 64.7 |
| Septal thickening | 67.7 | 61.5 | 67.7 | 61.5 |
| Fibrotic opacities | 74.2 | 53.8 | 65.7 | 63.6 |
| Pleural effusion | 48.4 | 84.6 | 78.9 | 57.9 |
| Lymph node enlargement | 35.5 | 76.9 | 64.7 | 50.0 |
| Lymph node enlargement with central necrosis | 6.4 | 100.0 | 100.0 | 47.3 |
Peer Reviews
No public reviews on file for this paper yet. If you reviewed it on a platform where reviews are public (OpenReview, ICLR, NeurIPS, ICML), you can paste yours below so the community can read it here.
Videos
No videos yet. Explain this paper in a talk, walkthrough, or lecture? Add one.
Taxonomy
TopicsTuberculosis Research and Epidemiology · Mycobacterium research and diagnosis · Diagnosis and treatment of tuberculosis
INTRODUCTION
Tuberculosis is an airborne disease caused by Mycobacterium tuberculosis^(1)^. In 2021, approximately 10 million people worldwide contracted tuberculosis; of those, 1.3 million died, with 214,000 of those deaths occurring among HIV-infected individuals^(2)^. The greatest difficulties faced in combating tuberculosis have been delays in diagnosis and in the start of treatment^(3)^, despite the fact that the treatment is affordable and effective^(4)^.
The coronavirus pandemic of 2020 and 2021 had enormous health, social, and economic impacts, limiting the availability of and access to essential services for the diagnosis and treatment of tuberculosis^(2)^. Failure to diagnose and treat affected patients in a timely manner leads to increased morbidity and mortality, the development of secondary resistance, and continued transmission of the disease^(5)^.
Although sputum smear microscopy provides benefits in terms of cost and time, it has low sensitivity^(6)^-from 22-43% for a single smear up to 60% under optimal conditions-in comparison with sputum culture^(7)^. The GeneXpert MTB/RIF test, which is a rapid molecular test for M. tuberculosis and for rifampin resistance, uses polymerase chain reaction (PCR) to detect M. tuberculosis by the nucleic acid amplification method, providing results in approximately two hours^(6)^. In cases of smear-positive and smear-negative pulmonary tuberculosis (PTB), the GeneXpert MTB/RIF test has a sensitivity of 98.2% and 72.5%, respectively^(7)^. Despite being the gold standard for detecting and diagnosing PTB, sputum culture does not provide a quick diagnosis, taking four to eight weeks to provide a result^(6,8)^. In comparison with chest X-ray, multidetector computed tomography (MDCT) of the chest is more sensitive and better facilitates the differential diagnosis of lung parenchymal lesions, as well as allowing a more accurate assessment of disease activity and complications^(9)^. Therefore, MDCT constitutes a particularly valuable method for use in smear-negative patients with suspected PTB^(10)^.
The role of MDCT in managing treatment and investigating complications in patients with PTB is well recognized. However, there have been few studies of the correlation between the main tomography findings described in patients with PTB and the results of diagnostic laboratory tests. There have also been few studies describing the predictive values of the main tomography findings in patients with PTB and their importance in the management of the disease, especially in areas where it is highly prevalent and there are few public resources to combat it.
This primary objective of this study was to evaluate the correlation between MDCT findings and laboratory test results in patients with suspected PTB and to demonstrate that MDCT presents reliable predictive measures for the diagnosis of the disease.
MATERIALS AND METHODS
This was a cross-sectional analytical study, designed to evaluate the relationship between MDCT findings and laboratory test results in patients with PTB. The study was carried out between September 2018 and March 2020 in the Imaging Department of the Hospital Universitário da Universidade Federal do Piauí (HU-UFPI), in the city of Teresina, Brazil.
We evaluated 67 patients with suspected PTB who presented one or more of the following symptoms: cough (dry or productive); hemoptysis; chest pain; and constitutional symptoms, such as weight loss, fever (> 38.5°C), night sweats, and dyspnea. Patients who did not undergo chest MDCT or laboratory tests for diagnosis were excluded, as were those who were currently undergoing or had previously undergone treatment for PTB. The final sample comprised 57 patients. The study was approved by the HU-UFPI Research Ethics Committee (Reference no. 2,878,866-2018), and all participating patients gave written informed consent.
Chest MDCT was performed in a 16-slice scanner (Somatom Emotion 16; Siemens Healthineers, Erlangen, Germany). The MDCT findings were analyzed by a radiologist with 18 years of experience, working independently, who was blinded to the clinical symptoms and laboratory test results. The scans were evaluated for the presence or absence and extent of the following findings (Figure 1): small pulmonary nodules (< 10 mm); a tree-in-bud pattern; large pulmonary nodules (10-30 mm); pulmonary mass (> 30 mm); ground-glass opacity; consolidation; cavitation; bronchial wall thickening; septal thickening; fibrotic opacities distorting the pulmonary architecture; pleural effusion; mediastinal lymph node enlargement (short axis > 10 mm); and mediastinal lymph node enlargement with central necrosis.
Figure 1. Main MDCT findings related to PTB. A: Consolidation (thin arrow), characterized by increased attenuation of the lung parenchyma, which prevents visualization of the vessels and the external contours of the bronchial walls, although air bronchograms can be seen. Note the tree-in-bud pattern (thick arrow), characterized by centrilobular branching opacities, with small nodulations at the ends, resembling the sprouting of trees and indicative of dilated bronchioles filled with pathological material. B: Centrilobular nodular pattern (arrow). Distribution of small nodules occupying the central portion of the secondary pulmonary lobule, typically related to bronchiolar disease. (If this is accompanied by a tree-in-bud pattern, infectious causes should be considered.) C: Cavitation (arrow), characterized by a gas-filled space, with or without an air-fluid level, within a pulmonary consolidation, with irregular contours and a thickness of more than 1 mm.
Sputum smear microscopy and molecular tests, including the GeneXpert MTB/RIF test and culture on solid medium, were carried out following the recommendations of the Brazilian National Ministry of Health^(11)^. Patients were considered to have a confirmed diagnosis of PTB if they had two positive sputum smear microscopy results; a positive sputum smear microscopy result and a positive culture; a positive sputum smear microscopy result and radiological imaging findings suggestive of PTB; or a negative sputum smear microscopy result and a positive molecular test or positive culture. Patients with suspected PTB were divided into two groups-those with and without a confirmed diagnosis-and the two groups were compared in terms of sociodemographic variables, clinical symptoms, and MDCT findings. Patients with confirmed PTB were divided into groups according to the result (positivity or negativity) on each laboratory test (sputum smear microscopy, molecular test, and culture), and the relationships between the frequency of MDCT findings and positivity on those tests were analyzed. The sensitivity, specificity, positive predictive value (PPV), and negative predictive value (NPV) of the main MDCT findings were also calculated.
In the inferential analysis, we correlated each MDCT finding with each laboratory test result, using Pearson’s chi-square test or Fisher’s exact test for frequency trends. Values of p < 0.05 were considered statically significant. In the analysis of the sensitivity, specificity, PPV, and NPV of the MDCT findings, we used the Analyse-it program.
RESULTS
In our sample of patients with suspected PTB, the mean age was 50.7 ± 18.2 years (range, 21.3-89.0 years). Of the 57 patients evaluated, 35 (61.4%) were men. The diagnosis of PTB was confirmed in 31 (54.4%) of the patients, 22 (71.0%) of whom were male. However, as shown in Table 1, there was no significant association between gender and the occurrence of PTB (p = 0.105).
Table 1: Sociodemographic characteristics and clinical symptoms of patients with suspected PTB.
The frequency of symptoms was higher among the patients with a confirmed diagnosis of PTB than among those without: expectoration (29.0% vs. 26.9%), hemoptysis (19.4% vs. 19.2%), fever (61.3% vs. 38.5%) and dyspnea (35.5% vs. 34.6%). However, the only significant difference was related to the symptom of chest pain, which was more common among those in whom a diagnosis of PTB was ruled out (57.7% vs. 19.4%; p = 0.003).
Of the 31 patients with a confirmed diagnosis of PTB, 19 (61.3%) had a positive sputum smear microscopy result, 28 (90.3%) had a positive GeneXpert MTB/RIF test result, and 14 (46.2%) had a positive culture for M. tuberculosis (Table 2).
The following findings were significantly more common among the patients with a confirmed diagnosis of PTB than among those without (Table 2): small pulmonary nodules (58.1% vs. 23.1%; p = 0.008), consolidation (61.3% vs. 26.9%; p = 0.009), cavitation (45.2% vs. 15.4%; p = 0.016) and a tree-in-bud pattern (71.0% vs. 26.9%; p = 0.001). Among the patients with small pulmonary nodules, centrilobular nodules were more common in those with a confirmed diagnosis of PTB (58.1% vs. 23.1%; p = 0.008).
Table 3 compares the patients in relation to the MDCT findings, by the results of the laboratory tests. The following findings were significantly more common among the patients who were smear-positive than among those who were smear-negative: small pulmonary nodules with a peribronchovascular distribution (47.4% vs. 8.3%; p = 0.046); small pulmonary nodules with a miliary pattern (36.8% vs. 0.0%; p = 0.026); septal thickening (84.2% vs. 41.7%; p = 0.021); and lymph node enlargement (52.6% vs. 8.3%; p = 0.020). None of the MDCT findings were significantly associated with positivity on the GeneXpert MTB/RIF test (p > 0.05 for all). Small pulmonary nodules with a centrilobular distribution were significantly more common among the patients who were culture-positive than among those who were culture-negative (75.0% vs. 35.7%; p = 0.045), as was a tree-in-bud pattern (91.7% vs. 42.9%; p = 0.014).
Table 3: Comparison of the frequencies of MDCT findings in patients diagnosed with PTB, by the results of laboratory tests
In the predictive analysis, individual MDCT findings were found to have the following sensitivity, specificity, PPV, and NPV, respectively, for a diagnosis of PTB (Table 4): a tree-in-bud pattern (71.0%, 73.1%, 75.9%, and 67.9%); small centrilobular pulmonary nodules (61.3%, 80.8%, 79.2%, and 63.6%); cavitation (45.2%, 84.6%, 77.8%, and 56.4%); and consolidation (61.3%, 73.1%, 73.1%, and 61.5%).
DISCUSSION
Of the 31 patients with a confirmed diagnosis of PTB in our study, 19 (61.3%) were smear-positive, within the range of what would be expected, given that sputum smear microscopy has a sensitivity of approximately 60% under ideal conditions^(6)^. We observed a high proportion of patients with a positive PCR result (90.3%), which confirms the high sensitivity of the GeneXpert MTB/RIF test, which has been reported to be up to 98.2% in cases of smear-positive PTB and 72.5% in cases of smear-negative PTB^(7,12-14)^.
The main tomography findings described as being related to active PTB are consolidation, cavitation, small centrilobular pulmonary nodules, and a tree-in-bud pattern, the last two being consistent with endobronchial dissemination of the disease^(14)^. In the present study, small centrilobular pulmonary nodules, a tree-in-bud pattern, consolidation, and cavitation correlated significantly with a confirmed diagnosis of PTB. These findings corroborate data in the literature indicating that MDCT can be used as a means of diagnosing active PTB^(15)^.
The identification of patients with positive smear microscopy results through tomography studies would facilitate the effective isolation of these patients, who should be a high priority in PTB control policies. In the present study, we found that a positive smear microscopy result was significantly associated with the frequency of small pulmonary nodules (with peribronchovascular distribution or a miliary pattern), septal thickening, and lymph node enlargement, none which are classically described in patients with smear-positive active PTB.
Among the patients in our sample with a confirmed diagnosis of PTB who were smear-negative, we observed small centrilobular pulmonary nodules in 41.7%, a tree-in-bud pattern in 50.0%, consolidation in 50.0%, and cavitation in 25.0%, compared with 68.4%, 84.2%, and 57.9%, respectively, for those who were smear-positive, demonstrating that tomography findings typical of PTB are less pronounced when the sputum smear microscopy result is negative, which translates to a lower mycobacterial load. Because patients who are smear-negative have a lower mycobacterial load, they may not present with the clinical and radiographic findings that are typical of PTB^(14)^. Among patients with high suspicion of active PTB who are smear-negative, MDCT can facilitate the selection of candidates for additional laboratory tests or bronchoscopy, and in some cases the decision of whether to initiate antituberculosis therapy while awaiting the culture results^(16)^, especially for patients in whom there are MDCT findings that are typical of PTB, even if there are only a few such findings.
Yeh et al.^(15)^ evaluated the use of CT to predict culture-positive PTB in 4,140 adult patients with pulmonary lesions, using a set of tomography findings and their pattern of distribution in the lung parenchyma. The authors found CT to have a sensitivity, specificity, PPV, and NPV for predicting a positive culture of 98.5%, 99.7%, 92.2%, and 99.9%, respectively. Their data indicate that CT is a viable tool for identifying culture-positive PTB in an emergency setting.
Ko et al.^(17)^ evaluated the correlation between microbiology findings and radiographic activity on chest CT in patients with suspected PTB. The authors found radiographic activity (cavitation, a tree-in-bud pattern, and multiple noncalcified nodules, collectively) to have high specificity (97.1%) and a high NPV (92.7%). In the present study, we evaluated each of the main MDCT findings in isolation and found that, for the diagnosis of active PTB, a tree-in-bud pattern had high sensitivity (71.0%); and small centrilobular pulmonary nodules, a tree-in-bud pattern, consolidation, and especially cavitation all had high specificity (80.8%, 73.1%, 73.1%, and 84.6%, respectively), with PPVs of 79.2%, 75.9%, 73.1%, and 77.8%, respectively.
We found that MDCT presented reliable predictive measures for the main tomography findings in the diagnosis of PTB, therefore being a safe tool for diagnosing the disease in patients with clinical suspicion of the disease, especially when a specific set of characteristic tomography findings (small pulmonary nodules, a tree-in-bud pattern, consolidation, and cavitation) is found in patients residing in an area of high PTB prevalence. The use of MDCT can enable prompt initiation of drug treatment, reducing the mortality associated with the disease and minimizing its spread within the community.
Our study has certain limitations, including the small sample size, which can limit the generalizability of the results. In addition, the retrospective nature of the study limited its ability to identify temporal changes. Furthermore, all MDCT scans were evaluated by the same observer and that singular perspective could have influenced the conclusions. These limitations should be considered when interpreting the results, underscoring the need for future research to address these issues and provide a more comprehensive view of the topic.
CONCLUSION
MDCT proved useful in the diagnosis of PTB. It also appears to be a suitable tool for selecting candidates for more complex, invasive examinations from among smear-negative patients in whom there is a high suspicion of PTB.
The reference list from the paper itself. Each links out to its DOI / PubMed record.
- 1Fogel N. Tuberculosis: a disease without boundaries Tuberculosis (Edinb)2015955275312619811310.1016/j.tube.2015.05.017 · doi ↗ · pubmed ↗
- 2World Health Organization Global tuberculosis report 2021 Geneva World Health Organization 2021
- 3Cudahy P Shenoi SV. Diagnostics for pulmonary tuberculosis Postgrad Med J 2016921871932700527110.1136/postgradmedj-2015-133278 PMC 4854647 · doi ↗ · pubmed ↗
- 4World Health Organization Global tuberculosis report 2018 Geneva World Health Organization 2018
- 5Iram S Zeenat A Hussain S Rapid diagnosis of tuberculosis using Xpert MTB/RIF assay - report from a developing country Pak J Med Sci 2015311051102587862410.12669/pjms.311.6970 PMC 4386167 · doi ↗ · pubmed ↗
- 6Jeong YJ Lee KS Yim JJ. The diagnosis of pulmonary tuberculosis: a Korean perspective Precis Future Med 201717787
- 7Singhal R Myneedu VP. Microscopy as a diagnostic tool in pulmonary tuberculosis Int J Mycobacteriol 20154162665519110.1016/j.ijmyco.2014.12.006 · doi ↗ · pubmed ↗
- 8Nyaruaba R Mwaliko C Kering KK Droplet digital PCR applications in the tuberculosis world Tuberculosis (Edinb)201911785923137827410.1016/j.tube.2019.07.001 · doi ↗ · pubmed ↗