Consistent decrease in conifer embolism resistance from the stem apex to base resulting from axial trends in tracheid and pit traits
Dario Zambonini, Tadeja Savi, Sabine Rosner, Giai Petit

TL;DR
This study shows that conifer trees have decreasing resistance to drought-induced embolism from the top of the stem to the base due to changes in tracheid and pit traits.
Contribution
The paper reveals a novel structure-function relationship between axial anatomical traits and embolism vulnerability in conifers.
Findings
Tracheid hydraulic diameter and pit membrane area increase with distance from the stem apex.
P50 values decrease by over 3 MPa from the treetop to the base of the stem.
The strongest variation in hydraulic traits occurs within the first 1.5 meters from the apex.
Abstract
Drought-induced embolism formation in conifers is associated with several tracheid and pit traits, which vary in parallel from stem apex to base. We tested whether this axial anatomical variability is associated with a progressive variation in embolism vulnerability along the stem from apex to base. We assessed the tracheid hydraulic diameter (Dh), mean pit membrane area (PMA) and the xylem pressure at 50% loss of conductivity (P50) on longitudinal stem segments extracted at different distances from the stem apex (DFA) in a Picea abies and an Abies alba tree. In both trees, Dh and PMA scaled with DFA 0.2. P50 varied for more than 3 MPa from the treetop to the stem base, according to a scaling of -P50 with DFA-0.2 . The largest Dh, PMA and P50 variation occurred for DFA<1.5 m. PMA and Dh scaled more than isometrically (exponent b=1.2). Pit traits vary proportionally with tracheid lumen…
Genes, proteins, chemicals, diseases, species, mutations and cell lines named across the full text — each resolved to its canonical identifier and authoritative record.
Click any figure to enlarge with its caption.
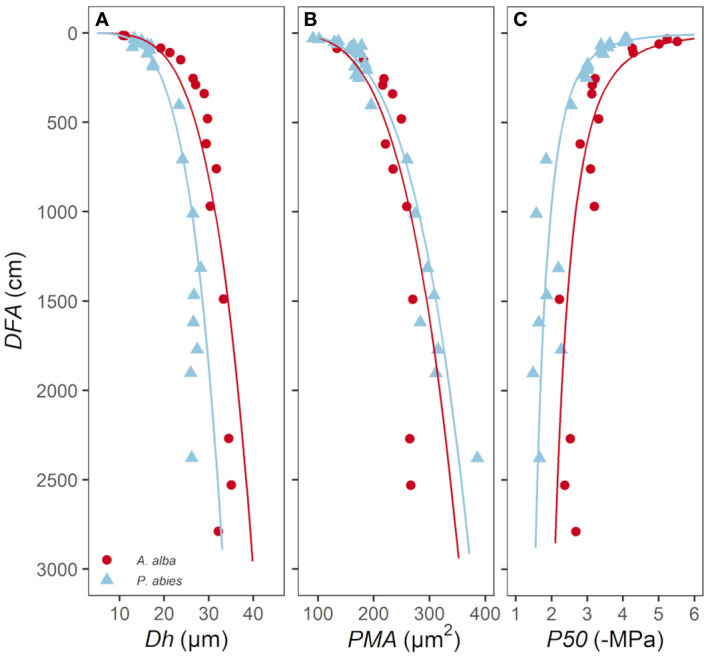 Figure 1
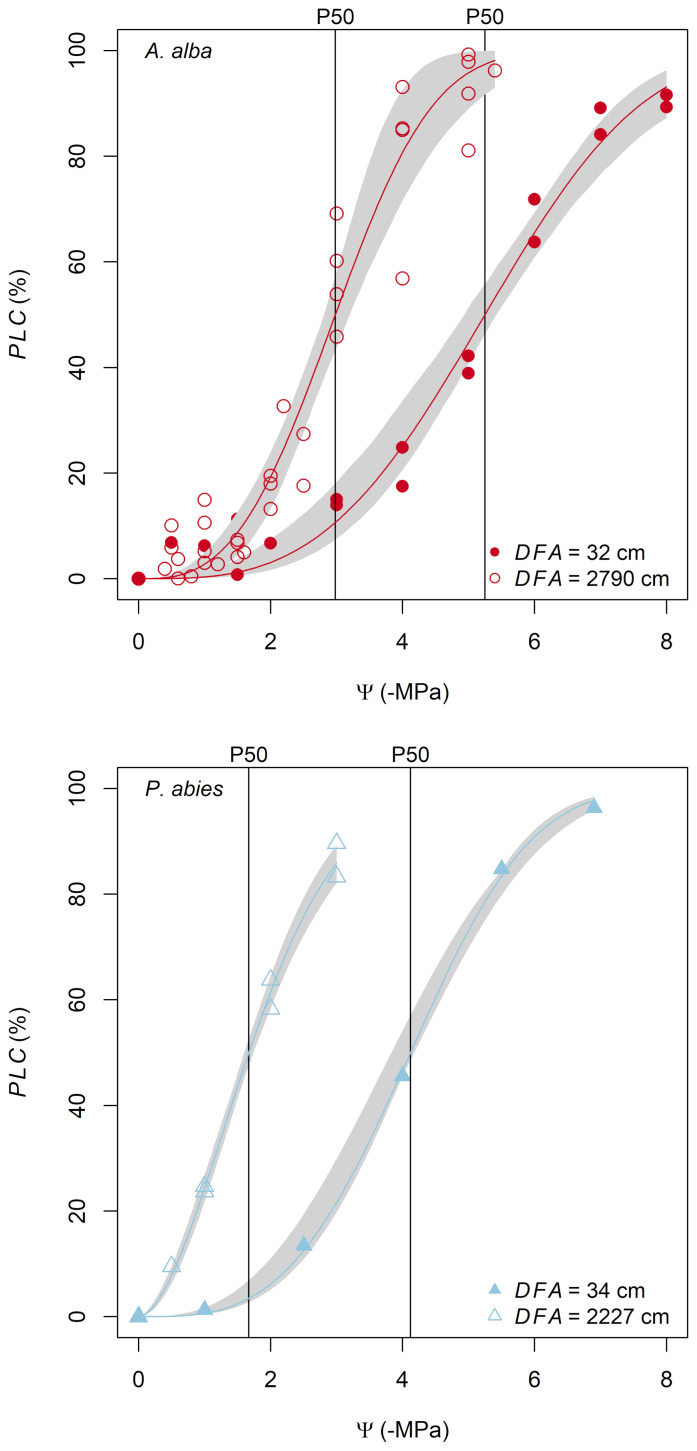 Figure 2
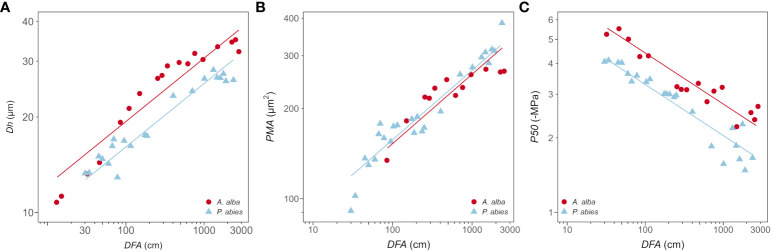 Figure 3
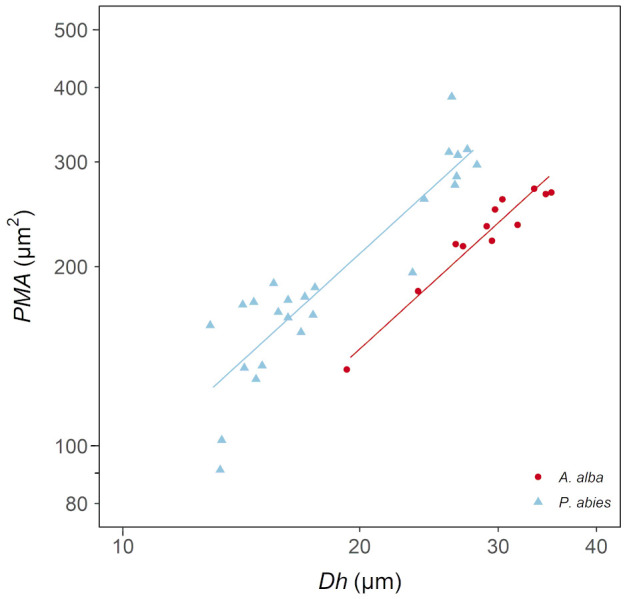 Figure 4
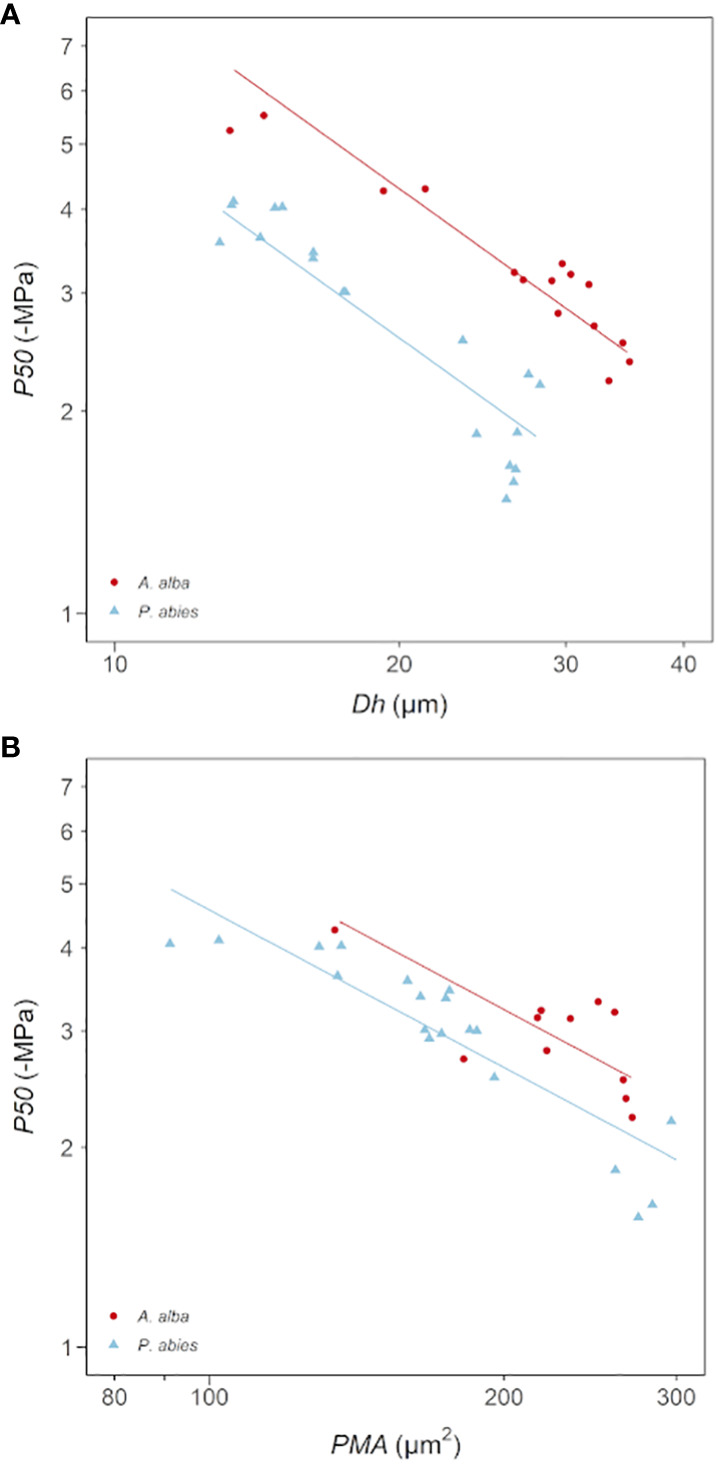 Figure 5
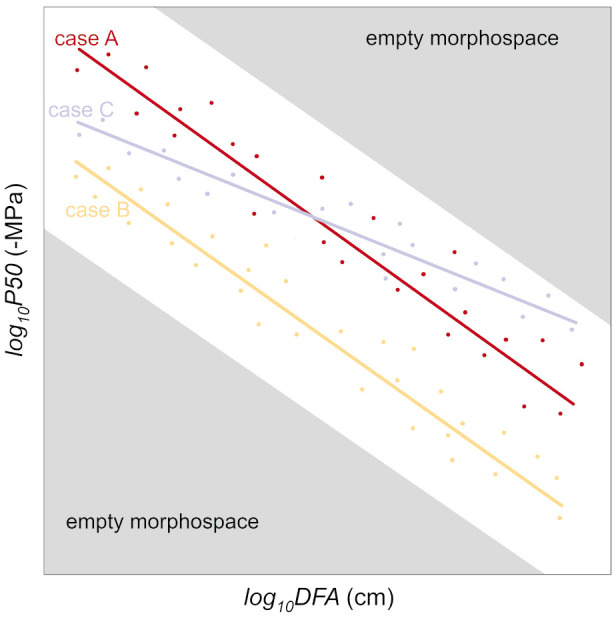 Figure 6
| Acronym | Unit | Description |
|---|---|---|
|
| cm | Axial distance from the stem (or branch) apex |
| Anatomical variables | ||
|
| µm | Hydraulically weighted mean tracheid diameter ( |
|
| µm2 | Average circular area of tracheid pits |
| Hydraulic variables | ||
|
| % | Percent loss of sample conductance |
|
| MPa | Xylem pressure at which PLC=50% |
| A | Model: | |||||
|---|---|---|---|---|---|---|
| fixed effects | Value | Std. error | DF | t value | p value | |
|
| 0.89 | 0.03 | 36 | 33.36 | <0.0001 | |
|
| 0.20 | 0.01 | 36 | 19.75 | <0.0001 | |
|
| -0.08 | 0.01 | 36 | -5.74 | <0.0001 | |
|
| ||||||
|
| Model: | |||||
| Fixed effects | Value | Std. error | DF | t value | p value | |
|
| 1.72 | 0.04 | 34 | 40.96 | <0.0001 | |
|
| 0.23 | 0.01 | 34 | 16.01 | <0.0001 | |
|
| 0.01 | 0.02 | 34 | 0.71 | 0.4796 | |
|
| ||||||
|
| Model: | |||||
| Fixed effects | Value | Std. error | DF | t value | p value | |
|
| 1.06 | 0.03 | 36 | 32.58 | <0.0001 | |
|
| -0.21 | 0.01 | 36 | -17.41 | <0.0001 | |
|
| -0.13 | 0.01 | 36 | -8.51 | <0.0001 | |
|
| ||||||
| Model: | |||||
|---|---|---|---|---|---|
| Fixed effects | Value | Std. error | DF | t value | p value |
|
| 0.60 | 0.13 | 34 | 4.45 | <0.0001 |
|
| 1.20 | 0.09 | 34 | 13.25 | <0.0001 |
|
| 0.16 | 0.03 | 34 | 5.98 | <0.0001 |
|
| |||||
| A | Model: | |||||
|---|---|---|---|---|---|---|
| Fixed effects | Value | Std. error | DF | t value | p value | |
|
| 1.95 | 0.11 | 31 | 18.01 | <0.0001 | |
|
| -1.01 | 0.08 | 31 | -13.36 | <0.0001 | |
|
| -0.22 | 0.02 | 31 | -10.31 | <0.0001 | |
|
| ||||||
|
| Model: | |||||
| Fixed effects | Value | Std. error | DF | t value | p value | |
|
| 2.33 | 0.17 | 31 | 13.72 | <0.0001 | |
|
| -0.79 | 0.07 | 31 | -11.02 | <0.0001 | |
|
| -0.09 | 0.02 | 31 | -3.92 | <0.0001 | |
|
| ||||||
Peer Reviews
No public reviews on file for this paper yet. If you reviewed it on a platform where reviews are public (OpenReview, ICLR, NeurIPS, ICML), you can paste yours below so the community can read it here.
Videos
No videos yet. Explain this paper in a talk, walkthrough, or lecture? Add one.
Taxonomy
TopicsPeriodontal Regeneration and Treatments · Oral microbiology and periodontitis research · Oral and gingival health research
Introduction
Increasing drought-related tree mortality is a global ecological crisis that demands urgent action from the scientific community. Trees most commonly die from xylem dysfunction by gas-embolism, causing strong limitations to leaf water supply, transpiration, and photosynthesis (Adams et al., 2017; Choat et al., 2018; Savi et al., 2019; Hammond, 2020). Interdisciplinary efforts are necessary to develop risk assessments that identify species-specific vulnerability to drought, enabling a better prediction of climate change impacts on forest ecosystems and global biogeochemical cycles.
The mechanism of drought-induced embolism formation
Water moves from roots to leaves following gradients of sub-atmospheric pressure and flows through adjacent vascular conduits. Cohesion and adhesion forces between water molecules and xylem conduit walls maintain the liquid phase of water under tension (Tyree and Zimmermann, 2002). Xylem sap contains tiny gas bubbles (Schenk et al., 2016) that can cause embolization of the xylem conduit when exceeding a critical bubble diameter (Cochard, 2006). Bordered pits, which connect adjacent vascular elements (vessels, tracheids, and fibers in angiosperms; only tracheids in gymnosperms), serve as a barrier to prevent the entry of large air bubbles into functional elements. The anatomical properties of these pits play a crucial role in determining the vulnerability of xylem to drought-induced embolism formation (Bouche et al., 2014; Lens et al., 2022).
Bordered pits in angiosperms have simple homogeneous membranes with tiny pore constrictions, while pits of most conifers have a larger membrane structure with an outer permeable area (margo) and an inner, impermeable disc (torus) larger than the pit aperture. In conifers, when a gas bubble expands and embolizes a tracheid, the pit membranes get aspirated towards the functional conduit due to the pressure difference between the embolized and the functional tracheid (Tyree and Zimmermann, 2002). Consensus among plant physiologists indicates that drought induced embolization in conifer tracheids predominantly occurs through air-seeding. This process involves air from an already embolized tracheid protruding into an adjacent functional tracheid, forcing the displacement of the torus due to excessive tension (Delzon et al., 2010). The margo flexibility and the ratio of torus to pit aperture diameter (i.e., the torus overlap) contribute to a valve effect that seals the pit aperture of the functional tracheid when neighboring tracheids become embolized (Delzon et al., 2010; Bouche et al., 2014).
The estimation of embolism vulnerability is commonly done by measuring the percent loss of xylem hydraulic conductivity (PLC) at a specific xylem tension. The contribution of pits to the overall conduit conductance depends on various factors, including the number of pits, their size, and their membrane permeability. Previous studies have suggested that lumen and end-wall resistances contribute approximately 40% and 60%, respectively, to the total xylem resistance, irrespective of conduit size, in both angiosperms and gymnosperms (Sperry et al., 2006). This finding implies the existence of consistent relationships between lumen diameter and pit anatomical traits (Becker et al., 2003; Schulte, 2012; Lazzarin et al., 2016). However, it is important to note that similar levels of extra-lumen resistance can be achieved through different combinations of traits. In angiosperms, resistance is primarily influenced by the type and number of perforation plates per vessel, as well as the density, area, and permeability of pit membranes, and the presence of vestures. In conifers, resistance is determined by the density and area of pits, the permeability and area of the margo, and the size of the aperture area.
The resistance against drought-induced embolism formation is primarily determined by key pit traits (Delzon et al., 2010; Bouche et al., 2014), leading to a trade-off between hydraulic efficiency and safety (Pittermann et al., 2006). Although this trade-off should be expected to occur mainly at the individual or intra-specific level, it has often been investigated at the interspecific level. One reason why global analyses have failed to provide robust empirical support for the hydraulic efficiency-safety trade-off is the oversight of species-specific combinations of lumen and pit traits (Gleason et al., 2016). Additionally, these types of meta-analyses involve the association of hydraulic and anatomical data obtained using different methods and sampling approaches, such as sampling at fixed branch age or diameter.
These approaches, which are still most commonly used by plant physiologists, do not consider the patterns of variation in anatomical traits that have recently been clearly demonstrated (see the next section). In the last decade, significant progress has been made to advancing technical capabilities and improving measurement protocols for assessing xylem vulnerability to drought-induced embolism (Cochard et al., 2013; Johnson et al., 2022). However, the contemporary advances in understanding the variability of different xylem anatomical traits and their covariation at individual, intra-specific, and interspecific levels have not received the deserved attention, even though some studies already provided evidence that the xylem vulnerability to drought-induced embolism formation strongly increases axially along the stem from the treetop to the base (Domec and Gartner, 2001).
The xylem anatomical traits vary axially from the stem apex to base
It has been widely demonstrated that leaves and roots are hydraulically connected through the xylem transport system, with vascular conduits being narrowest at the distal end of the hydraulic path and progressively widening basally along the leaf venation network (Lechthaler et al., 2020) and further down along the outermost, youngest, and longest xylem layer in the stem (Anfodillo et al., 2013). Belowground, vascular conduits along the roots are generally wider than those in the stem (McElrone et al., 2004; Petit et al., 2009, 2010; Jacobsen et al., 2018).Unlike stem conduits, the pattern of axial widening in roots is highly variable (Prendin et al., 2018). The limited research on this topic has not suggested a clear convergence toward a general pattern.
In the stem, the pattern of widening is consistently repeated every year of growth (Petit et al., 2023) and also occurs radially from the innermost to the outer xylem layers due to continuous height growth during ontogeny (Carrer et al., 2015). Notably, the axial distance from the distal apex (DFA) is the best predictor of conduit diameter, according to a power scaling relationship (*Y=a×X^b^ *) with an exponent that is nearly invariant at the individual level (Prendin et al., 2018; Petit et al., 2023) and varies only slightly across species (Anfodillo et al., 2013; Koçillari et al., 2021).
Moreover, studies in conifers have reported significant relationships between tracheid lumen diameter and other anatomical features, such as cell wall thickness (Sperry et al., 2006; Bouche et al., 2014; Prendin et al., 2018), tracheid length and number, chamber aperture, torus areas of pits (Becker et al., 2003; Sperry et al., 2006; Lazzarin et al., 2016; Held et al., 2021), torus overlap, and margo flexibility (Delzon et al., 2010; Song et al., 2022). Coherently, a few studies showed that pit traits vary axially along the stem seemingly to conduit diameter (Schulte, 2012; Lazzarin et al., 2016).
Despite the importance of these allometric relationships for xylem hydraulic efficiency and embolism resistance, they have seldom been investigated and rarely considered in physiological studies.
The limited knowledge on axial variation in xylem hydraulic traits
Although xylem hydraulic traits are commonly investigated on small plants or at the level of distal branches in mature trees, yet it remains not fully investigated whether these trait variations at the individual level can be explained by known patterns of xylem anatomical traits, such as the scaling of conduit diameter or pit properties with DFA. The limited investigations on mature trees have shown apparently contradictive results. Some studies reported embolism vulnerability to be lower in terminal twigs than in the stem bole (Domec and Gartner, 2001; Spicer and Gartner, 2001; Domec et al., 2009b; Rosner et al., 2019b). An analysis conducted on Pseudotsuga menziesii (Mirb.) Franco reported that the water potential corresponding to 50% loss of xylem hydraulic conductivity (P50) decreased from -3.3 MPa at the stem base to -4.7 MPa at the level of the fifth internode starting from the stem apex (Domec and Gartner, 2001). Furthermore, P50 was observed to decrease with sapwood depth (Spicer and Gartner, 2001) or being higher at the base of tall trees compared to short trees (Spicer and Gartner, 2001; Olson et al., 2018). In parallel, xylem specific conductivity (ks) was reported to increase basally along the stem from the apex downwards and from inner to outer sapwood (Spicer and Gartner, 2001; Domec et al., 2012). On the contrary, a recent investigation found that narrow branches exhibit lower vulnerability compared to the stem, which showed no variation in vulnerability across longitudinal segments of the outermost sapwood extracted at different heights along the main trunk of mature trees (Bouche et al., 2016). Furthermore, in a few temperate broadleaved species the xylem specific hydraulic conductivity was reported to be lower in apical branches than in roots, consistent with anatomical differences, whereas the embolism vulnerability resulted similar between these organs (Lübbe et al., 2022).
Instead, other studies reported individual variability in embolism vulnerability in small plants (of ~ 1 m height) that did not align with commonly observed trends in anatomical traits. For instance, the estimated P50 in saplings was noted to be rather comparable between stems and roots in certain broadleaved species (Creek et al., 2018; Rodriguez-Dominguez et al., 2018), or even lower (i.e., more negative) in stems compared to roots, despite the former possessing smaller vessels with smaller pits (Wu et al., 2020).
Notably, the hydraulic techniques used varied not just between the different studies, but sometimes even within a single study.
This study aims to provide empirical evidence for how DFA affects the variability of anatomical (conduit diameter and pit area) and hydraulic traits (P50) at the individual level in conifer trees. We discuss the importance of using an allometric approach in studies of xylem hydraulics to account for possible axial patterns in anatomical and hydraulic traits, and thus use the scaling parameters to more properly characterize the anatomical and hydraulic traits at the individual and species level.
Materials and methods
Sampling
For this study, two mature conifers were selected: a 30-meter silver fir (Abies alba Mill.) from a mixed conifer forest located in Asiago, Italy (45° 54’ 6” N, 11° 29’ 22” E, 1320 m a.s.l.) and a 25-meter Norway spruce (Picea abies Karst.) from a pure spruce forest in Enicklberg, Niederösterreich, Austria (48° 14’ 36” N, 15° 28’ 40” E, 550 m a.s.l.). Both trees were felled in May 2022. Stem discs (19 in the A. alba and 25 in the P. abies tree) of ~ 25 cm in length were immediately extracted from at different heights along the stem, and their distance from the stem apex (DFA) determined. Due to the limited number of samples obtainable within the first 1.5 meters from the apex, we measured additional segments along the main axis of side branches within 1.5 m from the branch apex. These samples were obtained from branches of the second or third node to minimize possible effects of shade and bending on wood anatomical traits (in those cases DFA referred to the distance from the branch apex). Samples were first debarked, and then sealed in plastic bags with wet paper and transported to the laboratory. For each stem disc, 1–5 sticks of 3 × 5 ×15 cm containing the outermost sapwood rings were obtained from intact and healthy regions with no reaction wood. Apical segments with a diameter< 1 cm were not further processed. All segments were enclosed in vacuum-sealed bags and stored at -20°C. The day before measurements, segments were soaked in distilled water for 24 hours under vacuum. After this rehydration process, samples were split along the fibers to obtain sticks of approximately 0.8 × 0.8 × 14 cm. These sticks contained the three outermost sapwood rings in most cases. The surfaces of the sticks were smoothed with microtome blades. Finally, the sticks were soaked in filtered distilled water purified with silver ions (Micropure, Katadyn Products, Wallisellen, Switzerland) under low-vacuum at room temperature overnight to rehydrate the tissue and refill previously embolized (i.e., air-filled) tracheids (Rosner et al., 2018, 2019a). Previous analyses on Norway spruce sapwood samples have preliminarily tested and found that freeze-storage of saturated samples had no significant impact on specific hydraulic conductivity and vulnerability after thawing (Rosner et al., 2006, but these results were not shown). Additionally, our own unpublished data from a follow-up study on the axial variability in embolism vulnerability in Acer pseudoplatanus L. also found no discernible effects of freeze-storage on vulnerability curves.
Hydraulic measurements
Vulnerability curves (VCs) were assessed by using the air injection technique (Rosner et al., 2021; Savi, 2023). This technique has been commonly used for measuring hydraulic vulnerability of incised sapwood samples from conifer trunks (Domec and Gartner, 2001; Domec et al., 2009a; Rosner et al., 2019b). Sticks were re-cut under water at both ends with sharp razor blades, and connected to a reservoir (at 0.8 m height) containing distilled water with silver ions. The maximum sample hydraulic conductance (Kmax) was measured gravimetrically at 8 kPa by collecting sap at the distal end using pre-weighed vials containing a piece of sponge (five vials, 30 seconds interval). Next, the sticks were inserted into a double-ended pressure sleeve (PMS Instruments, Corvallis, OR, USA) and subjected to a pressure of 0.2–0.5 MPa for one minute. The sticks were thus allowed to equilibrate in water for 20 minutes, and the hydraulic conductivity (*K_i_ *) was measured again as described above. This process was repeated at increasing pressures, and the percent loss of conductance (*PLC_i_ *) was then calculated as:
where *K_i_
- is the sample conductance measured after the i-step of pressurization. The pressure applied in subsequent air injection cycles was gradually increased by steps of 0.5 - 1.0 MPa until *PLC_i_
-
90% was reached.
Anatomical measurements
Anatomical subsamples of 2 cm were obtained from the center of each stick previously used for hydraulic measurements. These subsamples were cut on cross-section for tracheid lumen diameter measurements and on the longitudinal-radial section for pit measurements using a rotary microtome (LEICA RM2245, Leica Biosystems, Nusslock, Germany) at 10–12 μm, stained with safranine and AstraBlue, and permanently fixed with Eukitt (BiOptica, Milan, Italy). Slides were scanned at 20x with a slide scanner (Axioscan7, Carl Zeiss Microscopy GmbH, Germany). Cross-sections were analyzed with ROXAS (von Arx and Carrer, 2014), which automatically measure the hydraulically weighted mean conduit diameter (Dh=*Σd_i_ ^5^ */*Σd_i_ ^4^ *, where *d_i_
- is the diameter of the i-conduit, Kolb and Sperry, 1999).
To determine the average surface area of single inter-tracheid pit membranes (PMA), radial sections were analyzed using ImageJ software (National Institutes of Health, Bethesda, MD, USA). Specifically, the contour of the pit membrane area was manually drawn on 30–50 pits per sample.
Statistical analysis and assessment of tracheid vulnerability curve
VCs were assessed by fitting PLC vs. P data by using the fitplc package (Duursma and Choat, 2017) in the R software (R Development Core Team, 2022). For each VC, the P50 value (corresponding to the applied pressure at which PLC = 50%) was extracted.
The allometric relationships between the measured traits were analyzed by using power scaling relationships:
where a is the allometric constant and b the scaling exponent. Data were first log_10_-transformed to comply with the assumption of normality and homoscedasticity (Zar, 1999), and then fitted with linear regressions, as commonly done in allometric analyses. Equation 2 was then linearized as:
In this way, the allometric constant (a) and exponent (b) of Equation 2 become the y-intercept (=log_10_a) and slope (b) of Equation 3, respectively. The effects of log_10_DFA, tree ID and their interaction on hydraulic (log_10_P50) and anatomical traits (log_10_Dh, log_10_PMA) were tested by using linear mixed effects models fitted with restricted maximum likelihood (REML) by using the lme4 R-package (Bates et al., 2015). The best model was chosen based on the Akaike Information Criterion (AIC) (Zuur et al., 2009). Sample ID was used as random factor in all models.
The list of variables used in the hydraulic and anatomical analyses is reported in Table 1.
Results
The hydraulically weighted diameter (Dh) and the average area of the intertracheid pit membranes (PMA) and the water potential inducing the 50% of conductivity loss (P50) showed a large variability down along the stem from apex to base (Figure 1).
Variation in (A) Dh, (B) PMA and (C) P50 with DFA in A. alba (blue triangles) and P. abies (red circles). Fitting lines are according to Table 2 .
P50 values ranged from -4.0 to -1.5 MPa for the P. abies tree and from -5.5 to -2.2 MPa for the A. alba tree (Figure 2).
Hydraulic vulnerability curves obtained from the apical and basal stem samples (the distance from the apex, DFA, is reported in the legend) for both A. alba and P. abies trees.
The anatomical traits Dh and PMA increased with DFA according to power relationships (DhDFA
^0.19^ and PMADFA
^0.23^), whose exponent b (Equation 2) was similar in both species (Figures 3A, B; Tables 2A, B). According to our statistical model, the effects of DFA and tree ID accounted for 92% of the total Dh variance and 88% of the total PMA variance. The model accurately described the axial variation of these traits from the stem apex to ~800 cm down the stem, but it slightly overestimated them below this point to the base.
Variation in (A) Dh, (B) PMA and (C) P50 with DFA in A. alba (blue triangles) and P. abies (red circles). Fitting lines are according to Table 2 . x and y axis are shown with log10 scale.
Dh proportionally increased from apex to base at similar rates in both trees (i.e., same exponent b=0.23), but at any DFA position in the stem it was significantly narrower in our P. abies tree than the A. alba tree (i.e., lower y-intercept) (Figure 3A; Table 2A).
Instead, there were no significant differences in the axial pattern of PMA along the stem between our sampled trees. PMA proportionally increased from apex to base at similar rates in both P. abies and A. alba trees (i.e., same exponent b=0.23). The model predicted that at any DFA position in the stem PMA was significantly similar between both trees (i.e., similar *y-*intercept). However, in our P. abies tree, PMA did not to vary for DFA > 800 cm, appearing smaller than in A. alba towards the stem base (Figure 3B; Table 2B).
We found that PMA increased proportionally with Dh according to a power relationship (PMA~DFA ^1.2^) (Figure 4; Table 3), whose exponent is coherent with the exponents characterizing the axial patterns of both Dh (b=0.19) and PMA (b=0.23) (note that 0.23/0.19 = 1.2). Furthermore, PMA resulted significantly larger at any observed Dh in the P. abies than the A. alba tree (i.e., higher *y-*intercept: Figure 3; Table 3).
Variation in PMA with Dh in A. alba (blue triangles) and P. abies (red circles). Fitting lines are according to Table 3 . x and y axis are shown with log10 scale.
P50 became progressively less negative along the stem from the apex to base, with 1 MPa of the observed variation confined within the most apical 1.5 m of the stem (Figure 1C; Figure 3C). This P50 axial pattern was well described with a power relationship between -P50 and DFA (-P50DFA
^-0.21^) (Figure 3C; Table 2C). -P50 decreased at similar rates in both sampled trees (i.e., significantly similar exponent) but at any DFA position, the P. abies tree resulted more vulnerable to air seeding than the A. alba tree (i.e., less negative P50; higher *y-*intercept). Notably, the effects of DFA and tree ID explained 90% of the total P50 variance. More specifically, the model accurately captured the P50 variation up to DFA ~800 cm. Beyond this point, the axial pattern became less clear.
Coherently with the observed relationships between Dh, PMA and ǀP50ǀ with DFA, we found significant power scaling relationships of -P50 vs. Dh and -P50 vs. PMA in both species (Figure 5; Table 4). P50 becomes progressively more negative with increasing Dh and PMA at significantly similar rates in the two sampled trees (-P50Dh
^-1.01^, -P50PMA
^-0.79^). Tracheids of given Dh resulted more vulnerable (i.e., less negative P50) in the P. abies than the A. alba tree (i.e., lower *y-*intercept: Figure 5A; Table 4A). Seemingly, tracheids of given PMA resulted more vulnerable (i.e., less negative P50) in the P. abies than the A. alba tree (i.e., lower *y-*intercept: Figure 5B; Table 4B).
Variation in P50 with (A) Dh and (B) PMA in A. alba (blue triangles) and P. abies (red circles). Fitting lines are according to Table 4 . x and y axis are shown with log10 scale.
It can be summarized that (i) the power scaling relationships of Dh, PMA and P50 with DFA showed no differences in the scaling exponent between the two sampled trees, (ii) at any DFA position each trait differed between the sampled trees by a constant factor equal to the ratio of their allometric constant a (Equation 2). In practice, at any DFA position along the stem, tracheids of the P. abies tree had 20% narrower Dh, similar PMA and 35% less negative P50.
Discussion
The study revealed significant axial patterns in all analyzed traits (Dh, PMA and P50). The increase in Dh and PMA from stem apex to base aligned with previous anatomical analyses on conifers (Anfodillo et al., 2006, 2012; Lintunen et al., 2010; Petit et al., 2011, 2023; Jyske and Hölttä, 2015; Lazzarin et al., 2016). Besides, our hydraulic measurements provided new empirical evidence of a consistent axial pattern in P50, becoming less negative with increasing distance from the stem apex (DFA). Trait variation was very clear from the stem apex down to approximately 8 m. Beyond this point, all traits showed little change.
The functional allometry of tracheid and pit traits
All traits exhibited allometric scaling with DFA, following power relationships (Equation 2). These relationships are commonly found in all living organisms, representing fundamental functional properties (West et al., 1997, 1999). When one trait varies, several others change proportionally to maintain essential functional properties. The scaling exponent (b) describes the relative variation in the Y trait for a given change in the X trait. For example, trees maintain their upright position by increasing stem diameter (D) in precise proportion to the increase in tree height (H) to ensure mechanical stability (resulting in the universal scaling of H~D ^2/3^: McMahon & Kronauer, 1976; Niklas, 1995).
Among the traits analyzed in this study, the hydraulically weighted tracheid lumen diameter (Dh) received the most attention. In our trees, Dh increased with DFA ^0.2^ (scaling exponent b=0.2), consistent with previous studies on axial Dh variation along the youngest/outermost xylem ring (Anfodillo et al., 2006, 2012; Lintunen et al., 2010; Petit et al., 2011, 2023; Jyske and Hölttä, 2015). This axial pattern has been traditionally referred to as “conduit tapering” (the progressive reduction in lumen diameter from the stem base towards the apex: Schulte, 2012; Pfautsch et al., 2018). However, the axial Dh variation is strongly DFA-dependent, since such a pattern was found to be rigidly reiterated at every year of growth (i.e., the same pattern can be found along each annual ring from the ring apex to the stem base: Prendin et al., 2018; Petit et al., 2023). This pattern, where Dh increases with DFA, known as “widening”, has been hypothesized to play a crucial role in enhancing the hydraulic properties of xylem architecture. On one hand, larger conduits towards the stem base would contribute very little to the total hydraulic resistance to water transport (Becker et al., 2000; Petit and Anfodillo, 2009), thus effectively contributing to maintain an efficient leaf water supply while growing taller (West et al., 1999; Petit et al., 2010). On the other hand, increasingly conductive conduits from the stem apex to base would strongly affect the shape of the water potential (Ψ) gradient from the stem apex to base, with the lowest (i.e., most negative) Ψ concentrated within a short distance from the apex (Lechthaler et al., 2020).
Notably, the above conditions received indirect empirical support from studies reporting very limited variation in the contribution of pit resistance to the total conduit (either vessels in angiosperms and tracheids in conifers) resistance with increasing conduit diameter (Domec et al., 2006; Pittermann et al., 2006; Petit et al., 2008).
Tracheid-pit allometry
Tracheid diameter and different pit traits have been reported to be highly correlated both at the individual (Schulte, 2012; Lazzarin et al., 2016; Held et al., 2021) and interspecific level (Hacke et al., 2004; Delzon et al., 2010).
Our measurements of PMA and Dh at different positions along the stem provided new evidence that tracheid and pit traits tightly vary in tandem along the stem from apex to base (Schulte, 2012; Lazzarin et al., 2016). Both PMA and Dh varied with *DFA^b^ *, with the scaling exponent for both relationships and in both A. alba and P. abies tree being b~0.2, thus very similar to the same scaling relationships reported for the giant Sequoiadendron giganteum (Lindl.) J.Buchh. tree analyzed by Lazzarin et al. (2016).
Furthermore, Lazzarin et al. (2016) reported highly significant DFA-dependent trends not only for PMA, but also for torus area and pit aperture area. Since these traits are typically highly correlated (Hacke et al., 2004; Delzon et al., 2010), it seems highly likely that also in our analyzed trees the torus area and pit aperture area conformed to these relationships with PMA, and therefore progressively increased with DFA (additional indirect evidence is discussed below).
The regulation of the tracheid lumen diameter, as well as pit traits, is likely associated to the duration of cell elongation, which progressively increases from the stem apex to base (Anfodillo et al., 2012).
Increasing embolism vulnerability from the stem apex to base
While it is widely acknowledged that pit traits (PMA, torus area and pit aperture area) strongly influence the resistance against embolism formation through air seeding via pit membranes (Hacke et al., 2004; Delzon et al., 2010; Bouche et al., 2014), the growing body of empirical evidence demonstrating strong and consistent (almost universal) anatomical patterns dependent on DFA has not adequately motivated the scientific community to investigate the impact of DFA on xylem hydraulic properties, such as embolism vulnerability.
We observed a tremendous variation in P50 (>3 MPa) along the stem of both the P. abies and A. alba trees. This axial variability is twice as large as that reported for Pseudotsuga menziesii using the same air-injection technique (Domec and Gartner, 2001). In contrast, Bouche et al. (2016) reported no differences in P50 of the outer sapwood at different heights along the trunk of mature conifer individuals. Notably, our data are consistent with both studies because neither of them measured samples extracted at a short distance from the apex. More specifically, Domec & Gartner did not sample segments between the stem apex and the fifth internode, likely located at a distance of over 1 meter from the stem apex, whereas Bouche et al. cut the most apical trunk bole segment with a chainsaw, therefore likely at an even greater distance from the apex. Seemingly to Bouche et al. (2016), the P50 variation along the stem of our trees from ~3 m from the apex until the stem base was very limited and hardly significant if extrapolated from the remaining distal part of the stem. Furthermore, the more negative P50 of 1-cm-diameter branches compared to that of trunk in Bouche et al. (2016) is also consistent with our results.
Our P50 data from segments at short distance from the apex of both trees were in line with those found in the literature and obtained from VCs of apical branches (<1 m) measured with different techniques (bench dehydration and hydraulic measurements, acoustic, centrifugation, etc.) (Choat et al., 2012; Feng et al., 2021).
Even if sometimes criticised, especially when applied to long- and wide-vesseled species (Laughlin et al., 2023), the air injection method is well established for analyses on conifers and short-vesseled species, and several studies showed good agreements between the air injection and other methodical approaches (Rosner et al., 2019a).
The axial pattern of P50 strongly depended on DFA, following a power trajectory similar to Dh and PMA (ǀbǀ~0.2). However, it also resembled the trajectory of torus area and pit aperture area (Lazzarin et al., 2016). P. abies exhibited less negative P50 (Figure 3C; Table 2C), narrower Dh (Figure 3A; Table 2A) and similar PMA (Figure 3B; Table 2B) compared to A. alba along the stem. It would be a mistake to interpret this as the P. abies tree being more vulnerable due to its narrower tracheids. Instead, this comparison simply showed that vulnerability is not determined by tracheid diameter alone (Lens et al., 2022), but rather by other traits that are correlated with it. Tracheids with a given PMA showed higher vulnerability to gas-embolism in the P. abies than in the A. alba tree (lower y-intercept: Table 4B; Figure 5B). However, both trees exhibited similar PMA at any DFA position (Table 2B; Figure 3B), while P50 differed (Table 2C; Figure 3C). This could potentially be explained by other pit traits, such as torus area and the aperture area, that typically vary proportionally with Dh and PMA (Lazzarin et al., 2016). Most likely, at any DFA and PMA, the P. abies tree resulted more vulnerable than the A. alba tree due to its narrower torus area and/or larger pit aperture area, corresponding to a less efficient torus overlap (Hacke and Jansen, 2009). Indeed, the correlation between different anatomical traits (tracheid diameter, pit membrane area, torus area and aperture area) is typically very high (Delzon et al., 2010; Bouche et al., 2014; Held et al., 2021), in agreement with our data and the findings on axial trends in anatomical traits (Schulte, 2012; Lazzarin et al., 2016).
The within-tree P50 variability reported in this study for only two trees corresponded to approximately 60% of the P50 variability among many gymnosperm species reported in a previous study (Choat et al., 2012).
To ensure comparability of xylem hydraulic analyses, it is crucial to consider the potential DFA effects on lumen diameter, pit traits, and hydraulic characteristics.
Xylem hydraulic data, such as P50 and xylem specific conductivity (ks), are commonly obtained by sampling stem/branch segments with standardized age (i.e., number of rings) or diameter, and specific length (depending on methods), thus they do not account for DFA effects. Therefore, if DFA is unknown, accurate comparability of published data is quite challenging.
Towards the allometric scaling of plant hydraulics
The observed increase in P50, becoming less negative, along the stem from apex to base is in line with the predicted pattern based on the axial variation in tracheid and pit traits mentioned earlier.
Removing the DFA effect from hydraulic measurements is not a straightforward task. In our trees -P50 scaled with DFA ^-0.2^. However, our limited data cannot exclude that b may be higher or lower than -0.2 depending on species and/or environmental conditions. Therefore, sampling at fixed DFA does not entirely eliminate the DFA effects on P50, unless the b=-0.2 will be demonstrated to be universal in plants.
Instead, considering the axial variability in anatomical (e.g., conduit diameter and pit traits) and hydraulic (e.g., xylem specific conductivity, P50) traits would help account for the DFA effects. Applying our allometric approach, we could determine that the analyzed P. abies tree was 35% more vulnerable than the A. alba tree: since -P50~*DFA^-0.2^
- (i.e., similar exponent b=0.2), at any DFA position along the stem the ratio of P50 between the two trees was equal to the ratio of their allometric constant a (Equation 1) (*a_P.abies_/a_A.alba_ *=1.35). This relationship can be visually represented as parallel lines on a log-log graph (using either log-transformed data or a linear scale with logarithmic axes) (cf. case A vs. case B in Figure 6: same slope and different y-intercept).
How allometric trajectories can be used for studying the variability of P50 (or other hydraulic traits) in different contexts. The base case A represents the P50 variation with DFA at the single individual level. Compared to case A, the lower y-intercept of case B indicate a lower resistance against drought-induced embolism formation; the lower y-intercept and higher slope of case C indicate a lower embolism resistance in the upper stem and a higher resistance in the lower stem. Convergence towards a similar scaling of P50 with DFA could be the result of selection eliminating variants with too high P50 towards the apex (where the xylem tensions are the highest due to the proximity to the transpiring leaves), and too low tracheid conductivity towards the base (determining hydraulic limitations to leaf water supply).
In cases where two individuals would have different values for a and b (Equation 2), resulting in distinct y-intercepts and slopes on log-log representation (Equation 2) (cases A and C of Figure 6), measuring P50 at a single position in the branch would lead to one individual (case A) appearing less vulnerable if samples were taken towards the apex, or more vulnerable if samples were taken towards the base.
Further investigations are needed to test the consistency and generality of the axial scaling of embolism vulnerability (P50) with DFA. This approach could provide a new perspective on studying plant functional traits, including anatomical and hydraulic characteristics. Empirical evidence increasingly supports the notion of species converging towards a universal scaling of conduit diameter (Dh) with DFA (Anfodillo et al., 2013; Olson et al., 2018; Kiorapostolou and Petit, 2019; Lechthaler et al., 2019; Petit et al., 2023). Additionally, there is growing evidence of similar scaling relationships between pit traits and DFA (this study, Schulte, 2012; Lazzarin et al., 2016). It is reasonable to assume that evolution has favored variants that strike a balance between safety and efficiency, eliminating those with vulnerable conduits towards the apex (where xylem pressures are most negative due to proximity to transpiring leaves) and those with low conductive vascular elements towards the base (which would limit leaf water supply and gas exchange efficiency). This can be visualized as empty morphospaces in Figure 6.
In this context, extending this common evolutionary pattern to angiosperms appears more complex due to practical challenges in testing axial variation in xylem embolism formation in broadleaved species compared to conifers. Additionally, although patterns of vessels/tracheid and pit anatomical traits are similar across studies (Petit et al., 2010; Lechthaler et al., 2019; Soriano et al., 2020), hydraulic tests carried out with different techniques (flow centrifuge, optical visualization and pneumatic air discharge) seemed not to support the hypothesis that large axial P50 variation applies also to vessel-bearing species (Creek et al., 2018; Rodriguez-Dominguez et al., 2018; Wu et al., 2020; Lübbe et al., 2022). But notably, no studies have directly investigated the variation in P50 with the distance from the apex in angiosperms.
Conclusion
This study presents novel empirical evidence that supports the concept of xylem tracheids having all xylem anatomical traits strongly influenced by their distance from the apex. This results in significant variation in P50 along the stem, from the apex to the base.
We strongly emphasize the importance for researchers investigating xylem hydraulics to carefully consider the potential impact of axial distance from the apex on traits such as embolism vulnerability. Accounting for this effect is crucial for obtaining accurate measurements, enabling robust analysis and comparison of individuals, populations, and species. Ultimately, this knowledge will enhance our ability to predict the impacts of climate change on plant communities.
Data availability statement
The raw data supporting the conclusions of this article will be made available by the authors, without undue reservation.
Author contributions
DZ: Data curation, Formal analysis, Investigation, Writing – review & editing. TS: Investigation, Methodology, Supervision, Writing – review & editing. SR: Conceptualization, Methodology, Writing – review & editing. GP: Conceptualization, Supervision, Visualization, Writing – original draft, Writing – review & editing.
The reference list from the paper itself. Each links out to its DOI / PubMed record.
- 1Adams H. D.Zeppel M. J. B.Anderegg W. R. L.Hartmann H.Landhäusser S. M.Tissue D. T.. (2017). A multi-species synthesis of physiological mechanisms in drought-induced tree mortality. Nat. Ecol. Evol. 1, 1285–1291. doi: 10.1038/s 41559-017-0248-x 29046541 · doi ↗ · pubmed ↗
- 2Anfodillo T.Carraro V.Carrer M.Fior C.Rossi S. (2006). Convergent tapering of xylem conduits in different woody species. New Phytol. 169, 279–290. doi: 10.1111/j.1469-8137.2005.01587.x 16411931 · doi ↗ · pubmed ↗
- 3Anfodillo T.Deslauriers A.Menardi R.Tedoldi L.Petit G.Rossi S. (2012). Widening of xylem conduits in a conifer tree depends on the longer time of cell expansion downwards along the stem. J. Exp. Bot. 63, 837–845. doi: 10.1093/jxb/err 309 22016427 PMC 3254684 · doi ↗ · pubmed ↗
- 4Anfodillo T.Petit G.Crivellaro A. (2013). Axial conduit widening in woody species: A still neglected anatomical pattern. IAWA J. 34, 352–364. doi: 10.1163/22941932-00000030 · doi ↗
- 5Bates D.Mächler M.Bolker B.Walker S. (2015). Fitting linear mixed-effects models using lme 4. J. Stat. Software 67, ar Xiv:1406.5823. doi: 10.18637/jss.v 067.i 01 · doi ↗
- 6Becker P.Gribben R. J.Lim C. M. (2000). Tapered conduits can buffer hydraulic conductance from path-length effects. Tree Physiol. 20, 965–967. doi: 10.1093/treephys/20.14.965 11303571 · doi ↗ · pubmed ↗
- 7Becker P.Gribben R. J.Schulte P. J. (2003). Incorporation of transfer resistance between tracheary elements into hydraulic resistance models for tapered conduits. Tree Physiol. 23, 1009–1019. doi: 10.1093/treephys/23.15.1009 12975125 · doi ↗ · pubmed ↗
- 8Bouche P. S.Jansen S.Sabalera J. C.Cochard H.Burlett R.Delzon S. (2016). Low intra-tree variability in resistance to embolism in four Pinaceae species. Ann. For. Sci. 73, 681–689. doi: 10.1007/s 13595-016-0553-6 · doi ↗