UPLC-MS/MS determination of 71 neuropsychotropic drugs in human serum
Weifeng Jin, Jianhua Wang, Shuzi Chen, Qing Chen, Dan Li, Mengyuan Zhu, Xiaomei Fu, Yingyu Huang, Ping Lin

TL;DR
This paper presents a new UPLC-MS/MS method for detecting 71 neuropsychotropic drugs in human serum, useful for drug monitoring and toxicity screening.
Contribution
A validated UPLC-MS/MS method for rapid detection of 71 neuropsychotropic drugs in human serum is developed.
Findings
The method detected 71 drugs with correlation coefficients above 0.990.
Precision and accuracy were within acceptable ranges for low, medium, and high concentrations.
The method is validated, cost-effective, and suitable for clinical use.
Abstract
In this study, a UPLC-MS/MS method was developed for the rapid detection of 71 neuropsychotropic drugs in human serum for drug concentration monitoring and toxicity screening. The analytes were separated from the biological matrix by protein precipitation using a methanol-acetonitrile solvent mixture. The chromatographic separation was performed on a Kromasil ClassicShell C18 column (2.1*50 mm, 2.5 μ m) with gradient elution using acetonitrile-0.2 % acetic acid and 10 mM ammonium acetate as the mobile phases (flow rate 0.4 mL/min, column temperature 40 °C, injection volume 5 μL). An electrospray ion source in both positive and negative ion modes with multiple ion monitoring was used. The total run time was 6 min. All compounds were quantified using the isotope internal standard method. Totally, 71 drugs were detected within their linear ranges with correlation coefficients greater than…
Genes, proteins, chemicals, diseases, species, mutations and cell lines named across the full text — each resolved to its canonical identifier and authoritative record.
Click any figure to enlarge with its caption.
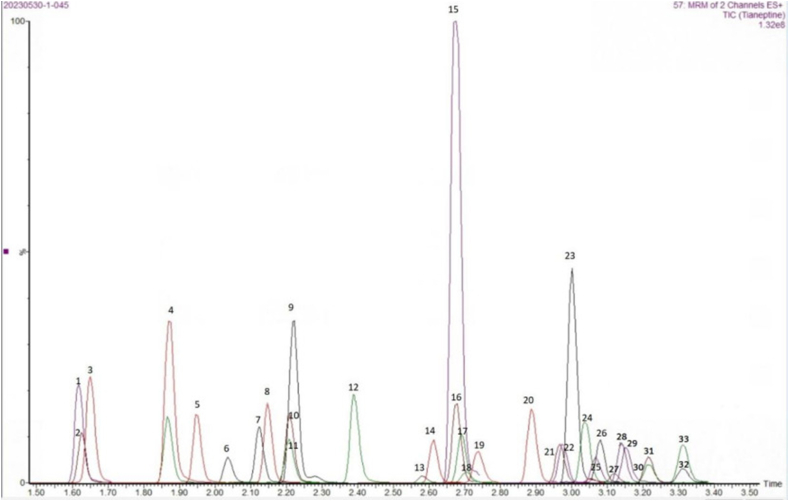 Figure 1
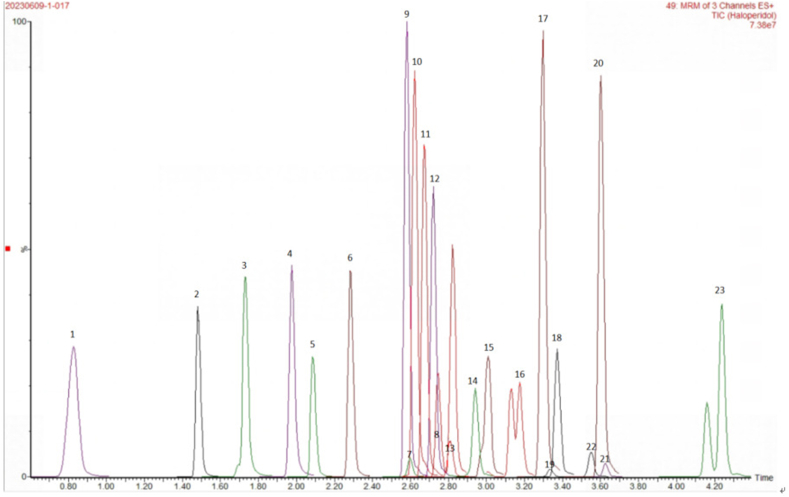 Figure 2
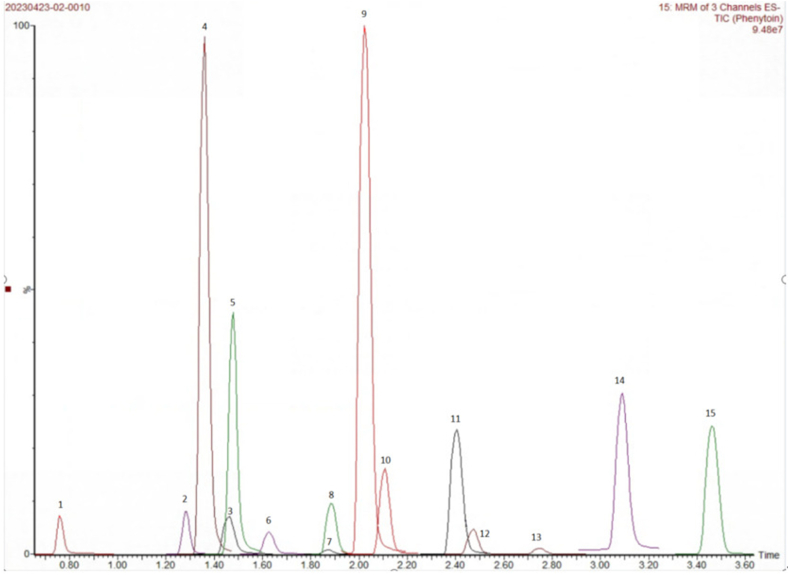 Figure 3
Peer Reviews
No public reviews on file for this paper yet. If you reviewed it on a platform where reviews are public (OpenReview, ICLR, NeurIPS, ICML), you can paste yours below so the community can read it here.
Videos
No videos yet. Explain this paper in a talk, walkthrough, or lecture? Add one.
Taxonomy
TopicsEpilepsy research and treatment · Neuroscience and Neuropharmacology Research · Pharmacological Effects and Toxicity Studies
Introduction
1
Mental illnesses account for a large proportion of clinically relevant diseases and are currently treated mainly by administering neuropsychotropic drugs that offer symptomatic control, but regular monitoring of blood levels is required due to interpatient differences, narrow therapeutic window for the drugs, high toxicity, and susceptibility to adverse reactions [[1], [2], [3], [4], [5]].
Therapeutic drug monitoring (TDM) is an effective way of tailoring medication regimens to individual patients. According to the TDM expert group of the European Association of Neuropsychopharmacology and Pharmacopsychiatry (AGNP), which updated and published the consensus guidelines for psychiatric TDM in 2017, the number of drug classes was expanded to 154, and neuropsychotropic drugs were divided into various categories, including antidepressants, antipsychotics, antiepileptics, and affective stabilizers [6]. To guide and standardize TDM in medical institutions and medical consultancies, the Professional Committee on Therapeutic Drug Monitoring and Research of the Chinese Society of Pharmacology formulated the Expert Consensus on the Specification of Therapeutic Drug Monitoring Work in 2022 [7] and published the Expert Consensus on the Use of Chromatographic Techniques for Quality Assurance of Therapeutic Drug Monitoring in 2021 [8]. Several published guidelines recommend liquid chromatography-tandem mass spectrometry (LC-MS/MS) as an effective way to monitor drug concentrations in the blood.
LC-MS/MS methods can detect neuropsychotropic drugs with high sensitivity and accuracy [[9], [10], [11]]. These methods for detecting single or multiple classes of neuropsychotropic drugs by MS have been reported, but these methods have the following shortcomings: 1) Low throughput: most existing methods are designed for the simultaneous determination of multiple drugs of a single class [12] or separate determination of individual drugs [[13], [14], [15], [16], [17]]. 2) Low efficiency: various methodologies have to be used to determine drugs of distinct classes, necessitating frequent alteration of columns and mobile phases during the assay. This entails increased allocation of labor, resources, and finances. Furthermore, the capacity to concurrently detect multiple drugs remains restricted, thereby reducing assay efficiency [9,[18], [19], [20], [21]]. 3) Low sensitivity: in the simultaneous detection of multiple drugs, some drugs cannot be accurately detected due to low detection signals, which affects the accuracy of detection. In addition, the accurate quantification of drugs at lower concentrations is more challenging when also simultaneously determining drugs that are present at higher concentrations in the sample.
We developed an LC-MS/MS method to detect the concentrations of a total of 71 drugs in human serum by protein precipitation: 12 antiepileptic drugs and their 2 metabolites, 17 antipsychotics and their 5 metabolites, and 21 antidepressants and their 14 metabolites. The drugs were all present in the range of AGNP guidelines. The proposed method is simple, has good accuracy and reproducibility, and can provide technical support for the rational use of neuropsychotropic drugs.
Experimental
2
Chemicals and reagents
2.1
The 71 drug standards and internal standards were obtained from Manhage (Shanghai, China) Biotechnology Co. Methanol and acetonitrile (Shanghai ANPEL Biotechnology Co., Ltd.; Shanghai, China), as well as ammonium acetate and acetic acid (Sigma-Aldrich Co., LLC.; MO, USA) were of chromatography grade. methanol and acetonitrile were from Shanghai ANPEL Biotechnology Co.,Ltd(Shanghai,China); ammonium acetate and acetic acid were from Sigma-Aldrich Co., LLC (MO, USA); Blank serum were from RealBioGroup Co., Ltd. (Shenzhen, China). Ultrapure water (Millipore Express ultrapure water system; Millipore, Bedford, USA) was used in the analysis.
LC-MS/MS conditions
2.2
LC-MS/MS detection was performed on Waters Acquity UPLC I-Class XEVO TQS (Waters Co., Milford, USA). The chromatographic conditions were as follows: a ClassicShell C18 column (2.1 × 50 mm, 2.5 μm, Kromasil) was used (Nouryon Co., Göteborg, Sweden). Mobile phase A was an aqueous solution of ammonium acetate (10 mM) containing 0.2 % acetic acid. Mobile phase B was acetonitrile. The mobile phase gradient conditions used are given in Table 1. The column temperature was 40 °C, and the injection volume was 5 μL. The MS conditions were as follows: electrospray ionization (ESI) source was used in the positive and negative ion, as well as multiple reaction monitoring (MRM) modes. The capillary voltage was 0.5 kV, desolvent gas temperature was 400 °C, desolvent gas flow was 1100 L/h, conical pore gas flow was 150 L/h, and nitrogen gas pressure was 7.0 bar. The parameters for MRM monitoring are shown in Table 2.Table 1. Gradient elution conditions.Table 1. Time(min)flow rate(mL/min)mobile phaseA%mobile phaseB%0.00.490100.30.4901030.4505040.459550.45955.010.4901060.49010A: aqueous solution of ammonium acetate (10 mM) containing 0.2 % acetic acid.B: acetonitrile.Table 2. Mass spectrometry detection parameters of 71 psychotropic substances.Table 2compoundParent(m/z)Daughter(m/z)Cone voltage(v)Collision(v)ModeOxcarbazepine253.2208.17522ESI+Oxcarbazepine-13C6259.2214.17522ESI+10-hydroxycarbazepine255.1194.53540ESI+10-hydroxycarbazepine-13C6261.2200.53539ESI+Epoxide-Carbamazepine253.2210.16525ESI+Epoxide-Carbamazepine-13C6259.2242.16517ESI+Carbamazepine237.11694.18035ESI+Carbamazepine-13C6243.1200.18035ESI+Phenobarbital231.0187.93610ESI-Phenobarbital-D5236.0193.03610ESI-Primidone219.2119.05022ESI+Primidone-D5224.1124.25022ESI+Phenytoin251.1101.95420ESI-Phenytoin-13C,15N2254.0210.15418ESI-Valproic acid143.1143.11510ESI-Valproic acid-D4147.0147.01510ESI-Lamotrigine256.0211.14440ESI+Lamotrigine-13C,15N4261.0214.01840ESI+Topiramate340.2184.24210ESI+Topiramate-13C6346.2190.24214ESI+Levetiracetam171.2126.14020ESI+Levetiracetam-d6177.2160.0388ESI+Perampanel350.1219.03845ESI+Perampanel-d5355.2220.03836ESI+Zonisamide213.1132.12428ESI+Zonisamide-13C2,15N2216.1135.12614ESI+Clonazepam316.1270.03020ESI+Clonazepam-d4320.1274.12025ESI+9-Hydroxyrisperidone427.3207.16840ESI+9-Hydroxyrisperidone-d4431.3211.26840ESI+Risperidone411.3191.18540ESI+Risperidone-d4415.3195.28540ESI+N-desmethylolanzapine299.2256.16622ESI+N-desmethylolanzapine-d8307.2260.85424ESI+Olanzapine313.2256.11020ESI+Olanzapine-d3316.2256.14622ESI+N-desmethylclozapine313.2192.19048ESI+N-desmethylclozapine-d8321.2192.09048ESI+Clozapine327.2270.16038ESI+Clozapine-d4331.2272.26035ESI+Aripiprazole448.3284.64632ESI+Aripiprazole-d8456.3293.26832ESI+Dehydroaripiprazole446.3285.14640ESI+Dehydroaripiprazole-d8454.3293.21040ESI+Amisulpride370.3196.03655ESI+Amisulpride-d5375.6196.03655ESI+Perphenazine404.3171.25822ESI+Perphenazine-d4408.3171.24622ESI+Fluphenazine438.3171.15824ESI+Fluphenazine-d8446.3179.24626ESI+Haloperidol376.2165.15522ESI+Haloperidol-d4380.2165.15522ESI+Reducdhaloperidol378.2360.24618ESI+Reducdhaloperidol-d4382.2364.24218ESI+Flupenthixol435.3128.14626ESI+Flupenthixol-d4439.3132.04626ESI+Quetiapine384.3253.18538ESI+Quetiapine-d4388.3253.18538ESI+Thioridazine371.2126.17830ESI+Thioridazine-d3374.2129.27830ESI+Lurasidone493.4166.14045ESI+Lurasidone-d4497.4166.24045ESI+Loxapine328.2193.17044ESI+Loxapine-d8336.2193.17044ESI+Chlorpromazine319.186.18227ESI+Chlorpromazine-d6325.292.18227ESI+Chlorprothixene316.2271.08524ESI+Chlorprothixene-d6322.2271.18524ESI+Ziprasidone413.2194.13033ESI+Ziprasidone-d8421.2194.03033ESI+Sulpiride342.2112.19040ESI+Sulpiride-d3345.2112.19040ESI+Trazodone372.2176.18036ESI+Trazodone-d6378.3182.18036ESI+N-desmetyclomipramine301.2242.13824ESI+N-desmetyclomipramine-d3304.2242.13222ESI+Clomipramine315.286.06625ESI+Clomipramine-d3318.389.06625ESI+N-desmethylmianserin251.2118.0632ESI+Mianserin-d3268.3208.14420ESI+Mianserin265.2208.14820ESI+Mianserin-d3268.3208.14420ESI+N-desmethylmirtazapine252.2195.15020ESI+N-desmethylmirtazapine-d6258.2197.31622ESI+Mirtazapine266.2195.17020ESI+Mirtazapine-d3269.2195.17020ESI+N-Desmethylvenlafaxine264.3246.21610ESI+N-Desmethylvenlafaxine-d3267.3249.22610ESI+O-Desmethylvenlafaxine264.358.16420ESI+O-Desmethylvenlafaxine-d6270.364.16420ESI+Venlafaxine278.3260.25512ESI+Venlafaxine-d6284.4266.35512ESI+O-Deethylreboxetine286.2131.13618ESI+Reboxetine-d5319.3176.14612ESI+Reboxetine314.3176.14612ESI+Reboxetine-d5319.3176.14612ESI+Agomelatine244.2185.16020ESI+Agomelatine-d3247.2185.16020ESI+Amitriptyline278.2105.14024ESI+Amitriptyline-d3281.3105.11226ESI+N-Desmethylamitriptyline264.2105.13218ESI+N-Desmethylamitriptyline-d3267.2105.13028ESI+Bupropion240.1184.12612ESI+Bupropion-d9249.2185.11812ESI+Hydroxybupropion256.1238.15012ESI+Hydroxybupropion-d6262.2244.25012ESI+Duloxetine298.244.11012ESI+Duloxetine-d7305.244.21012ESI+Doxepin280.2107.17024ESI+Doxepin-d3283.2107.17024ESI+N-Desmethyldoxepin266.2107.13822ESI+N-Desmethyldoxepin-d3269.2107.13825ESI+Vortioxetine299.2150.02424ESI+Vortioxetine-13C6305.2156.13622ESI+Fluvoxamine319.271.11814ESI+Fluvoxamine-d3322.374.01216ESI+Fluoxetine310.2148.1248ESI+Fluoxetine-d6316.2154.1108ESI+N-Desmethylfluoxetine296.2134.166ESI+N-Desmethylfluoxetine-d5301.2139.166ESI+Maprotiline278.2250.22420ESI+Maprotiline-d5283.3255.23620ESI+N-Desmethylmaprotiline264.2141.13234ESI+Maprotiline-d5283.3255.23620ESI+Moclobemide269.2182.07528ESI+Moclobemide-d4273.2186.17528ESI+Moclobemide N-oxindole285.2182.06523ESI+Moclobemide N-oxindole-d4289.2186.16523ESI+milnacipran247.2230.22010ESI+milnacipran-d5252.3235.21010ESI+Tianeptine437.2292.1616ESI+Tianeptine-d6443.3292.11414ESI+Paroxetine330.2192.14620ESI+Paroxetine-d6336.3198.22220ESI+Norsertraline275.1158.93818ESI+Norsertraline-13C6281.1159.02622ESI+Sertraline306.2275.11612ESI+Sertraline-13C6312.2281.11212ESI+Citalopram325.2109.07026ESI+Citalopram-d6331.3109.07024ESI+N-Desmethylcitalopram311.2262.12416ESI+N-Desmethylcitalopram-d3314.3262.11818ESI+
Preparation of stock and working solutions
2.3
Standard stock solution
2.3.1
The purity of each drug compound was different, and according to the purity stated on the certificate, the drug samples were divided into two drugs with a purity >95 % and drugs with a purity <95 %. When the purity of the drug was >95 % of the standard, 1 mg of the standard (default purity 100 %) was accurately weighed and dissolved in 1 mL of methanol. When the purity of the drug was <95 % of the standard, according to the actual purity of the quality of the conversion, and then dissolved in 1 mL of methanol.
Configuration of standard curves and QC
2.3.2
Standard curves
2.3.2.1
Sulpiride, chlorpromazine, agomelatine, chlorprothixene, desmethyl sertraline, sertraline, fluphenazine, haloperidol, reduced haloperidol, and flupenthixol were used in mixed concentration group 1. Blank serum was spiked with the appropriate amount of each drug to form high concentration mix 1, and the remaining five mixes were prepared from high concentration mix 1 and blank serum. The following ratios of high concentration mix 1 to blank serum were followed: 1:2, 1:5, 1:11, 1:24, and 1:99. For the rest of the drugs as mixed concentration group 2, the appropriate amount of different drugs and blank serum were mixed to prepare high concentration mixing standard 2. The remaining five mixing ratios of the high concentration mixing standard 2 to blank serum were as follows: 3:2, 1:1, 2:3, 3:7, and 1:29. Mixing standard 1 and mixing standard 2 were mixed in the ratio of 1:9, and finally a standard curve of STD1–STD6 was prepared.
QC
2.3.2.2
QC preparations were obtained by diluting them from a new stock solution. QC samples comprise three concentrations covering the lowest detection limit, the range within the recommended reference concentration for the drug, and the range above the recommended concentration. The method of preparation of the three QC samples (low, medium, and high concentrations) was the same as that of standards 1, 3, and 5.
Preparation of the internal standard precipitation solution
2.3.3
The appropriate amount of each drug's internal standard was precisely weighed and placed in a 1 ml volumetric flask and dissolved in methanol. The volume was made up to obtain a concentration of 1 mg/ml of internal standard reserve solution. The appropriate volume of each drug's internal standard reserve solution was then taken in a reagent bottle, and the mixed internal standard solution was prepared by mixing with methanol, and then diluted 100 times with methanol-acetonitrile reagent mixture (4:6) to obtain the internal standard precipitation solution.
Sample preparation
2.4
Serum sample (50 μL), QC sample(50 μL), and standard sample(50 μL) were taken in a centrifuge tube, to which was added 300 μL of internal standard precipitating solution and vortex mixed. The tube was centrifuged at a high speed at 16000g for 10 min at 4 °C. The supernatant (100 μL) was collected in a collection plate, to which was added 100 μL of 5 % methanol in water and mixed well. The mix was analyzed using the Waters Acquity UPLC I-Class XEVO TQS.
Method validation
2.5
Method validation was performed according to CLSI C62-A [22] guidelines and 9012 Guidelines for Validation of Methods for Quantitative Analysis of Biological Samples [23].
Selectivity and specificity
2.5.1
Separate samples of blank human serum and serum samples with the drug-mixed standard solution added were tested. The presence of interference peaks and any effect of endogenous substances were studied.
Linearity and sensitivity
2.5.2
The standard curve was plotted by linear regression with the mass concentration of the drug of interest in serum (X) as the horizontal coordinate and the peak area ratio of the drug of interest to the internal standard (Y) as the vertical coordinate. The lower limit of quantitation (LLOQ) was defined as the lowest concentration on the standard curve satisfying the following conditions S/N ≥ 10, and it was noted that the RSD of precision of 5 replicate standard curve samples was within 20 %, and the concentration deviation was within ±15 % of the theoretical value.
Intra- and inter-day validation and accuracy
2.5.3
High, medium, and low concentrations of QC samples were prepared by adding standards to blank human serum. One batch was made each day for three days to investigate the intra-batch and inter-batch precision and accuracy, respectively.
Matrix effect
2.5.4
For validating the matrix effect, the post sample treatment addition method was adopted. The matrix sample was taken, pre-treated, and then the target analyte was added at a certain concentration. Thus, three samples of low, medium, and high concentrations were prepared, and the measurement was repeated thrice for each concentration. The sample and the same concentration of pure solvent as the matrix sample were analyzed, and then their respective response values and the ratio of the internal standard were compared. The difference between the ratio of the matrix sample response value to the internal standard and the ratio of the solvent sample response value to the internal standard to the solvent sample response value was considered the relative matrix effect.
Evaluation of stability
2.5.5
Standards were added to the blank serum to obtain specimens for stability studies at low, medium, and high concentrations. The control group was stored at −80 °C, and the other groups were placed at room temperature. They were kept at room temperature for 1, 2, 3, 5, and 7 days and then transferred to the −80 °C refrigerator. After all samples were transferred, they were tested to compare the experimental group with the control group. The samples were considered to be stable if the deviation was no more than 15 %.
Carryover
2.5.6
After the high concentration sample, a blank sample was analyzed to estimate the residual carryover effect. A carryover effect was considered to be absent if residues in the blank after the high concentration sample did not exceed 20 % of the lower limit of quantification and 5 % of the internal standard.
Results
3
Selectivity and specificity
3.1
The chromatographic peaks of each drug were well resolved and had a good peak shape without obvious interference from impurity peaks, and the endogenous substances in the serum did not interfere with the detection, indicating that the method is highly specific and selective (Fig. 1, Fig. 2, Fig. 3).Fig. 133. Antidepressant drugs1-O-desmethylvenlafaxine;2**-**moclobemide-N-Oxide;3-moclobemide;4-hydroxybupropion;5-milnacipran;6-N-desmethylvenlafaxine;7-O-desethylreboxetine;8-venlafaxine;9-bupropion;10-trazodone;11-N-desmethylmianserin;12-desmethylcitalopram;13-citalopram;14-nordoxepin;15-reboxetine;16-mianserin;17-doxepin;18-paroxetine;19-desmethylmaprotiline;20-maprotiline;21-fluvoxamine;22-agomelatine;23-duloxetine;24-norfluoxetine;25-noramitriptyline;26-tianeptine;27-amitriptyline;28-N-desmethylsertraline;29-fluoxetine;30-sertraline;31-N-desmethylclomipramine;32-clomipramine;33-vortioxetine.Fig. 1. Fig. 223 Antipsychotic drugs1-sulpiride;2-amisulpride;3-N-demethylolanzapine;4-olanzapine;5-9-hydroxyrisperidone;6-risperidone;7-reduced hydrohaloperidol;8-ziprasidone;9-N-demethylclozapine;10-norquetiapine;11-clozapine;12-quetiapine;13-haloperidol;14-loxapine;15-dehydroaripiprazole;16-aripiprazole;17-chlorpromazine;18-chlorprothixene;19-perphenazine;20-thioridazine;21-flupentixol;22-fluphenazine;23-lurasidone.Fig. 2. Fig. 315 Anticonvulsant drugs1-Levetiracetam;2-Primidone;3-Lamotrigine;4-Lacosamide;5-Zonisamide;6-licarbazepine;7-Phenobarbital;8-carbamazepine 10,11-epoxide;9-Oxcarbazepine;10-topiramate;11-carbamazepine;12-Phenytoin;13-Clonazepam;14-Valproic acid;15-perampanel.Fig. 3
Linearity and sensitivity
3.2
The drugs analyzed exhibited good linearity in their respective concentration ranges, with correlation coefficients (r) is 0.991–0.999, concentration deviations are 0.14 %–12.61 %, and RSDs at the LLOQ levels are −10.7 %–10.9 % (Table 3).Table 3. Linear range, RSD of the assay at the lower limit of quantification, and bias for 71 neuropsychotropic drugs.Table 3. CompoundLinear range(ng/ml)LinearCorrelationcoefficientrLOQ RSD(%)Deviation from LOD(%)Oxcarbazepine1800∼540000.9936.694.510-hydroxycarbazepine1800∼540000.9974.255.3Epoxide-Carbamazepine900∼270000.9917.116.5Carbamazepine900∼270000.99811.67−7.8Phenobarbital1800∼540000.9933.996.9Primidone900∼270000.9945.77−8.5Phenytoin900∼270000.9956.925.3Valproic acid4500∼1350000.9944.84−8.1Lamotrigine720∼216000.9988.48−3.4Topiramate900∼270000.9928.66−6.7Levetiracetam1800∼540000.9954.564.5Perampanel45∼13500.9963.15−7.1Zonisamide1800∼540000.9968.65−8.2Clonazepam4.5–1350.9999.568.59-Hydroxyrisperidone4.5–1350.9994.537.1Risperidone4.5–1350.9958.426.5N-desmethylolanzapine4.5–1350.9932.39−7.2Olanzapine4.5–1350.9922.353.6N-desmethylclozapine45∼13500.9972.015.6Clozapine45∼13500.9952.50−6.3Aripiprazole45∼13500.9941.92−10.7Dehydroaripiprazole45∼13500.9991.22−7.4Amisulpride28.8–8640.9983.0310.8Perphenazine0.225–6.750.9991.738.9Fluphenazine0.3–300.9991.828.6Haloperidol0.3–300.9991.32−7.3Reducdhaloperidol0.3–300.9971.035.7Flupenthixol0.3–300.9930.464.5Quetiapine45∼13500.9981.36−8.2Thioridazine18∼5400.9991.124.7Lurasidone4.5–1350.9990.925.9Loxapine0.9–270.9993.047.7Chlorpromazine9∼9000.9950.148.1Chlorprothixene6∼6000.9970.9410.9Ziprasidone18∼5400.9981.37−8.4Sulpiride12∼12000.9991.30−9.3Trazodone45∼13500.9931.711.7N-desmetyclomipramine18∼5400.9981.32−4.4Clomipramine18∼5400.9990.42−5.6N-desmethylmianserin4.5–1350.9991.498.6Mianserin4.5–1350.9910.56−5.3N-desmethylmirtazapine4.5–1350.9991.651.3Mirtazapine4.5–1350.9990.48−2.7N-Desmethylvenlafaxine28.8–8640.9920.83−2.4O-Desmethylvenlafaxine28.8–8640.9990.536.2Venlafaxine28.8–8640.9930.731.3O-Deethylreboxetine28.8–8640.9923.843.7Reboxetine28.8–8640.9990.98−5.2Agomelatine6.75–6750.9992.93−2.5Amitriptyline13.5–4050.9981.66−6.2N-Desmethylamitriptyline13.5–4050.9991.524.9Bupropion90∼27000.9991.02−1.6Hydroxybupropion90∼27000.9991.49−3.7Duloxetine9∼2700.9924.00−1.7Doxepin13.5–4050.9944.20−3.7N-Desmethyldoxepin13.5–4050.9923.04−6.9Vortioxetine3.6–1080.9993.952Fluvoxamine18∼5400.9933.585.9Fluoxetine45∼13500.9930.642.6N-Desmethylfluoxetine45∼13500.9991.092.4Maprotiline9∼2700.9922.646.5N-Desmethylmaprotiline9∼2700.9943.07−6.6Moclobemide90∼27000.99912.613.9Moclobemide N-oxindole90∼27000.9994.82−3.2milnacipran13.5–4050.9924.716.8Tianeptine4.5–1350.9996.045.4Paroxetine4.5–1350.9993.422.5Norsertraline4.5–4500.9992.113.1Sertraline4.5–4500.9991.894.2Citalopram9∼2700.9931.223.5N-Desmethylcitalopram9∼2700.9931.223.5
Intra and inter-day validation and accuracy
3.3
For each of the drugs analyzed, the intra-batch RSDs for the three concentration levels, low, medium, and high, were 1.2 %–9.2%and inter-batch RSDs for the three concentration levels were 1.1 %–10.6 %, and the accuracy ranged from 89.59 % to 111.18 % (Table 4).Table 4. Precision and accuracy of methods for the determination of 71 neuropsychotropic drugs.Table 4compoundconcentration(ng/mL)Intra-batch precision(n = 6)Inter-batch precision(n = 18)Accuracy(n = 6)%RSD(%)RSD(%)Oxcarbazepine18005.47.5101.28216003.31.398.05324006.13.898.5810-hydroxycarbazepine18005.32.6102.16216003.62.1100.66324004.61.399.33Epoxide-Carbamazepine90022.9100.07108002.45100.02162003.61.399.85Carbamazepine9002.93.796.021080023.497.53162006.11.594.95Phenobarbital180053.395.98216005.22.796.48324005.41.396.17Primidone9002.93.395.97108002.83.296.34162002.63.498.11Phenytoin9007.83.1102.64108004.24.397.96162005.45.797.83Valproic acid45003.45.692.30540004.34.491.90810003.24.894.30Lamotrigine7204.14101.2786402.72.299.52129602.12.9100.44Topiramate9003.52.1100.67108002.12.1100.71162002.72.698.98Levetiracetam18004.93.2100.54216003.61.297.84324003.71.998.07Perampanel453.65.6100.175405.17.698.588103.28.999.51Zonisamide18004.23.5101.89216005.52.1100.20324009.23.499.36Clonazepam4.56.93.5100.715462.1100.37816.54.399.229-Hydroxyrisperidone4.52.52.899.78542.44.399.23815.31.797.84Risperidone4.54.85.799.65542.83.498.33812.63.597.54N-desmethylolanzapine4.52.62.999.93543.85.498.36813.53.199.70Olanzapine4.547.1102.15542.73.1100.748133.698.59N-desmethylclozapine456.26.599.065402.13.298.708102.46.298.21Clozapine451.58101.215402.28.1100.308103.39.199.09Aripiprazole451.51.3100.065402.33.898.578101.52.897.86Dehydroaripiprazole452.61.9103.085401.62.299.818101.31.895.37Amisulpride28.81.42.699.59345.61.51.4102.63518.42.23.196.66Perphenazine0.2253.72103.852.73.22.4101.534.053.92.297.50Fluphenazine0.33.32.898.622.53.13.695.08102.42.295.62Haloperidol0.32.64.3100.172.53.65.496.55105.22.297.61Reducdhaloperidol0.32.71.5100.002.52.91.197.29103.71.4100.91Flupenthixol0.32.76.3102.842.54.19.299.41104.28.299.01Quetiapine454.69.3102.445403.29.599.508104.18.699.07Thioridazine182.53.6101.802164.69.896.753243.25.996.70Lurasidone4.58.37.2100.60545.77.798.76814.98.897.75Loxapine0.92.87.7103.4510.85.58.999.9516.25.49.499.80Chlorpromazine94.68.999.82754.25.3100.693003.89.399.24Chlorprothixene62.48.399.32504.610.6102.112005.210.699.30Ziprasidone184.110.498.832162.610.199.943242.99.698.09Sulpiride122.610.2102.831006.49.397.564007.36.599.74Trazodone456.77.8100.405403.89.3100.218104.910.1100.26N-desmetyclomipramine183.37.298.932162.47.399.093242.67.5101.04Clomipramine182.32.8101.4621633.799.723244.12.499.26N-desmethylmianserin4.53.13.8100.88542.67.3100.28811.52.699.32Mianserin4.57.12.8100.21544.97.299.11813.45.296.38N-desmethylmirtazapine4.53.17.899.93542.55.998.60813.94.2101.03Mirtazapine4.53.86.1101.33543.13.799.60811.45.797.87N-Desmethylvenlafaxine28.82.11.6101.34345.63.95.398.71518.44.88.2100.71O-Desmethylvenlafaxine28.83.54.6101.08345.61.25.7100.10518.41.54.499.28Venlafaxine28.83.15.293.82345.65.67.591.87518.46.43.893.53O-Deethylreboxetine28.85.45.293.42345.62.25.792.63518.45.67.193.48Reboxetine28.84.65.799.07345.61.72.799.51518.43.53.1103.92Agomelatine6.754.65.5105.4856.251.55.7102.832253.85.699.91Amitriptyline13.55.85.298.681624.36.195.152435.87.895.46N-Desmethylamitriptyline13.54.97.599.651626.78.295.432432.54.194.32Bupropion9045.2100.3210803.44.594.2016205.64.994.78Hydroxybupropion903.47.395.7310804.17.999.7916203.23.9101.24Duloxetine92.15.4103.511083.14.399.851622.66.9100.41Doxepin13.53.17.4103.591623.25.799.922434.49.5103.67N-Desmethyldoxepin13.55.58.398.611626.16.7107.492431.75.594.51Vortioxetine3.62.74.397.9343.25.28.3108.8564.83.27.3104.77Fluvoxamine184.56.894.722164.35.195.673247.34.497.48Fluoxetine454.35.6102.205404.76.3100.768103.17.5103.17N-Desmethylfluoxetine454.17.5104.705403.15.5101.568103.44.2101.56Maprotiline93.21.1100.001083.21.395.241623.14.9105.56N-Desmethylmaprotiline94.13.196.971087.45.5101.851622.25.6103.92Moclobemide9043.2105.5610808.52.198.4316203.62.595.00Moclobemide N-oxindole903.81.496.9210803.96.494.6016203.61.4100.50milnacipran13.561.897.691628.76.7100.6424373.198.50Tianeptine4.576.994.96548.53.4111.18817.11.9109.32Paroxetine4.57.92.4108.37547.21.9102.04817.24.696.51Norsertraline4.53.31.295.4937.53.63.292.551505.76.489.59Sertraline4.53.14.3109.4037.52.53.698.871501.53.598.05Citalopram95.23.9101.121084.82.199.811626.54.3100.03N-Desmethylcitalopram987.4101.071085.76.699.231626.15.7103.24
Matrix effect
3.4
The relative matrix effect results for each analyte were −14.98 %–19.67 % of the required limit (Table 5).Table 5. Matrix effect evaluations of 71 neuropsychotropic drugs.Table 5compoundMean value of detection(ug/mL)CVrelative matrix effectOxcarbazepineMean value of detection(ug/mL)CVrelative matrix effectL6.2101.40 %M20.0290.37 %H31.2680.70 %Serum-L6.3560.33 %−2.84 %Serum-M19.6981.08 %−2.67 %Serum-H31.8240.59 %−2.31 %10-hydroxycarbazepineMean value of detection (ug/mL)CVrelative matrix effectL6.2211.29 %M20.1560.39 %H30.9921.09 %Serum-L6.4612.34 %−0.20 %Serum-M19.8810.53 %−2.41 %Serum-H32.3320.49 %−3.26 %Epoxide-CarbamazepineMean value of detection(ug/mL)CVrelative matrix effectL3.1334.18 %M10.0381.24 %H15.6280.53 %Serum-L3.2473.51 %3.50 %Serum-M9.7243.32 %−3.23 %Serum-H16.0321.07 %4.86 %CarbamazepineMean value of detection(ug/mL)CVrelative matrix effectL3.1290.94 %M10.1650.74 %H15.6691.93 %Serum-L3.1630.84 %−1.74 %Serum-M9.9410.86 %4.88 %Serum-H15.9430.74 %0.72 %PhenobarbitalMean value of detection(ug/mL)CVrelative matrix effectL7.5141.19 %M24.3651.18 %H37.7790.52 %Serum-L7.4900.74 %−0.32 %Serum-M23.8271.02 %−2.26 %Serum-H38.0660.36 %4.86 %PrimidoneMean value of detection(ug/mL)CVrelative matrix effectL3.8900.96 %M12.1981.59 %H18.2711.64 %Serum-L3.9631.93 %1.84 %Serum-M12.2380.88 %0.32 %Serum-H19.0010.46 %4.86 %PhenytoinMean value of detection(ug/mL)CVrelative matrix effectL3.7811.06 %M12.2430.47 %H18.7600.36 %Serum-L3.8200.71 %1.01 %Serum-M11.9560.53 %−2.40 %Serum-H19.1440.26 %4.86 %Valproic acidMean value of detection(ug/mL)CVrelative matrix effectL18.7180.18 %M61.1470.18 %H93.7510.32 %Serum-L19.1590.39 %2.31 %Serum-M59.9060.54 %−2.07 %Serum-H95.8100.12 %4.86 %LamotrigineMean value of detection(ug/mL)CVrelative matrix effectL3.0511.00 %M10.0491.31 %H15.8542.38 %Serum-L3.1832.52 %4.14 %Serum-M10.1863.34 %1.35 %Serum-H16.0201.43 %4.86 %TopiramateMean value of detection(ug/mL)CVrelative matrix effectL2.4881.09 %M8.1602.48 %H12.7272.07 %Serum-L2.5762.07 %3.43 %Serum-M8.0210.96 %−1.73 %Serum-H12.7272.44 %4.86 %LevetiracetamMean value of detection(ug/mL)CVrelative matrix effectL16.0920.57 %M48.6250.90 %H72.2230.57 %Serum-L16.8810.81 %4.68 %Serum-M49.7891.16 %2.34 %Serum-H77.4170.87 %4.86 %PerampanelMean value of detection(ug/mL)CVrelative matrix effectL3.1080.42 %M10.1290.55 %H15.6330.43 %Serum-L3.1600.13 %1.64 %Serum-M9.9230.41 %−2.08 %Serum-H15.8090.43 %4.86 %ZonisamideMean value of detection(ug/mL)CVrelative matrix effectL0.0131.96 %M0.0410.50 %H0.0631.36 %Serum-L0.0131.93 %1.53 %Serum-M0.0411.34 %−0.08 %Serum-H0.0641.03 %4.86 %ClonazepamMean value of detection(ug/mL)CVrelative matrix effectL0.1590.68 %M0.5140.64 %H0.7870.42 %Serum-L0.1640.76 %3.09 %Serum-M0.5070.21 %−1.40 %Serum-H0.8040.46 %4.86 %9-HydroxyrisperidoneMean value of detection(ng/mL)CVrelative matrix effectL4.240.72 %M36.321.05 %H115.270.08 %Serum-L4.210.65 %−0.56 %Serum-M36.860.98 %1.50 %Serum-H116.450.54 %1.02 %RisperidoneMean value of detection(ng/mL)CVrelative matrix effectL4.350.32 %M36.100.84 %H115.910.35 %Serum-L4.342.33 %−0.35 %Serum-M37.120.85 %2.82 %Serum-H118.060.36 %1.85 %N-desmethylolanzapineMean value of detection(ng/mL)CVrelative matrix effectL5.551.36 %M45.980.21 %H147.770.38 %Serum-L5.630.56 %1.45 %Serum-M50.260.31 %9.30 %Serum-H154.580.53 %4.61 %OlanzapineMean value of detection(ng/mL)CVrelative matrix effectL5.500.62 %M45.990.27 %H147.501.05 %Serum-L5.270.36 %−4.04 %Serum-M47.560.76 %3.42 %Serum-H151.521.02 %2.73 %N-demethylclozapineMean value of detection(ng/mL)CVrelative matrix effectL37.490.66 %M308.452.24 %H965.001.18 %Serum-L37.372.23 %−0.32 %Serum-M340.640.79 %10.43 %Serum-H1059.361.08 %9.78 %ClozapineMean value of detection(ng/mL)CVrelative matrix effectL36.450.29 %M301.740.49 %H965.750.95 %Serum-L36.600.13 %0.43 %Serum-M323.111.07 %7.08 %Serum-H983.020.86 %1.79 %AripiprazoleMean value of detection(ng/mL)CVrelative matrix effectL36.854.44 %M330.320.91 %H946.641.29 %Serum-L38.582.01 %4.70 %Serum-M367.492.25 %11.25 %Serum-H1102.791.17 %16.50 %Dehydro aripiprazoleMean value of detection(ng/mL)CVrelative matrix effectL36.380.57 %M314.681.79 %H949.832.12 %Serum-L37.192.15 %2.24 %Serum-M338.951.72 %7.71 %Serum-H1009.950.34 %6.33 %AmisulprideMean value of detection(ng/mL)CVrelative matrix effectL22.674.79 %M196.920.88 %H615.745.00 %Serum-L22.033.07 %−2.84 %Serum-M191.662.97 %−2.67 %Serum-H601.533.50 %−2.31 %PerphenazineMean value of detection(ng/mL)CVrelative matrix effectL0.163.55 %M1.631.24 %H4.852.56 %Serum-L0.162.46 %−4.45 %Serum-M1.681.44 %2.96 %Serum-H4.852.95 %−0.01 %FluphenazineMean value of detection(ng/mL)CVrelative matrix effectL23.321.83 %M193.161.24 %H621.681.08 %Serum-L22.952.08 %−1.58 %Serum-M199.941.08 %3.51 %Serum-H642.021.91 %3.27 %HaloperidolMean value of detection(ng/mL)CVrelative matrix effectSTD918.082.29 %L0.523.68 %M4.512.03 %H14.670.10 %Serum-L0.512.22 %−1.74 %Serum-M4.730.57 %4.88 %Serum-H14.781.02 %0.72 %Reduced haloperidolMean value of detection(ng/mL)CVrelative matrix effectL0.573.81 %M4.620.37 %H14.381.18 %Serum-L0.574.15 %0.05 %Serum-M4.903.85 %6.07 %Serum-H14.763.16 %2.61 %FlupentixolMean value of detection(ng/mL)CVrelative matrix effectL0.551.86 %M4.690.53 %H14.522.04 %Serum-L0.561.06 %0.37 %Serum-M5.013.92 %6.87 %Serum-H16.330.48 %12.50 %QuetiapineMean value of detection(ng/mL)CVrelative matrix effectL36.960.40 %M297.070.85 %H964.950.77 %Serum-L36.791.74 %−0.44 %Serum-M323.700.43 %8.96 %Serum-H1023.300.24 %6.05 %ThioridazineMean value of detection(ng/mL)CVrelative matrix effectL15.190.78 %M123.660.35 %H402.871.59 %Serum-L15.630.98 %2.95 %Serum-M136.491.70 %10.38 %Serum-H418.930.27 %3.99 %LurasidoneMean value of detection(ng/mL)CVrelative matrix effectL4.391.86 %M36.540.37 %H115.660.77 %Serum-L4.010.33 %−8.63 %Serum-M33.280.75 %−8.91 %Serum-H98.340.47 %−14.98 %LoxapineMean value of detection(ng/mL)CVrelative matrix effectL0.773.27 %M5.853.30 %H19.142.26 %Serum-L0.800.30 %4.30 %Serum-M6.502.98 %10.95 %Serum-H21.011.55 %9.77 %ChlorpromazineMean value of detection(ng/mL)CVrelative matrix effectL22.721.59 %M185.100.24 %H575.942.09 %Serum-L21.941.21 %−3.43 %Serum-M195.181.49 %5.45 %Serum-H617.851.87 %7.28 %ChlorprothixeneMean value of detection(ng/mL)CVrelative matrix effectL14.561.20 %M120.761.58 %H390.321.01 %Serum-L14.870.87 %2.10 %Serum-M134.571.63 %11.44 %Serum-H417.581.06 %6.99 %ZiprasidoneMean value of detection(ng/mL)CVrelative matrix effectL14.431.20 %M119.721.14 %H383.861.10 %Serum-L13.871.78 %−3.86 %Serum-M121.510.92 %1.49 %Serum-H389.290.89 %1.41 %SulpirideMean value of detection(ng/mL)CVrelative matrix effectL36.680.25 %M303.970.15 %H961.680.14 %Serum-L35.850.29 %−2.27 %Serum-M319.830.61 %5.22 %Serum-H1003.510.21 %4.35 %TrazodoneMean value of detection(ng/mL)CVrelative matrix effectL42.421.46 %M366.400.69 %H1148.830.25 %Serum-L40.820.28 %−3.77 %Serum-M372.980.90 %1.80 %Serum-H1154.110.47 %0.46 %N-desmetyclomipramineMean value of detection(ng/mL)CVrelative matrix effectL42.714.23 %M363.140.49 %H1173.041.49 %Serum-L40.502.78 %−5.17 %Serum-M376.071.99 %3.56 %Serum-H1200.171.63 %2.31 %ClomipramineMean value of detection(ng/mL)CVrelative matrix effectL16.290.57 %M136.381.25 %H435.370.80 %Serum-L17.751.68 %9.01 %Serum-M157.421.74 %15.43 %Serum-H501.190.73 %15.12 %N-desmethylmianserinMean value of detection(ng/mL)CVrelative matrix effectL5.120.22 %M42.751.33 %H136.131.46 %Serum-L5.302.28 %3.48 %Serum-M45.831.66 %7.20 %Serum-H140.670.96 %3.33 %MianserinMean value of detection(ng/mL)CVrelative matrix effectL5.252.34 %M42.821.78 %H134.361.72 %Serum-L4.903.40 %−6.66 %Serum-M44.132.37 %3.05 %Serum-H134.341.34 %−0.02 %N-desmethylmirtazapineMean value of detection(ng/mL)CVrelative matrix effectM49.270.32 %H153.080.94 %Serum-L5.060.75 %−13.59 %Serum-M46.370.23 %−5.89 %Serum-H146.300.90 %−4.43 %MirtazapineMean value of detection(ng/mL)CVrelative matrix effectL5.981.71 %M48.730.43 %H156.230.93 %Serum-L6.034.39 %0.86 %Serum-M51.321.05 %5.31 %Serum-H162.550.72 %4.05 %N-desmethylvenlafaxineMean value of detection(ng/mL)CVrelative matrix effectL29.961.70 %M247.491.09 %H776.851.21 %Serum-L35.270.25 %17.74 %Serum-M212.050.49 %−14.32 %Serum-H877.971.45 %13.02 %O-desmethylvenlafaxineMean value of detection(ng/mL)CVrelative matrix effectL29.690.91 %M244.540.50 %H779.080.36 %Serum-L32.571.03 %9.72 %Serum-M279.260.36 %14.20 %Serum-H854.480.59 %9.68 %VenlafaxineMean value of detection(ng/mL)CVrelative matrix effectL28.932.24 %M231.650.60 %H807.130.31 %Serum-L27.450.26 %−5.14 %Serum-M234.241.10 %1.12 %Serum-H960.671.18 %19.02 %O-DeethylreboxetineMean value of detection(ng/mL)CVrelative matrix effectL26.050.84 %M203.860.42 %H691.371.30 %Serum-L26.044.11 %−0.05 %Serum-M211.321.86 %3.66 %Serum-H718.150.84 %3.87 %ReboxetineMean value of detection(ng/mL)CVrelative matrix effectL25.671.45 %M212.920.95 %H674.221.73 %Serum-L26.240.17 %2.19 %Serum-M227.830.50 %7.00 %Serum-H738.361.36 %9.51 %AgomelatineMean value of detection(ng/mL)CVrelative matrix effectL21.853.60 %M178.461.68 %H577.660.49 %Serum-L23.301.13 %6.66 %Serum-M200.681.07 %12.45 %Serum-H634.121.14 %9.77 %AmitriptylineMean value of detection(ng/mL)CVrelative matrix effectL11.171.98 %M91.791.48 %H290.380.22 %Serum-L10.701.11 %−4.22 %Serum-M99.712.77 %8.63 %Serum-H305.000.35 %5.04 %N-DesmethylamitriptylineMean value of detection(ng/mL)CVrelative matrix effectL10.861.78 %M93.011.35 %H286.741.01 %Serum-L10.883.52 %0.16 %Serum-M95.611.60 %2.80 %Serum-H291.251.72 %1.57 %BupropionMean value of detection(ng/mL)CVrelative matrix effectL71.641.35 %M575.450.90 %H2006.700.46 %Serum-L76.673.21 %7.03 %Serum-M625.350.14 %8.67 %Serum-H2105.461.16 %4.92 %HydroxybupropionMean value of detection(ng/mL)CVrelative matrix effectL73.890.67 %M649.460.99 %H1933.570.82 %Serum-L83.710.40 %13.30 %Serum-M768.690.68 %18.36 %Serum-H2098.470.69 %8.53 %DuloxetineMean value of detection(ng/mL)CVrelative matrix effectL8.306.19 %M71.713.67 %H231.060.88 %Serum-L8.425.76 %1.42 %Serum-M75.385.46 %5.12 %Serum-H235.262.13 %1.82 %DoxepinMean value of detection(ng/mL)CVrelative matrix effectL10.971.32 %M93.055.18 %H290.030.27 %Serum-L10.911.77 %−0.54 %Serum-M96.070.99 %3.25 %Serum-H306.580.65 %5.71 %N-DesmethyldoxepinMean value of detection(ng/mL)CVrelative matrix effectL12.1415.05 %M91.430.53 %H291.200.26 %Serum-L10.751.41 %−11.46 %Serum-M95.740.66 %4.72 %Serum-H301.251.17 %3.45 %VortioxetineMean value of detection(ng/mL)CVrelative matrix effectL2.890.75 %M24.101.50 %H77.831.47 %Serum-L2.852.57 %−1.45 %Serum-M25.322.07 %5.07 %Serum-H81.030.77 %4.11 %FluvoxamineMean value of detection(ng/mL)CVrelative matrix effectL17.780.64 %M149.261.74 %H483.930.43 %Serum-L16.900.78 %−4.95 %Serum-M153.930.80 %3.13 %Serum-H479.971.17 %−0.82 %FluoxetineMean value of detection(ng/mL)CVrelative matrix effectL37.561.80 %M312.083.00 %H992.461.86 %Serum-L37.122.48 %−1.18 %Serum-M338.942.67 %8.61 %Serum-H1013.171.19 %2.09 %N-DesmethylfluoxetineMean value of detection(ng/mL)CVrelative matrix effectL36.803.47 %M305.702.86 %H941.121.45 %Serum-L38.321.17 %4.13 %Serum-M341.402.46 %11.68 %Serum-H1066.491.12 %13.32 %MaprotilineMean value of detection(ng/mL)CVrelative matrix effectL8.051.41 %M66.421.09 %H211.713.02 %Serum-L8.131.64 %1.01 %Serum-M70.530.30 %6.19 %Serum-H223.602.18 %5.61 %N-DesmethylmaprotilineMean value of detection(ng/mL)CVrelative matrix effectL8.543.60 %M63.162.92 %H211.611.81 %Serum-L9.302.75 %8.92 %Serum-M70.281.08 %11.28 %Serum-H250.942.61 %18.59 %MoclobemideMean value of detection(ng/mL)CVrelative matrix effectL72.670.61 %M617.120.99 %H1926.880.97 %Serum-L72.911.07 %0.33 %Serum-M639.480.39 %3.62 %Serum-H1985.840.82 %3.06 %Moclobemide-N-OxideMean value of detection(ng/mL)CVrelative matrix effectL73.440.98 %M628.500.44 %H1913.760.37 %Serum-L76.541.99 %4.23 %Serum-M698.420.85 %11.12 %Serum-H2103.050.34 %9.89 %milnacipranMean value of detection(ng/mL)CVrelative matrix effectL45.333.32 %M366.440.96 %H1100.770.79 %Serum-L51.592.06 %13.81 %Serum-M435.710.83 %18.91 %Serum-H1251.560.67 %13.70 %TianeptineMean value of detection(ng/mL)CVrelative matrix effectL5.781.20 %M48.012.45 %H152.461.36 %Serum-L5.710.67 %−1.28 %Serum-M50.080.53 %4.32 %Serum-H157.133.04 %3.07 %ParoxetineMean value of detection(ng/mL)CVrelative matrix effectL4.254.00 %M35.991.60 %H117.020.56 %Serum-L4.702.03 %10.57 %Serum-M43.072.48 %19.67 %Serum-H133.721.94 %14.27 %NorsertralineMean value of detection(ng/mL)CVrelative matrix effectL41.683.63 %M363.164.53 %H1161.355.07 %Serum-L44.273.30 %6.21 %Serum-M388.773.20 %7.05 %Serum-H1213.230.98 %4.47 %SertralineMean value of detection(ng/mL)CVrelative matrix effectL10.643.00 %M87.301.90 %H288.471.22 %Serum-L12.055.66 %13.31 %Serum-M102.492.39 %17.41 %Serum-H341.992.18 %18.55 %CitalopramMean value of detection(ng/mL)CVrelative matrix effectL7.920.82 %M67.101.79 %H212.040.30 %Serum-L8.101.53 %2.38 %Serum-M72.190.94 %7.58 %Serum-H226.080.64 %6.62 %N-DesmethylcitalopramMean value of detection(ng/mL)CVrelative matrix effectL5.740.51 %M48.230.06 %H153.410.18 %Serum-L5.472.38 %−4.64 %Serum-M42.320.99 %−12.25 %Serum-H134.130.84 %−12.57 %
Stability evaluation
3.5
All compounds except moclobemide N-oxindole left at room temperature for 7 days were −13.25 %–14.91 %15 % deviation from the control (Table 6).Table 6. Stability evaluations of 71 neuropsychotropic drugs.Table 6. CompoundMean value of detection(ug/mL)CVDeviation from control groupOxcarbazepineL-CONTROL GROUP6.2152.51 %L-1d6.2452.64 %0.48 %L-2d6.3152.58 %1.61 %L-3d6.5422.69 %5.26 %L-5d6.5842.57 %5.94 %L-7d6.2352.68 %0.32 %M-CONTROL GROUP20.1542.61 %M-1d20.1652.84 %0.05 %M-2d20.4872.91 %1.65 %M-3d20.6982.06 %2.70 %M-5d20.6511.87 %2.47 %M-7d20.5121.95 %1.78 %H-CONTROL GROUP31.5481.54 %H-1d31.5731.64 %0.08 %H-2d31.6541.65 %0.34 %H-3d31.5871.62 %0.12 %H-5d31.2561.54 %−0.93 %H-7d31.2651.02 %−0.90 %10-hydroxycarbazepineMean value of detection(ug/mL)CVL-CONTROL GROUP6.3452.33 %L-1d6.4452.34 %1.58 %L-2d6.2152.78 %−2.05 %L-3d6.3422.61 %−0.05 %L-5d6.2342.44 %−1.75 %L-7d6.2022.35 %−2.25 %M-CONTROL GROUP20.2612.41 %M-1d20.1152.64 %−0.72 %M-2d20.3672.71 %0.52 %M-3d20.0882.86 %−0.85 %M-5d20.1611.94 %−0.49 %M-7d20.4722.51 %1.04 %H-CONTROL GROUP32.1121.77 %H-1d31.6541.86 %−1.43 %H-2d31.8841.69 %−0.71 %H-3d31.4672.04 %−2.01 %H-5d32.3462.11 %0.73 %H-7d32.3351.95 %0.69 %Epoxide-CarbamazepineMean value of detection(ug/mL)CVL-CONTROL GROUP3.0982.61 %L-1d3.0573.51 %−1.32 %L-2d3.0583.45 %−1.29 %L-3d3.0592.98 %−1.26 %L-5d3.0652.65 %−1.07 %L-7d3.0142.61 %−2.71 %M-CONTROL GROUP10.2872.51 %M-1d10.6872.61 %3.89 %M-2d10.5482.05 %2.54 %M-3d10.5242.64 %2.30 %M-5d10.2612.58 %−0.25 %M-7d10.3652.94 %0.76 %H-CONTROL GROUP15.5512.65 %H-1d15.2361.85 %−2.03 %H-2d15.2471.64 %−1.95 %H-3d15.1471.95 %−2.60 %H-5d15.2481.64 %−1.95 %H-7d15.1691.94 %−2.46 %CarbamazepineMean value of detection(ug/mL)CVL-CONTROL GROUP3.1250.15 %L-1d3.2580.16 %4.26 %L-2d3.1590.25 %1.09 %L-3d3.1480.14 %0.74 %L-5d3.5910.81 %14.91 %L-7d3.2690.64 %4.61 %M-CONTROL GROUP10.1580.55 %M-1d10.2640.61 %1.04 %M-2d10.2580.74 %0.98 %M-3d10.2640.62 %1.04 %M-5d10.2670.95 %1.07 %M-7d10.5430.84 %3.79 %H-CONTROL GROUP15.1260.37 %H-1d15.2540.65 %0.85 %H-2d15.2470.82 %0.80 %H-3d15.3240.31 %1.31 %H-5d15.3690.61 %1.61 %H-7d15.4830.51 %2.36 %PhenobarbitalMean value of detection(ug/mL)CVL-CONTROL GROUP7.4160.15 %L-1d7.2640.16 %−2.05 %L-2d7.5610.07 %1.96 %L-3d7.4620.04 %0.62 %L-5d7.5220.28 %1.43 %L-7d7.5220.41 %1.43 %M-CONTROL GROUP24.690.15 %M-1d24.6330.61 %−0.23 %M-2d24.8950.51 %0.83 %M-3d24.5170.95 %−0.70 %M-5d24.3660.74 %−1.31 %M-7d24.1560.81 %−2.16 %H-CONTROL GROUP37.8110.27 %H-1d37.8910.78 %0.21 %H-2d37.6511.06 %−0.42 %H-3d37.5120.15 %−0.79 %H-5d37.6521.23 %−0.42 %H-7d37.5610.17 %−0.66 %PrimidoneMean value of detection(ug/mL)CVL-CONTROL GROUP3.8913.25 %L-1d3.8453.20 %−1.18 %L-2d3.7982.05 %−2.39 %L-3d3.6582.69 %−5.99 %L-5d3.7952.64 %−2.47 %L-7d3.9512.81 %1.54 %M-CONTROL GROUP12.5462.61 %M-1d12.1942.35 %−2.81 %M-2d12.2692.34 %−2.21 %M-3d12.5142.60 %−0.26 %M-5d12.6212.55 %0.60 %M-7d12.3542.66 %−1.53 %H-CONTROL GROUP18.2452.34 %H-1d18.2612.87 %0.09 %H-2d18.2412.91 %−0.02 %H-3d18.6542.54 %2.24 %H-5d18.3262.68 %0.44 %H-7d18.3642.15 %0.65 %PhenytoinMean value of detection(ug/mL)CVL-CONTROL GROUP3.2751.23 %L-1d3.5481.25 %8.34 %L-2d3.3750.07 %3.05 %L-3d3.2870.47 %0.37 %L-5d3.2690.15 %−0.18 %L-7d3.1360.15 %−4.24 %M-CONTROL GROUP12.1361.20 %M-1d12.3651.30 %1.89 %M-2d12.1541.60 %0.15 %M-3d12.6211.50 %4.00 %M-5d12.1531.75 %0.14 %M-7d12.5232.14 %3.19 %H-CONTROL GROUP18.7522.30 %H-1d18.5042.88 %−1.32 %H-2d18.2472.10 %−2.69 %H-3d18.6950.78 %−0.30 %H-5d18.160.91 %−3.16 %H-7d18.6550.69 %−0.52 %Valproic acidMean value of detection(ug/mL)CVL-CONTROL GROUP18.3620.84 %L-1d18.2560.15 %−0.58 %L-2d18.2540.36 %−0.59 %L-3d18.6520.24 %1.58 %L-5d18.260.51 %−0.56 %L-7d18.4560.69 %0.51 %M-CONTROL GROUP61.5480.48 %M-1d61.5890.15 %0.07 %M-2d61.5320.67 %−0.03 %M-3d61.5870.08 %0.06 %M-5d61.520.05 %−0.05 %M-7d61.2450.18 %−0.49 %H-CONTROL GROUP93.2780.26 %H-1d93.1570.48 %−0.13 %H-2d93.6840.69 %0.44 %H-3d93.1540.15 %−0.13 %H-5d94.0121.20 %0.79 %H-7d93.1582.30 %−0.13 %LamotrigineMean value of detection(ug/mL)CVL-CONTROL GROUP3.0622.64 %L-1d3.0582.08 %−0.13 %L-2d3.0692.57 %0.23 %L-3d3.0872.64 %0.82 %L-5d3.0542.84 %−0.26 %L-7d3.0552.51 %−0.23 %M-CONTROL GROUP0.7840.15 %M-1d0.7810.45 %−0.38 %M-2d0.7820.65 %−0.26 %M-3d0.7790.12 %−0.64 %M-5d0.7880.61 %0.51 %M-7d0.7990.54 %1.91 %H-CONTROL GROUP18.8540.81 %H-1d18.5910.61 %−1.39 %H-2d18.9410.51 %0.46 %H-3d18.6140.64 %−1.27 %H-5d18.2510.62 %−3.20 %H-7d18.6140.81 %−1.27 %TopiramateMean value of detection(ug/mL)CVL-CONTROL GROUP2.4150.27 %L-1d2.4231.50 %0.33 %L-2d2.5163.90 %4.18 %L-3d2.4262.47 %0.46 %L-5d2.4371.34 %0.91 %L-7d2.5981.19 %7.58 %M-CONTROL GROUP8.1252.35 %M-1d8.1651.24 %0.49 %M-2d8.1471.98 %0.27 %M-3d8.4561.54 %4.07 %M-5d8.5911.65 %5.74 %M-7d8.4171.61 %3.59 %H-CONTROL GROUP12.7361.45 %H-1d12.8450.57 %0.86 %H-2d12.6510.64 %−0.67 %H-3d12.9540.91 %1.71 %H-5d12.3260.54 %−3.22 %H-7d12.4590.87 %−2.17 %LevetiracetamMean value of detection(ug/mL)CVL-CONTROL GROUP16.5125.20 %L-1d16.2542.61 %−1.56 %L-2d16.2312.90 %−1.70 %L-3d16.2453.50 %−1.62 %L-5d16.2542.10 %−1.56 %L-7d16.3252.30 %−1.13 %M-CONTROL GROUP48.5143.15 %M-1d48.6510.94 %0.28 %M-2d48.5720.81 %0.12 %M-3d48.1360.66 %−0.78 %M-5d48.2670.86 %−0.51 %M-7d48.6271.25 %0.23 %H-CONTROL GROUP72.2153.20 %H-1d72.5492.15 %0.46 %H-2d72.4562.36 %0.33 %H-3d72.1973.16 %−0.02 %H-5d72.8413.26 %0.87 %H-7d72.5142.58 %0.41 %PerampanelMean value of detection(ug/mL)CVL-CONTROL GROUP3.1561.36 %L-1d3.1252.36 %−0.98 %L-2d3.2541.34 %3.11 %L-3d3.1692.05 %0.41 %L-5d3.1582.36 %0.06 %L-7d3.2651.54 %3.45 %M-CONTROL GROUP10.2361.54 %M-1d10.2352.58 %−0.01 %M-2d10.9513.21 %6.99 %M-3d10.5420.51 %2.99 %M-5d10.3540.91 %1.15 %M-7d10.2540.78 %0.18 %H-CONTROL GROUP15.2680.51 %H-1d15.6470.34 %2.48 %H-2d15.2980.35 %0.20 %H-3d15.7510.16 %3.16 %H-5d15.4930.16 %1.47 %H-7d15.2470.45 %−0.14 %ZonisamideMean value of detection(ug/mL)CVL-CONTROL GROUP0.0120.15 %L-1d0.0130.12 %8.33 %L-2d0.0130.13 %8.33 %L-3d0.0134.56 %8.33 %L-5d0.0120.51 %0.00 %L-7d0.0130.61 %8.33 %M-CONTROL GROUP0.0410.41 %M-1d0.0420.51 %2.44 %M-2d0.0410.56 %0.00 %M-3d0.0430.98 %4.88 %M-5d0.0410.61 %0.00 %M-7d0.0450.71 %9.76 %H-CONTROL GROUP0.0630.51 %H-1d0.0610.84 %−3.17 %H-2d0.0620.70 %−1.59 %H-3d0.0620.61 %−1.59 %H-5d0.0610.62 %−3.17 %H-7d0.0630.38 %0.00 %ClonazepamMean value of detection(ug/mL)CVL-CONTROL GROUP0.1561.25 %L-1d0.1581.3.6 %1.28 %L-2d0.1481.28 %−5.13 %L-3d0.1572.52 %0.64 %L-5d0.1471.47 %−5.77 %L-7d0.1551.35 %−0.64 %M-CONTROL GROUP0.5141.32 %M-1d0.5131.64 %−0.19 %M-2d0.5190.25 %0.97 %M-3d0.5180.58 %0.78 %M-5d0.5170.61 %0.58 %M-7d0.5110.47 %−0.58 %H-CONTROL GROUP0.7890.26 %H-1d0.7840.51 %−0.63 %H-2d0.7860.64 %−0.38 %H-3d0.7530.14 %−4.56 %H-5d0.7910.58 %0.25 %H-7d0.7790.67 %−1.27 %9-HydroxyrisperidoneMean value of detection(ng/mL)CVL-CONTROL GROUP4.331.33 %L-1d4.172.77 %−3.70 %L-2d4.171.39 %−3.70 %L-3d4.273.58 %−1.39 %L-5d4.231.36 %−2.31 %L-7d4.131.40 %−4.62 %M-CONTROL GROUP35.531.07 %M-1d35.471.33 %−0.17 %M-2d34.20.00 %−3.74 %M-3d34.070.34 %−4.11 %M-5d34.20.51 %−3.74 %M-7d34.230.34 %−3.66 %H-CONTROL GROUP114.830.48 %H-1d113.370.75 %−1.27 %H-2d111.870.31 %−2.58 %H-3d110.670.94 %−3.62 %H-5d114.230.39 %−0.52 %H-7d110.030.64 %−4.18 %RisperidoneMean value of detection(ng/mL)CVL-CONTROL GROUP4.771.21 %L-1d4.631.25 %−2.94 %L-2d4.571.26 %−4.19 %L-3d4.731.22 %−0.84 %L-5d4.771.21 %0.00 %L-7d4.50.00 %−5.66 %M-CONTROL GROUP36.60.72 %M-1d370.81 %1.09 %M-2d35.130.43 %−4.02 %M-3d35.330.16 %−3.47 %M-5d35.81.12 %−2.19 %M-7d35.330.16 %−3.47 %H-CONTROL GROUP117.20.23 %H-1d116.30.73 %−0.77 %H-2d115.030.35 %−1.85 %H-3d113.470.31 %−3.18 %H-5d117.730.40 %0.45 %H-7d1151.15 %−1.88 %N-desmethylolanzapineMean value of detection(ng/mL)CVL-CONTROL GROUP5.69.45 %L-1d5.477.62 %−2.32 %L-2d5.4310.78 %−3.04 %L-3d5.231.10 %−6.61 %L-5d5.631.02 %0.54 %L-7d5.278.97 %−5.89 %M-CONTROL GROUP46.275.44 %M-1d48.674.86 %5.19 %M-2d45.675.26 %−1.30 %M-3d44.738.41 %−3.33 %M-5d46.710.10 %0.93 %M-7d41.673.04 %−9.94 %H-CONTROL GROUP144.56.50 %H-1d152.139.02 %5.28 %H-2d145.412.41 %0.62 %H-3d150.51.31 %4.15 %H-5d155.98.15 %7.89 %H-7d148.1710.47 %2.54 %OlanzapineMean value of detection(ng/mL)CVL-CONTROL GROUP5.71.75 %L-1d5.50.00 %−3.51 %L-2d5.471.06 %−4.04 %L-3d5.572.07 %−2.28 %L-5d5.471.06 %−4.04 %L-7d5.431.06 %−4.74 %M-CONTROL GROUP45.170.46 %M-1d45.70.22 %1.17 %M-2d43.630.48 %−3.41 %M-3d43.30.23 %−4.14 %M-5d43.571.16 %−3.54 %M-7d43.40.69 %−3.92 %H-CONTROL GROUP147.730.88 %H-1d145.630.88 %−1.42 %H-2d143.70.30 %−2.73 %H-3d142.270.49 %−3.70 %H-5d147.60.98 %−0.09 %H-7d141.570.76 %−4.17 %N-desmethylclozapineMean value of detection(ng/mL)CVL-CONTROL GROUP36.831.50 %L-1d35.831.98 %−2.72 %L-2d36.331.77 %−1.36 %L-3d37.230.41 %1.09 %L-5d36.71.52 %−0.35 %L-7d36.973.14 %0.38 %M-CONTROL GROUP299.431.56 %M-1d298.41.63 %−0.34 %M-2d287.331.20 %−4.04 %M-3d288.672.25 %−3.59 %M-5d291.232.00 %−2.74 %M-7d296.830.80 %−0.87 %H-CONTROL GROUP962.630.29 %H-1d939.21.82 %−2.43 %H-2d944.70.90 %−1.86 %H-3d926.070.89 %−3.80 %H-5d959.831.93 %−0.29 %H-7d945.072.46 %−1.82 %ClozapineMean value of detection(ng/mL)CVL-CONTROL GROUP36.60.27 %L-1d35.471.72 %−3.09 %L-2d35.71.12 %−2.46 %L-3d36.331.11 %−0.74 %L-5d36.271.41 %−0.90 %L-7d36.330.32 %−0.74 %M-CONTROL GROUP301.60.95 %M-1d305.40.26 %1.26 %M-2d293.630.51 %−2.64 %M-3d294.91.56 %−2.22 %M-5d300.271.32 %−0.44 %M-7d294.830.65 %−2.24 %H-CONTROL GROUP976.271.34 %H-1d966.571.52 %−0.99 %H-2d950.370.92 %−2.65 %H-3d960.471.07 %−1.62 %H-5d990.70.72 %1.48 %H-7d964.270.97 %−1.23 %AripiprazoleMean value of detection(ng/mL)CVL-CONTROL GROUP35.572.03 %L-1d33.32.60 %−6.38 %L-2d33.14.72 %−6.94 %L-3d33.372.11 %−6.18 %L-5d33.831.88 %−4.89 %L-7d33.231.71 %−6.58 %M-CONTROL GROUP297.632.11 %M-1d300.772.49 %1.06 %M-2d282.82.35 %−4.98 %M-3d284.61.35 %−4.38 %M-5d287.12.00 %−3.54 %M-7d280.471.06 %−5.77 %H-CONTROL GROUP921.30.88 %H-1d920.131.03 %−0.13 %H-2d899.81.56 %−2.33 %H-3d895.971.03 %−2.75 %H-5d928.071.00 %0.73 %H-7d882.90.61 %−4.17 %Dehydro aripiprazoleMean value of detection(ng/mL)CVL-CONTROL GROUP37.630.77 %L-1d35.44.18 %−5.93 %L-2d34.80.76 %−7.52 %L-3d35.531.14 %−5.58 %L-5d35.71.22 %−5.13 %L-7d35.071.08 %−6.80 %M-CONTROL GROUP311.431.08 %M-1d315.91.34 %1.44 %M-2d295.230.91 %−5.20 %M-3d300.471.83 %−3.52 %M-5d300.470.19 %−3.52 %M-7d294.530.43 %−5.43 %H-CONTROL GROUP929.70.83 %H-1d928.870.13 %−0.09 %H-2d905.10.31 %−2.65 %H-3d903.331.11 %−2.84 %H-5d921.170.35 %−0.92 %H-7d892.31.15 %−4.02 %AmisulprideMean value of detection(ng/mL)CVL-CONTROL GROUP22.23.90 %L-1d21.775.32 %−1.94 %L-2d22.275.01 %0.32 %L-3d23.132.75 %4.19 %L-5d22.171.38 %−0.14 %L-7d22.84.39 %2.70 %M-CONTROL GROUP184.42.54 %M-1d180.772.14 %−1.97 %M-2d177.71.50 %−3.63 %M-3d178.24.91 %−3.36 %M-5d180.535.26 %−2.10 %M-7d1902.34 %3.04 %H-CONTROL GROUP611.233.22 %H-1d588.375.11 %−3.74 %H-2d591.175.80 %−3.28 %H-3d577.870.98 %−5.46 %H-5d603.13.62 %−1.33 %H-7d597.334.36 %−2.27 %PerphenazineMean value of detection(ng/mL)CVL-CONTROL GROUP0.20.00 %L-1d0.20.00 %0.00 %L-2d0.20.00 %0.00 %L-3d0.20.00 %0.00 %L-5d0.20.00 %0.00 %L-7d0.20.00 %0.00 %M-CONTROL GROUP1.66.25 %M-1d1.573.69 %−1.88 %M-2d1.573.69 %−1.88 %M-3d1.56.67 %−6.25 %M-5d1.533.77 %−4.38 %M-7d1.66.25 %0.00 %H-CONTROL GROUP5.41.85 %H-1d5.53.64 %1.85 %H-2d5.131.12 %−5.00 %H-3d5.233.98 %−3.15 %H-5d5.571.04 %3.15 %H-7d5.371.08 %−0.56 %FluphenazineMean value of detection(ng/mL)CVL-CONTROL GROUP0.361.08 %L-1d0.342.98 %−5.56 %L-2d0.360.00 %0.00 %L-3d0.383.90 %5.56 %L-5d0.362.86 %0.00 %L-7d0.351.89 %−2.78 %M-CONTROL GROUP12.631.15 %M-1d12.882.74 %1.98 %M-2d12.351.20 %−2.22 %M-3d12.212.92 %−3.33 %M-5d12.313.08 %−2.53 %M-7d12.711.36 %0.63 %H-CONTROL GROUP24.010.81 %H-1d24.052.06 %0.17 %H-2d24.112.46 %0.42 %H-3d24.161.79 %0.62 %H-5d24.382.39 %1.54 %H-7d24.172.26 %0.67 %HaloperidolMean value of detection(ng/mL)CVL-CONTROL GROUP0.50.00 %L-1d0.50.00 %0.00 %L-2d0.50.00 %0.00 %L-3d0.50.00 %0.00 %L-5d0.50.00 %0.00 %L-7d0.50.00 %0.00 %M-CONTROL GROUP4.40.00 %M-1d4.42.27 %0.00 %M-2d4.271.35 %−2.95 %M-3d4.32.33 %−2.27 %M-5d4.371.32 %−0.68 %M-7d4.371.32 %−0.68 %H-CONTROL GROUP14.271.07 %H-1d14.031.48 %−1.68 %H-2d13.931.10 %−2.38 %H-3d13.90.72 %−2.59 %H-5d14.61.19 %2.31 %H-7d14.131.78 %−0.98 %Reducd haloperidolMean value of detection(ng/mL)CVL-CONTROL GROUP0.54.64 %L-1d0.5310.83 %6.00 %L-2d0.510.00 %2.00 %L-3d0.5210.67 %4.00 %L-5d0.5210.19 %4.00 %L-7d0.519.12 %2.00 %M-CONTROL GROUP4.83.61 %M-1d4.772.42 %−0.63 %M-2d4.631.25 %−3.54 %M-3d4.777.37 %−0.63 %M-5d4.831.19 %0.63 %M-7d4.773.20 %−0.63 %H-CONTROL GROUP16.335.69 %H-1d16.032.60 %−1.84 %H-2d15.95.76 %−2.63 %H-3d15.931.81 %−2.45 %H-5d17.14.79 %4.72 %H-7d16.33.73 %−0.18 %FlupentixolMean value of detection(ng/mL)CVL-CONTROL GROUP0.60.00 %L-1d0.60.00 %0.00 %L-2d0.639.12 %5.00 %L-3d0.60.00 %0.00 %L-5d0.60.00 %0.00 %L-7d0.60.00 %0.00 %M-CONTROL GROUP4.62.17 %M-1d4.731.22 %2.83 %M-2d4.572.53 %−0.65 %M-3d4.50.00 %−2.17 %M-5d4.671.24 %1.52 %M-7d4.675.39 %1.52 %H-CONTROL GROUP15.130.38 %H-1d14.92.42 %−1.52 %H-2d14.932.05 %−1.32 %H-3d14.80.68 %−2.18 %H-5d15.272.00 %0.93 %H-7d15.172.01 %0.26 %QuetiapineMean value of detection(ng/mL)CVL-CONTROL GROUP35.431.60 %L-1d34.40.00 %−2.91 %L-2d34.72.18 %−2.06 %L-3d36.032.50 %1.69 %L-5d35.070.59 %−1.02 %L-7d35.171.18 %−0.73 %M-CONTROL GROUP290.70.79 %M-1d296.11.08 %1.86 %M-2d282.231.02 %−2.91 %M-3d285.60.40 %−1.75 %M-5d289.11.11 %−0.55 %M-7d293.40.61 %0.93 %H-CONTROL GROUP961.40.48 %H-1d945.971.53 %−1.60 %H-2d948.171.38 %−1.38 %H-3d934.570.46 %−2.79 %H-5d983.631.30 %2.31 %H-7d961.330.95 %−0.01 %ThioridazineMean value of detection(ng/mL)CVL-CONTROL GROUP14.670.39 %L-1d14.21.41 %−3.20 %L-2d14.230.41 %−3.00 %L-3d14.470.80 %−1.36 %L-5d14.230.81 %−3.00 %L-7d13.970.41 %−4.77 %M-CONTROL GROUP124.970.12 %M-1d124.80.14 %−0.14 %M-2d118.830.35 %−4.91 %M-3d117.770.30 %−5.76 %M-5d118.170.93 %−5.44 %M-7d116.970.32 %−6.40 %H-CONTROL GROUP416.570.40 %H-1d413.20.98 %−0.81 %H-2d404.130.61 %−2.99 %H-3d399.470.45 %−4.10 %H-5d408.330.15 %−1.98 %H-7d393.20.23 %−5.61 %LurasidoneMean value of detection(ng/mL)CVL-CONTROL GROUP4.231.36 %L-1d4.10.00 %−3.07 %L-2d4.10.00 %−3.07 %L-3d4.20.00 %−0.71 %L-5d4.131.40 %−2.36 %L-7d4.031.43 %−4.73 %M-CONTROL GROUP35.230.59 %M-1d35.50.56 %0.77 %M-2d34.030.17 %−3.41 %M-3d33.81.07 %−4.06 %M-5d33.90.29 %−3.78 %M-7d33.230.17 %−5.68 %H-CONTROL GROUP115.030.22 %H-1d113.30.55 %−1.50 %H-2d111.370.61 %−3.18 %H-3d111.271.02 %−3.27 %H-5d114.10.84 %−0.81 %H-7d109.271.56 %−5.01 %LoxapineMean value of detection(ng/mL)CVL-CONTROL GROUP0.70.00 %L-1d0.70.00 %0.00 %L-2d0.70.00 %0.00 %L-3d0.70.00 %0.00 %L-5d0.70.00 %0.00 %L-7d0.70.00 %0.00 %M-CONTROL GROUP6.133.39 %M-1d6.24.84 %1.14 %M-2d5.732.01 %−6.53 %M-3d6.032.53 %−1.63 %M-5d6.132.49 %0.00 %M-7d5.931.95 %−3.26 %H-CONTROL GROUP20.031.04 %H-1d19.632.30 %−2.00 %H-2d19.31.37 %−3.64 %H-3d19.42.36 %−3.15 %H-5d20.431.98 %2.00 %H-7d19.80.51 %−1.15 %ChlorpromazineMean value of detection(ng/mL)CVL-CONTROL GROUP20.270.57 %L-1d18.673.27 %−7.89 %L-2d18.830.81 %−7.10 %L-3d19.670.29 %−2.96 %L-5d18.71.85 %−7.75 %L-7d19.371.81 %−4.44 %M-CONTROL GROUP164.831.17 %M-1d162.671.63 %−1.31 %M-2d153.671.26 %−6.77 %M-3d156.071.80 %−5.31 %M-5d156.033.79 %−5.34 %M-7d156.070.46 %−5.31 %H-CONTROL GROUP550.232.05 %H-1d504.76.23 %−8.27 %H-2d535.932.52 %−2.60 %H-3d526.831.38 %−4.25 %H-5d527.172.84 %−4.19 %H-7d520.733.65 %−5.36 %ChlorprothixeneMean value of detection(ng/mL)CVL-CONTROL GROUP14.770.39 %L-1d14.171.78 %−4.06 %L-2d14.571.05 %−1.35 %L-3d14.971.54 %1.35 %L-5d14.91.78 %0.88 %L-7d151.33 %1.56 %M-CONTROL GROUP125.20.32 %M-1d126.530.61 %1.06 %M-2d123.570.86 %−1.30 %M-3d1220.50 %−2.56 %M-5d124.670.32 %−0.42 %M-7d125.71.33 %0.40 %H-CONTROL GROUP385.570.58 %H-1d384.50.40 %−0.28 %H-2d383.730.28 %−0.48 %H-3d383.20.28 %−0.61 %H-5d399.370.98 %3.58 %H-7d392.371.06 %1.76 %ZiprasidoneMean value of detection(ng/mL)CVL-CONTROL GROUP14.673.22 %L-1d13.831.67 %−5.73 %L-2d13.832.21 %−5.73 %L-3d140.71 %−4.57 %L-5d13.70.73 %−6.61 %L-7d12.90.78 %−12.07 %M-CONTROL GROUP117.071.34 %M-1d117.730.64 %0.56 %M-2d109.330.21 %−6.61 %M-3d109.331.05 %−6.61 %M-5d107.471.12 %−8.20 %M-7d102.30.85 %−12.62 %H-CONTROL GROUP387.470.95 %H-1d381.92.03 %−1.44 %H-2d371.830.51 %−4.04 %H-3d370.070.87 %−4.49 %H-5d371.571.59 %−4.10 %H-7d344.50.95 %−11.09 %SulpirideMean value of detection(ng/mL)CVL-CONTROL GROUP36.030.80 %L-1d35.431.27 %−1.67 %L-2d35.930.85 %−0.28 %L-3d36.930.68 %2.50 %L-5d37.20.47 %3.25 %L-7d37.171.02 %3.16 %M-CONTROL GROUP3040.32 %M-1d307.430.05 %1.13 %M-2d296.70.48 %−2.40 %M-3d297.40.47 %−2.17 %M-5d303.570.54 %−0.14 %M-7d304.10.38 %0.03 %H-CONTROL GROUP970.270.25 %H-1d970.870.26 %0.06 %H-2d958.470.65 %−1.22 %H-3d962.50.28 %−0.80 %H-5d1005.130.08 %3.59 %H-7d987.030.49 %1.73 %TrazodoneMean value of detection(ng/mL)CVL-CONTROL GROUP42.430.76 %L-1d41.70.72 %−1.72 %L-2d42.170.60 %−0.61 %L-3d42.571.79 %0.33 %L-5d42.170.49 %−0.61 %L-7d41.670.37 %−1.79 %M-CONTROL GROUP376.50.56 %M-1d380.830.17 %1.15 %M-2d365.40.68 %−2.95 %M-3d364.370.32 %−3.22 %M-5d366.90.71 %−2.55 %M-7d363.770.48 %−3.38 %H-CONTROL GROUP1165.030.92 %H-1d1164.51.03 %−0.05 %H-2d1139.070.87 %−2.23 %H-3d1134.130.54 %−2.65 %H-5d1173.90.67 %0.76 %H-7d1132.870.59 %−2.76 %N-desmetyclomipramineMean value of detection(ng/mL)CVL-CONTROL GROUP15.931.31 %L-1d15.671.33 %−1.63 %L-2d15.331.00 %−3.77 %L-3d16.032.00 %0.63 %L-5d15.90.63 %−0.19 %L-7d15.930.96 %0.00 %M-CONTROL GROUP135.430.41 %M-1d135.730.38 %0.22 %M-2d131.530.53 %−2.88 %M-3d130.031.28 %−3.99 %M-5d132.231.87 %−2.36 %M-7d132.60.93 %−2.09 %H-CONTROL GROUP439.630.29 %H-1d437.731.15 %−0.43 %H-2d433.31.72 %−1.44 %H-3d426.40.87 %−3.01 %H-5d449.271.09 %2.19 %H-7d435.730.58 %−0.89 %ClomipramineMean value of detection(ng/mL)CVL-CONTROL GROUP16.32.67 %L-1d16.231.88 %−0.43 %L-2d16.41.22 %0.61 %L-3d17.41.00 %6.75 %L-5d16.972.45 %4.11 %L-7d17.031.22 %4.48 %M-CONTROL GROUP143.41.65 %M-1d142.371.86 %−0.72 %M-2d140.671.33 %−1.90 %M-3d140.270.64 %−2.18 %M-5d145.20.18 %1.26 %M-7d147.41.16 %2.79 %H-CONTROL GROUP449.871.88 %H-1d452.91.15 %0.67 %H-2d4411.50 %−1.97 %H-3d443.930.34 %−1.32 %H-5d463.50.80 %3.03 %H-7d454.030.57 %0.92 %N-desmethylmianserinMean value of detection(ng/mL)CVL-CONTROL GROUP4.92.04 %L-1d4.82.08 %−2.04 %L-2d4.874.28 %−0.61 %L-3d4.971.16 %1.43 %L-5d4.831.19 %−1.43 %L-7d4.831.19 %−1.43 %M-CONTROL GROUP41.90.72 %M-1d42.771.20 %2.08 %M-2d40.631.02 %−3.03 %M-3d40.51.31 %−3.34 %M-5d41.231.46 %−1.60 %M-7d41.070.51 %−1.98 %H-CONTROL GROUP134.871.22 %H-1d133.670.87 %−0.89 %H-2d130.91.07 %−2.94 %H-3d1311.60 %−2.87 %H-5d133.32.27 %−1.16 %H-7d129.31.56 %−4.13 %MianserinMean value of detection(ng/mL)CVL-CONTROL GROUP4.973.08 %L-1d4.772.42 %−4.02 %L-2d5.074.56 %2.01 %L-3d4.973.08 %0.00 %L-5d52.00 %0.60 %L-7d5.076.03 %2.01 %M-CONTROL GROUP41.231.88 %M-1d41.774.05 %1.31 %M-2d40.51.31 %−1.77 %M-3d39.671.24 %−3.78 %M-5d40.432.30 %−1.94 %M-7d42.131.19 %2.18 %H-CONTROL GROUP135.71.45 %H-1d130.331.31 %−3.96 %H-2d130.431.87 %−3.88 %H-3d130.573.37 %−3.78 %H-5d135.130.66 %−0.42 %H-7d131.631.67 %−3.00 %N-desmethylmirtazapineMean value of detection(ng/mL)CVL-CONTROL GROUP5.70.00 %L-1d5.51.82 %−3.51 %L-2d5.51.82 %−3.51 %L-3d5.731.01 %0.53 %L-5d5.471.06 %−4.04 %L-7d5.573.74 %−2.28 %M-CONTROL GROUP47.270.74 %M-1d47.71.17 %0.91 %M-2d45.80.66 %−3.11 %M-3d45.530.83 %−3.68 %M-5d45.972.50 %−2.75 %M-7d45.730.91 %−3.26 %H-CONTROL GROUP154.20.51 %H-1d152.11.26 %−1.36 %H-2d150.371.32 %−2.48 %H-3d147.330.33 %−4.46 %H-5d152.031.26 %−1.41 %H-7d148.730.85 %−3.55 %MirtazapineMean value of detection(ng/mL)CVL-CONTROL GROUP5.771.00 %L-1d5.71.75 %−1.21 %L-2d5.731.01 %−0.69 %L-3d5.870.98 %1.73 %L-5d5.830.99 %1.04 %L-7d5.771.00 %0.00 %M-CONTROL GROUP48.270.32 %M-1d49.10.54 %1.72 %M-2d47.30.56 %−2.01 %M-3d470.93 %−2.63 %M-5d48.131.14 %−0.29 %M-7d47.530.74 %−1.53 %H-CONTROL GROUP157.330.60 %H-1d157.131.53 %−0.13 %H-2d1540.06 %−2.12 %H-3d154.230.29 %−1.97 %H-5d160.271.53 %1.87 %H-7d155.770.37 %−0.99 %N-DesmethylvenlafaxineMean value of detection(ng/mL)CVL-CONTROL GROUP27.770.91 %L-1d27.60.96 %−0.61 %L-2d27.571.05 %−0.72 %L-3d28.330.73 %2.02 %L-5d28.131.25 %1.30 %L-7d28.171.02 %1.44 %M-CONTROL GROUP239.230.55 %M-1d242.870.64 %1.52 %M-2d235.870.29 %−1.40 %M-3d233.071.31 %−2.57 %M-5d238.10.72 %−0.47 %M-7d237.571.28 %−0.69 %H-CONTROL GROUP771.530.64 %H-1d769.40.54 %−0.28 %H-2d7630.34 %−1.11 %H-3d755.670.67 %−2.06 %H-5d787.430.54 %2.06 %H-7d768.80.82 %−0.35 %O-DesmethylvenlafaxineMean value of detection(ng/mL)CVL-CONTROL GROUP27.41.93 %L-1d28.231.95 %3.03 %L-2d27.82.52 %1.46 %L-3d28.62.18 %4.38 %L-5d28.530.88 %4.12 %L-7d28.71.52 %4.74 %M-CONTROL GROUP245.11.80 %M-1d250.40.35 %2.16 %M-2d240.970.36 %−1.69 %M-3d240.071.72 %−2.05 %M-5d244.031.72 %−0.44 %M-7d242.271.12 %−1.15 %H-CONTROL GROUP787.270.96 %H-1d788.81.48 %0.19 %H-2d774.81.53 %−1.58 %H-3d783.930.22 %−0.42 %H-5d812.231.30 %3.17 %H-7d789.671.45 %0.30 %VenlafaxineMean value of detection(ng/mL)CVL-CONTROL GROUP28.371.59 %L-1d27.872.04 %−1.76 %L-2d28.170.20 %−0.70 %L-3d29.10.69 %2.57 %L-5d28.631.41 %0.92 %L-7d29.071.89 %2.47 %M-CONTROL GROUP252.570.84 %M-1d252.770.70 %0.08 %M-2d2460.65 %−2.60 %M-3d243.630.68 %−3.54 %M-5d247.531.82 %−2.00 %M-7d251.530.30 %−0.41 %H-CONTROL GROUP7690.59 %H-1d762.570.36 %−0.84 %H-2d756.10.26 %−1.68 %H-3d755.470.27 %−1.76 %H-5d778.870.23 %1.28 %H-7d764.171.23 %−0.63 %VenlafaxineMean value of detection(ng/mL)CVL-CG28.371.59 %L-1d27.872.04 %−1.76 %L-2d28.170.20 %−0.70 %L-3d29.10.69 %2.57 %L-5d28.631.41 %0.92 %L-7d29.071.89 %2.47 %M-CG252.570.84 %M-1d252.770.70 %0.08 %M-2d2460.65 %−2.60 %M-3d243.630.68 %−3.54 %M-5d247.531.82 %−2.00 %M-7d251.530.30 %−0.41 %H-CG7690.59 %H-1d762.570.36 %−0.84 %H-2d756.10.26 %−1.68 %H-3d755.470.27 %−1.76 %H-5d778.870.23 %1.28 %H-7d764.171.23 %−0.63 %O-DeethylreboxetineMean value of detection(ng/mL)CVL-CONTROL GROUP26.82.08 %L-1d25.132.33 %−6.23 %L-2d26.32.49 %−1.87 %L-3d26.20.76 %−2.24 %L-5d26.60.75 %−0.75 %L-7d25.633.15 %−4.37 %M-CONTROL GROUP238.732.68 %M-1d2362.44 %−1.14 %M-2d229.932.03 %−3.69 %M-3d226.72.85 %−5.04 %M-5d232.31.09 %−2.69 %M-7d227.94.25 %−4.54 %H-CONTROL GROUP685.51.94 %H-1d641.731.18 %−6.39 %H-2d681.530.88 %−0.62 %H-3d660.534.06 %−3.66 %H-5d693.40.29 %1.20 %H-7d693.631.26 %1.17 %ReboxetineMean value of detection(ng/mL)CVL-CONTROL GROUP25.674.76 %L-1d26.24.40 %2.06 %L-2d27.031.49 %5.30 %L-3d27.334.11 %6.47 %L-5d27.472.07 %7.01 %L-7d27.91.86 %8.69 %M-CONTROL GROUP232.571.27 %M-1d241.533.12 %3.85 %M-2d239.12.98 %2.81 %M-3d237.176.80 %1.98 %M-5d238.473.52 %2.54 %M-7d235.976.31 %1.46 %H-CONTROL GROUP770.574.12 %H-1d7422.94 %−3.71 %H-2d788.570.40 %2.34 %H-3d771.335.66 %0.10 %H-5d8328.80 %7.97 %H-7d789.232.55 %2.42 %AgomelatineMean value of detection(ng/mL)CVL-CONTROL GROUP20.071.04 %L-1d19.830.77 %−1.20 %L-2d19.671.79 %−1.99 %L-3d20.371.86 %1.49 %L-5d20.32.15 %1.15 %L-7d20.531.01 %2.29 %M-CONTROL GROUP173.570.37 %M-1d176.331.13 %1.59 %M-2d169.470.65 %−2.36 %M-3d170.231.15 %−1.92 %M-5d172.930.95 %−0.37 %M-7d175.630.66 %1.19 %H-CONTROL GROUP566.170.81 %H-1d564.230.83 %−0.34 %H-2d555.130.58 %−1.95 %H-3d562.571.53 %−0.64 %H-5d585.671.00 %3.44 %H-7d573.330.56 %1.26 %Compound 33: AmitriptylineMean value of detection(ng/mL)CVL-CONTROL GROUP10.930.53 %L-1d10.531.10 %−3.66 %L-2d10.771.93 %−1.46 %L-3d11.12.38 %1.56 %L-5d10.931.90 %0.00 %L-7d110.91 %0.64 %M-CONTROL GROUP90.530.89 %M-1d90.81.21 %0.30 %M-2d88.930.55 %−1.77 %M-3d88.371.64 %−2.39 %M-5d89.971.70 %−0.62 %M-7d92.231.80 %1.88 %H-CONTROL GROUP289.471.55 %H-1d288.371.11 %−0.38 %H-2d287.230.32 %−0.77 %H-3d285.130.17 %−1.50 %H-5d298.81.22 %3.22 %H-7d291.30.84 %0.63 %N-DesmethylamitriptylineMean value of detection(ng/mL)CVL-CONTROL GROUP10.771.42 %L-1d10.332.23 %−4.09 %L-2d10.631.44 %−1.30 %L-3d10.74.67 %−0.65 %L-5d10.731.42 %−0.37 %L-7d10.631.96 %−1.30 %M-CONTROL GROUP90.971.12 %M-1d91.61.44 %0.69 %M-2d891.07 %−2.17 %M-3d88.032.61 %−3.23 %M-5d89.531.59 %−1.58 %M-7d90.730.54 %−0.26 %H-CONTROL GROUP294.831.43 %H-1d292.970.38 %−0.63 %H-2d292.130.62 %−0.92 %H-3d290.670.87 %−1.41 %H-5d300.630.66 %1.97 %H-7d297.70.52 %0.97 %BupropionMean value of detection(ng/mL)CVL-CONTROL GROUP71.83.29 %L-1d70.672.76 %−1.57 %L-2d71.931.85 %0.18 %L-3d73.31.55 %2.09 %L-5d742.71 %3.06 %L-7d74.20.88 %3.34 %M-CONTROL GROUP615.471.76 %M-1d619.170.58 %0.60 %M-2d598.970.10 %−2.68 %M-3d605.071.62 %−1.69 %M-5d612.270.78 %−0.52 %M-7d614.40.77 %−0.17 %H-CONTROL GROUP1961.10.31 %H-1d1954.070.76 %−0.36 %H-2d1940.671.09 %−1.04 %H-3d1924.730.48 %−1.85 %H-5d2023.231.50 %3.17 %H-7d1984.80.82 %1.21 %HydroxybupropionMean value of detection(ng/mL)CVL-CONTROL GROUP66.22.00 %L-1d63.731.60 %−3.73 %L-2d63.671.68 %−3.82 %L-3d66.70.91 %0.76 %L-5d65.931.03 %−0.41 %L-7d68.31.25 %3.17 %M-CONTROL GROUP561.871.27 %M-1d551.61.67 %−1.83 %M-2d535.530.31 %−4.69 %M-3d542.32.09 %−3.48 %M-5d549.032.55 %−2.29 %M-7d556.90.68 %−0.88 %H-CONTROL GROUP1917.171.28 %H-1d1879.132.03 %−1.98 %H-2d1874.932.44 %−2.20 %H-3d1844.70.93 %−3.78 %H-5d1939.371.83 %1.16 %H-7d1914.20.95 %−0.15 %DuloxetineMean value of detection(ng/mL)CVL-CONTROL GROUP8.83.01 %L-1d8.738.59 %−0.80 %L-2d8.96.83 %1.14 %L-3d8.631.34 %−1.93 %L-5d8.734.02 %−0.80 %L-7d8.3711.11 %−4.89 %M-CONTROL GROUP68.974.49 %M-1d72.51.26 %5.12 %M-2d675.60 %−2.86 %M-3d68.41.05 %−0.83 %M-5d68.131.86 %−1.22 %M-7d69.131.84 %0.23 %H-CONTROL GROUP233.833.25 %H-1d229.732.80 %−1.75 %H-2d232.031.81 %−0.77 %H-3d226.42.83 %−3.18 %H-5d238.030.59 %1.80 %H-7d233.072.22 %−0.33 %DoxepinMean value of detection(ng/mL)CVL-CONTROL GROUP10.373.39 %L-1d10.10.99 %−2.60 %L-2d10.372.01 %0.00 %L-3d10.40.96 %0.29 %L-5d10.470.55 %0.96 %L-7d10.571.09 %1.93 %M-CONTROL GROUP86.730.47 %M-1d88.530.57 %2.08 %M-2d84.40.43 %−2.69 %M-3d83.51.30 %−3.72 %M-5d85.570.44 %−1.34 %M-7d860.62 %−0.84 %H-CONTROL GROUP287.670.56 %H-1d285.470.21 %−0.76 %H-2d283.731.05 %−1.37 %H-3d281.80.44 %−2.04 %H-5d292.772.54 %1.77 %H-7d284.870.73 %−0.97 %N-DesmethyldoxepinMean value of detection(ng/mL)CVL-CONTROL GROUP10.532.19 %L-1d10.32.91 %−2.18 %L-2d10.332.01 %−1.90 %L-3d10.431.46 %−0.95 %L-5d10.332.01 %−1.90 %L-7d10.431.46 %−0.95 %M-CONTROL GROUP90.471.57 %M-1d90.90.57 %0.48 %M-2d87.730.46 %−3.03 %M-3d88.371.11 %−2.32 %M-5d89.331.39 %−1.26 %M-7d87.50.64 %−3.28 %H-CONTROL GROUP289.970.33 %H-1d290.530.52 %0.19 %H-2d287.30.72 %−0.92 %H-3d285.770.86 %−1.45 %H-5d296.61.03 %2.29 %H-7d288.61.03 %−0.47 %VortioxetineMean value of detection(ng/mL)CVL-CONTROL GROUP2.80.00 %L-1d2.80.00 %0.00 %L-2d2.832.04 %1.07 %L-3d2.90.00 %3.57 %L-5d2.872.01 %2.50 %L-7d2.832.04 %1.07 %M-CONTROL GROUP24.030.64 %M-1d24.170.86 %0.58 %M-2d23.20.43 %−3.45 %M-3d23.070.25 %−4.00 %M-5d23.530.25 %−2.08 %M-7d23.630.65 %−1.66 %H-CONTROL GROUP78.030.96 %H-1d77.330.37 %−0.90 %H-2d75.830.66 %−2.82 %H-3d760.26 %−2.60 %H-5d79.20.77 %1.50 %H-7d77.80.13 %−0.29 %FluvoxamineMean value of detection(ng/mL)CVL-CONTROL GROUP17.632.29 %L-1d17.031.36 %−3.40 %L-2d17.432.17 %−1.13 %L-3d17.470.87 %−0.91 %L-5d16.871.49 %−4.31 %L-7d16.730.35 %−5.10 %M-CONTROL GROUP150.871.28 %M-1d151.50.52 %0.42 %M-2d145.271.14 %−3.71 %M-3d143.971.26 %−4.57 %M-5d145.230.62 %−3.74 %M-7d143.31.47 %−5.02 %H-CONTROL GROUP475.430.71 %H-1d469.20.91 %−1.31 %H-2d460.430.70 %−3.16 %H-3d462.90.32 %−2.64 %H-5d472.70.89 %−0.57 %H-7d456.131.06 %−4.06 %FluoxetineMean value of detection(ng/mL)CVL-CONTROL GROUP35.275.20 %L-1d33.673.12 %−4.54 %L-2d34.737.23 %−1.53 %L-3d35.63.17 %0.94 %L-5d34.873.82 %−1.13 %L-7d35.774.07 %1.42 %M-CONTROL GROUP302.835.65 %M-1d314.473.00 %3.84 %M-2d299.431.98 %−1.12 %M-3d295.675.04 %−2.36 %M-5d298.531.41 %−1.42 %M-7d299.571.70 %−1.08 %H-CONTROL GROUP968.373.60 %H-1d989.372.67 %2.17 %H-2d979.54.04 %1.15 %H-3d974.472.72 %0.63 %H-5d1016.031.95 %4.92 %H-7d983.94.13 %1.60 %N-DesmethylfluoxetineMean value of detection(ng/mL)CVL-CONTROL GROUP33.573.45 %L-1d331.99 %−1.70 %L-2d31.538.17 %−6.08 %L-3d33.936.02 %1.07 %L-5d31.170.74 %−7.15 %L-7d33.99.43 %0.98 %M-CONTROL GROUP289.272.17 %M-1d300.331.30 %3.82 %M-2d284.271.30 %−1.73 %M-3d281.970.32 %−2.52 %M-5d284.772.15 %−1.56 %M-7d278.972.57 %−3.56 %H-CONTROL GROUP972.332.44 %H-1d986.472.64 %1.45 %H-2d959.672.80 %−1.30 %H-3d930.21.23 %−4.33 %H-5d980.530.99 %0.84 %H-7d953.171.32 %−1.97 %MaprotilineMean value of detection(ng/mL)CVL-CONTROL GROUP7.73.44 %L-1d7.570.76 %−1.69 %L-2d7.730.75 %0.39 %L-3d81.25 %3.90 %L-5d7.771.97 %0.91 %L-7d7.871.47 %2.21 %M-CONTROL GROUP65.771.67 %M-1d66.531.52 %1.16 %M-2d64.430.90 %−2.04 %M-3d64.91.67 %−1.32 %M-5d650.81 %−1.17 %M-7d67.11.95 %2.02 %H-CONTROL GROUP217.931.72 %H-1d215.20.46 %−1.25 %H-2d211.770.99 %−2.83 %H-3d2131.37 %−2.26 %H-5d222.972.18 %2.31 %H-7d217.271.31 %−0.30 %N-DesmethylmaprotilineMean value of detection(ng/mL)CVL-CONTROL GROUP7.93.35 %L-1d8.033.80 %1.65 %L-2d8.25.32 %3.80 %L-3d8.131.88 %2.91 %L-5d8.073.98 %2.15 %L-7d8.32.41 %5.06 %M-CONTROL GROUP67.872.15 %M-1d69.571.96 %2.50 %M-2d661.49 %−2.76 %M-3d65.532.34 %−3.45 %M-5d65.971.50 %−2.80 %M-7d67.70.39 %−0.25 %H-CONTROL GROUP2200.55 %H-1d220.91.85 %0.41 %H-2d214.531.22 %−2.49 %H-3d215.870.82 %−1.88 %H-5d228.131.78 %3.70 %H-7d220.071.33 %0.03 %MoclobemideMean value of detection(ng/mL)CVL-CONTROL GROUP710.51 %L-1d71.670.29 %0.94 %L-2d73.671.29 %3.76 %L-3d77.130.49 %8.63 %L-5d74.320.97 %4.68 %L-7d77.021.08 %8.48 %M-CONTROL GROUP637.370.75 %M-1d655.170.50 %2.79 %M-2d647.130.67 %1.53 %M-3d656.170.89 %2.95 %M-5d683.870.60 %7.30 %M-7d705.20.58 %10.64 %H-CONTROL GROUP1949.10.22 %H-1d1983.670.40 %1.77 %H-2d1977.270.41 %1.45 %H-3d2005.470.24 %2.89 %H-5d2140.370.46 %9.81 %H-7d2143.530.22 %9.98 %Moclobemide N-oxindoleMean value of detection(ng/mL)CVL-CONTROL GROUP69.630.65 %L-1d66.20.40 %−4.93 %L-2d65.172.23 %−6.41 %L-3d65.131.11 %−6.46 %L-5d60.270.25 %−13.44 %L-7d57.971.10 %−16.75 %M-CONTROL GROUP619.930.02 %M-1d607.830.62 %−1.95 %M-2d576.031.43 %−7.08 %M-3d555.60.80 %−10.38 %M-5d537.771.23 %−13.25 %M-7d517.731.48 %−16.49 %H-CONTROL GROUP1905.771.03 %H-1d1847.20.27 %−3.07 %H-2d1802.670.82 %−5.41 %H-3d1724.671.19 %−9.50 %H-5d1718.570.25 %−9.82 %H-7d1592.30.58 %−16.45 %milnacipranMean value of detection(ng/mL)CVL-CONTROL GROUP10.532.19 %L-1d10.52.86 %−0.28 %L-2d10.673.29 %1.33 %L-3d11.031.05 %4.75 %L-5d10.671.95 %1.33 %L-7d10.91.83 %3.51 %M-CONTROL GROUP91.971.31 %M-1d91.571.30 %−0.43 %M-2d88.931.67 %−3.31 %M-3d90.431.99 %−1.67 %M-5d90.42.84 %−1.71 %M-7d92.370.70 %0.43 %H-CONTROL GROUP292.81.03 %H-1d288.371.16 %−1.51 %H-2d286.931.33 %−2.00 %H-3d286.030.33 %−2.31 %H-5d295.41.47 %0.89 %H-7d290.40.87 %−0.82 %TianeptineMean value of detection(ng/mL)CVL-CONTROL GROUP5.71.75 %L-1d5.531.04 %−2.98 %L-2d5.531.04 %−2.98 %L-3d5.671.02 %−0.53 %L-5d5.64.72 %−1.75 %L-7d5.672.04 %−0.53 %M-CONTROL GROUP49.730.81 %M-1d50.330.83 %1.21 %M-2d48.131.02 %−3.22 %M-3d48.772.02 %−1.93 %M-5d48.832.26 %−1.81 %M-7d48.41.24 %−2.67 %H-CONTROL GROUP154.772.51 %H-1d152.43.62 %−1.53 %H-2d155.61.22 %0.54 %H-3d151.871.75 %−1.87 %H-5d156.333.30 %1.01 %H-7d153.672.60 %−0.71 %ParoxetineMean value of detection(ng/mL)CVL-CONTROL GROUP4.131.40 %L-1d4.10.00 %−0.73 %L-2d4.12.44 %−0.73 %L-3d4.271.35 %3.39 %L-5d4.171.39 %0.97 %L-7d4.171.39 %0.97 %M-CONTROL GROUP35.71.22 %M-1d36.130.16 %1.20 %M-2d34.470.93 %−3.45 %M-3d34.171.03 %−4.29 %M-5d34.70.86 %−2.80 %M-7d35.10.99 %−1.68 %H-CONTROL GROUP116.670.60 %H-1d114.532.49 %−1.83 %H-2d112.41.18 %−3.66 %H-3d111.370.76 %−4.54 %H-5d116.731.12 %0.05 %H-7d114.231.28 %−2.09 %NorsertralineMean value of detection(ng/mL)CVL-CONTROL GROUP11.030.52 %L-1d10.22.59 %−7.52 %L-2d10.773.75 %−2.36 %L-3d10.88.83 %−2.09 %L-5d10.673.01 %−3.26 %L-7d10.93.18 %−1.18 %M-CONTROL GROUP94.470.82 %M-1d96.12.09 %1.73 %M-2d93.10.67 %−1.45 %M-3d93.470.86 %−1.06 %M-5d94.670.78 %0.21 %M-7d96.270.33 %1.91 %H-CONTROL GROUP303.131.85 %H-1d298.370.40 %−1.57 %H-2d293.970.84 %−3.02 %H-3d296.631.89 %−2.14 %H-5d308.831.01 %1.88 %H-7d310.270.39 %2.36 %Compound 54: SertralineMean value of detection(ng/mL)CVL-CONTROL GROUP10.70.93 %L-1d10.332.44 %−3.46 %L-2d10.432.00 %−2.52 %L-3d10.92.43 %1.87 %L-5d10.90.92 %1.87 %L-7d10.972.63 %2.52 %M-CONTROL GROUP89.72.06 %M-1d90.531.64 %0.93 %M-2d88.20.41 %−1.67 %M-3d88.230.29 %−1.64 %M-5d89.60.67 %−0.11 %M-7d90.80.48 %1.23 %H-CONTROL GROUP288.630.43 %H-1d288.631.31 %0.00 %H-2d284.931.64 %−1.28 %H-3d285.60.46 %−1.05 %H-5d301.371.39 %4.41 %H-7d295.930.34 %2.53 %CitalopramMean value of detection(ng/mL)CVL-CONTROL GROUP7.62.28 %L-1d7.61.32 %0.00 %L-2d7.62.28 %0.00 %L-3d7.81.28 %2.63 %L-5d7.930.73 %4.34 %L-7d7.830.74 %3.03 %M-CONTROL GROUP66.530.71 %M-1d66.571.62 %0.06 %M-2d64.470.50 %−3.10 %M-3d64.90.56 %−2.45 %M-5d65.870.61 %−0.99 %M-7d66.931.83 %0.60 %H-CONTROL GROUP211.80.90 %H-1d208.871.15 %−1.38 %H-2d206.331.21 %−2.58 %H-3d206.370.83 %−2.56 %H-5d214.130.26 %1.10 %H-7d211.61.23 %−0.09 %N-DesmethylcitalopramMean value of detection(ng/mL)CVL-CONTROL GROUP5.331.08 %L-1d5.132.98 %−3.75 %L-2d5.10.00 %−4.32 %L-3d5.333.90 %0.00 %L-5d5.332.86 %0.00 %L-7d5.31.89 %−0.56 %M-CONTROL GROUP43.41.15 %M-1d42.332.74 %−2.47 %M-2d41.871.20 %−3.53 %M-3d41.72.92 %−3.92 %M-5d42.873.08 %−1.22 %M-7d43.071.36 %−0.76 %H-CONTROL GROUP150.40.81 %H-1d149.072.06 %−0.88 %H-2d145.872.46 %−3.01 %H-3d144.271.79 %−4.08 %H-5d151.132.39 %0.49 %H-7d149.232.26 %−0.78 %
Carryover effect
3.6
The residues in the blank samples after the high concentration samples of each compound were analyzed. The residues of the LLOQ were 0.00 %–18.73 % and the residues of the internal standard were 0.00 %–0.77 %, meeting the requirements(Table 7).Table 7. Carryover evaluations of 71 neuropsychotropic drugs.Table 7. Compoundsignal responseresidualsOxcarbazepineSTD167008.008BLANK147.3460.22 %internal standard178438.984BLANK28.3320.02 %10-hydroxycarbazepinesignal responseresidualsSTD131815.13BLANK1359.3544.27 %internal standard574373.4377BLANK254.8230.04 %Carbamazepine epoxidesignal responseresidualsSTD15053.924BLANK5.5740.11 %internal standard19524.076BLANK23.3210.12 %Carbamazepinesignal responseresidualsSTD132546.385BLANK44.8810.14 %internal standard171859.672BLANK7.560.00 %Phenobarbitalsignal responseresidualsSTD1350.979BLANK1.5090.43 %internal standard2556.573BLANK0.4160.02 %Primidonesignal responseresidualsSTD11698.904BLANK5.2970.31 %internal standard6158.382BLANK3.0030.05 %Phenytoinsignal responseresidualsSTD149084.25BLANK809.8631.65 %internal standard678922.6253BLANK638.1290.09 %Valproic acidsignal responseresidualsSTD128940.939BLANK682.3182.36 %internal standard375832.5BLANK2903.1590.77 %Lamotriginesignal responseresidualsSTD13462.948BLANK5.9990.17 %internal standard185723.594BLANK59.9370.03 %Topiramatesignal responseresidualsSTD14336.462BLANK0.0720.00 %internal standard51674.66BLANK2.7230.01 %Levetiracetamsignal responseresidualsSTD1887.625BLANK4.9560.56 %internal standard12817.592BLANK6.5410.05 %Perampanelsignal responseresidualsSTD112045.884BLANK125.831.04 %internal standard46777.227BLANK4.3430.01 %Zonisamidesignal responseresidualsSTD153068.25BLANK41.5560.08 %internal standard460376.906BLANK18.0810.00 %Clonazepamsignal responseresidualsSTD1967.745BLANK2.3840.25 %internal standard4943.215BLANK0.460.01 %9-Hydroxyrisperidonesignal responseresidualsSTD17519.58BLANK402.2925.35 %internal standard240959.1097BLANK69.8280.03 %Risperidonsignal responseresidualsSTD113621.26BLANK1142.988.39 %internal standard342820.4583BLANK254.3980.07 %N-demethylolanzapinesignal responseresidualsSTD15204.69BLANK68.5571.32 %internal standard70367.961BLANK68.1740.10 %Olanzapinesignal responseresidualsSTD118941.85BLANK557.72.94 %internal standard300507.875BLANK122.5920.04 %N-demethylclozapinesignal responseresidualsSTD129973.94BLANK1649.8675.50 %internal standard484209.7813BLANK205.9710.04 %Clozapinesignal responseresidualsSTD115981.72BLANK550.6173.45 %internal standard641428.8753BLANK206.6010.03 %Aripiprazolesignal responseresidualsSTD117723.21BLANK3319.53118.73 %internal standard252106BLANK789.3110.31 %Dehydro aripiprazolesignal responseresidualsSTD114185.08BLANK2511.89217.71 %internal standard358991.2293BLANK1660.1190.46 %Amisulpridesignal responseresidualsSTD18143.83BLANK2.8350.03 %internal standard141477.8333BLANK18.7150.01 %Perphenazinesignal responseresidualsSTD1623.18BLANK70.73411.35 %internal standard4765.851BLANK11.0380.23 %Fluphenazinesignal responseresidualsSTD11513.65BLANK192.34612.71 %internal standard38917.28533BLANK31.0150.08 %Haloperidolsignal responseresidualsSTD12599.44BLANK258.4489.94 %internal standard43956.67833BLANK5.0840.01 %Reduced haloperidolsignal responseresidualsSTD11300.27BLANK72.7715.60 %internal standard25923.78933BLANK39.7710.15 %Flupentixolsignal responseresidualsSTD1452.94BLANK39.3998.70 %internal standard5335.198BLANK24.8330.47 %Quetiapinesignal responseresidualsSTD120758.24BLANK39.1510.19 %internal standard409608.2707BLANK67.4070.02 %Thioridazinesignal responseresidualsSTD130436.60BLANK3266.49610.73 %internal standard527893.792BLANK783.9460.15 %Lurasidonesignal responseresidualsSTD115117.99BLANK1948.51812.89 %internal standard208296.3337BLANK377.1590.18 %Loxapinesignal responseresidualsSTD1857.53BLANK24.8462.90 %internal standard17347.11133BLANK00.00 %Chlorpromazinesignal responseresidualsSTD117006.77BLANK1615.1349.50 %internal standard381348.5BLANK376.1670.10 %Chlorprothixenesignal responseresidualsSTD111729.59BLANK1219.89710.40 %internal standard319217.3543BLANK254.5890.08 %Ziprasidonesignal responseresidualsSTD114042.39BLANK1836.15513.08 %internal standard1282090.875BLANK2986.7910.23 %Sulpiridesignal responseresidualsSTD115213.23BLANK63.1040.41 %internal standard440069.417BLANK46.860.01 %Trazodonesignal responseresidualsSTD132756.95BLANK1255.6443.83 %internal standard567631.3753BLANK219.6960.04 %N-desmetyclomipraminesignal responseresidualsSTD14085.09BLANK204.1825.00 %internal standard91246.11967BLANK379.1060.42 %Clomipraminesignal responseresidualsSTD149615.51BLANK1595.5383.22 %internal standard827137.2713BLANK573.1540.07 %N-desmethylmianserinsignal responseresidualsSTD19229.72BLANK277.4533.01 %internal standard100681.065BLANK198.7830.20 %Mianserinsignal responseresidualsSTD15627.82BLANK49.2480.88 %internal standard100681.065BLANK198.7830.20 %N-desmethylmirtazapinesignal responseresidualsSTD124472.11BLANK798.5583.26 %internal standard561924.542BLANK267.1820.05 %Mirtazapinesignal responseresidualsSTD110704.44BLANK268.8272.51 %internal standard226143.1873BLANK66.1710.03 %N-desmethylvenlafaxinesignal responseresidualsSTD131454.40BLANK1021.8963.25 %internal standard516892.9897BLANK00.00 %O-desmethylvenlafaxinesignal responseresidualsSTD131592.59BLANK58.5240.19 %internal standard593638.3543BLANK7.1190.00 %Venlafaxinesignal responseresidualsSTD110751.96BLANK380.8813.54 %internal standard414906.1563BLANK62.6690.02 %O-Deethylreboxetinesignal responseresidualsSTD156809.70BLANK1305.8882.30 %internal standard1271758.25BLANK186.830.01 %Reboxetinesignal responseresidualsSTD145725.84BLANK1135.4422.48 %internal standard1271758.25BLANK186.830.01 %Agomelatinesignal responseresidualsSTD143436.97BLANK1163.8092.68 %internal standard703808.5003BLANK188.1050.03 %Amitriptylinesignal responseresidualsSTD117836.85BLANK882.4734.95 %internal standard310194.0003BLANK389.8020.13 %N-Desmethylamitriptylinesignal responseresidualsSTD112824.42BLANK346.1212.70 %internal standard213636.229BLANK292.9750.14 %Bupropionsignal responseresidualsSTD13474.19BLANK222.8796.42 %internal standard314383.042BLANK185.3520.06 %Hydroxybupropionsignal responseresidualsSTD157362.51BLANK1056.0731.84 %internal standard678922.6253BLANK638.1290.09 %Duloxetinesignal responseresidualsSTD1193.75BLANK9.0364.66 %internal standard8807.121BLANK00.00 %Doxepinsignal responseresidualsSTD125206.07BLANK775.2633.08 %internal standard356734BLANK211.7550.06 %N-Desmethyldoxepinsignal responseresidualsSTD122331.01BLANK714.6963.20 %internal standard554384.792BLANK368.9270.07 %Vortioxetinesignal responseresidualsSTD111607.49BLANK564.5944.86 %internal standard579110.438BLANK519.7090.09 %Fluvoxaminesignal responseresidualsSTD124072.38BLANK954.1023.96 %internal standard1441909.125BLANK446.770.03 %Fluoxetinesignal responseresidualsSTD110313.14BLANK109.2611.06 %internal standard206301.0937BLANK24.350.01 %N-Desmethylfluoxetinesignal responseresidualsSTD12198.76BLANK78.013.55 %internal standard78848.44267BLANK14.9730.02 %Maprotilinesignal responseresidualsSTD117853.64BLANK550.7953.09 %internal standard277760.4063BLANK186.8120.07 %N-Desmethylmaprotilinesignal responseresidualsSTD12440.68BLANK39.3971.61 %internal standard277760.4063BLANK186.8120.07 %Moclobemidesignal responseresidualsSTD157547.66BLANK569.4170.99 %internal standard817380.667BLANK64.4620.01 %Moclobemide-N-Oxidesignal responseresidualsSTD118163.92BLANK330.9031.82 %internal standard674666.3127BLANK97.9810.01 %milnacipransignal responseresidualsSTD121987.32BLANK465.4632.12 %internal standard438519.3233BLANK88.9240.02 %Tianeptinesignal responseresidualsSTD117317.57BLANK427.8052.47 %internal standard263915.5107BLANK33.7050.01 %Paroxetinesignal responseresidualsSTD15517.43BLANK271.2864.92 %internal standard106850.8907BLANK119.590.11 %Norsertralinesignal responseresidualsSTD114901.40BLANK486.3133.26 %internal standard298408.6253BLANK156.8830.05 %Sertralinesignal responseresidualsSTD19065.38BLANK424.0184.68 %internal standard138939.6197BLANK62.0850.04 %Citalopramsignal responseresidualsSTD124704.09BLANK1232.0264.99 %internal standard520500.9897BLANK107.6530.02 %N-Desmethylcitalopramsignal responseresidualsSTD110250.44BLANK464.7054.53 %internal standard235076.2607BLANK10.7880.00 %
Discussion
4
Regional surveys in recent years have shown that the monitoring of psychotropic drug concentrations in China is still in its infancy, and the low coverage of inter-room QC and the lack of a unified detection method are unmet needs [24,25]. Kirchherr et al. established a method for the simultaneous detection of 48 psychiatric drugs, but their method employed only 3 isotopic internal standards, which did not correspond to all compounds, and the detection time of this method was relatively long [26]. Two reported methods by Remane et al. and Montenarh et al. were able to detect more than 30 psychiatric drugs simultaneously, but pre-treatment for both methods required complex liquid-liquid extraction [27,28]. We hereby propose a method that is better than the reported ones in terms of number of compounds detected and sample pretreatment.
In this study, a UPLC-MS/MS detection method was established for the simultaneous determination of 71 neuropsychotropic drugs. During optimization of the method, it was found that the negative ion mode detection signals of phenobarbital, phenytoin, and valproic acid were higher and stabler than those obtained in the positive ion mode. Therefore, ammonium acetate was added to the mobile phase to improve the negative ion response, while taking into account that the vast majority of the drugs need to be detected in the positive ion mode. Acetic acid was also added to the mobile phase, and the concentrations of acetic acid and ammonium acetate were optimized for better compatibility of the signals with the two detection modes.
Our proposed method avoided the solvent effect by using methanol-acetonitrile as the protein precipitant, performing centrifugation at low temperature and high speed to separate the drugs to be tested, and adding methanol-water before sampling. The method was found to be simple and easy to perform and could meet the requirements of high-throughput TDM. The linear range of each drug covered the therapeutic concentration range provided by the AGNP guidelines and the laboratory alert concentration. All compounds except moclobemide N-indole were stable for 7 days at room temperature, but degradation of olanzapine, oxcarbazepine, bupropion, and other drugs stored at −80 °C for 30 days was noted. However, the degradation could be avoided by the addition of 5 % 200 mg/mL vitamin C (final concentration of vitamin C was 10 mg/mL) as an antioxidant. In this case, the stability result of bupropion was in accordance with the AGNP guideline, and the stability result of olanzapine was inconsistent with the reported data [[29], [30], [31]]. The stability of 10-hydroxycarbazepine is inconsistent with some studies, possibly because the sample used in our study was spiked serum rather than patient serum. When using UPLC-MS/MS for quantitative analysis, the ideal internal standard is the isotopic marker of the component to be measured. Accordingly, we used the respective isotopic markers of the drugs as the internal standard, so that the internal standard peak coincide with the analyte peak to reduce the matrix effect on quantification [32]. However, there is one shortcoming: the matrix effect, we only evaluated one serum and this method did not fully assess the matrix effect. Another advantage of proposed method is that it requires a small sample volume of only 50 μL, which opens up the possibility of detecting samples from neonatal and pediatric populations and also reduces reagent costs.
Conclusion
5
The UPLC-MS/MS method proposed could successfully allow the simultaneous determination of serum drug concentrations of 71 clinical neuropsychotropic drugs with excellent sensitivity and specificity. These properties are essential for the accurate identification and quantification of a wide range of neuropsychotropic drugs in the serum, ensuring that the method can reliably discriminate between compounds without cross-reactivity. In addition, the precision, accuracy, and stability of the method met the requirements of the relevant guidelines. Methanol-acetonitrile was used to precipitate proteins in this study. This method is very simple and easy to implement in a laboratory setting. In addition, the method requires a low sample volume of only 50 μL of serum. One of the most notable features of the method is the ability to obtain results rapidly. Each sample could be analyzed in less than 6 min, making our method significantly faster than many previously reported methods. A rapid turnaround is critical for timely clinical decision making, especially in cases of drug intoxication or clinical drug adjustments [[33], [34], [35]].
CRediT authorship contribution statement
Weifeng Jin: Writing – review & editing, Writing – original draft, Visualization, Validation. Jianhua Wang: Methodology. Shuzi Chen: Investigation. Qing Chen: Project administration. Dan Li: Investigation. Mengyuan Zhu: Data curation. Xiaomei Fu: Investigation. Yingyu Huang: Methodology. Ping Lin: Investigation, Funding acquisition, Conceptualization.
Declaration of competing interest
We have no known competing financial interests or personal relationships that could have appeared to influence the work reported in this paper.
The reference list from the paper itself. Each links out to its DOI / PubMed record.
- 1Hiemke C.Consensus guideline based therapeutic drug monitoring (TDM) in psychiatry and neurology Curr. Drug Deliv.13201635336110.2174/156720181266615102910090926511090 · doi ↗ · pubmed ↗
- 2Patsalos P.N.Spencer E.P.Berry D.J.Therapeutic drug monitoring of antiepileptic drugs in epilepsy Ther. Drug Monit.40201852654810.1097/ftd.000000000000054629957667 · doi ↗ · pubmed ↗
- 3Wyska E.Pharmacokinetic considerations for current state-of-the-art antidepressants Expet Opin. Drug Metabol. Toxicol.15201983184710.1080/17425255.2019.166956031526279 · doi ↗ · pubmed ↗
- 4Jarvie D.Mahmoud S.H.Therapeutic drug monitoring of levetiracetam in select populations J. Pharm. Pharmaceut. Sci.212018149 s 176s 10.18433/jpps 3008130096051 · doi ↗ · pubmed ↗
- 5Zhang X.Handbook of Clinical Applications of Therapeutic Drug Monitoring 2020 People’s Health Press
- 6Hiemke C.Bergemann N.Clement H.Conca A.Deckert J.Domschke K.Eckermann G.Egberts K.Gerlach M.Greiner C.Gründer G.Haen E.Havemann-Reinecke U.Hefner G.Helmer R.Janssen G.Jaquenoud E.Laux G.Messer T.Mössner R.Consensus guidelines for therapeutic drug monitoring in Neuropsychopharmacology: update 2017 Pharmacopsychiatry 51201796210.1055/s-0043-11649228910830 · doi ↗ · pubmed ↗
- 7Professional Committee on Therapeutic Drug Monitoring and Research, Chinese Society of Pharmacology, Chinese Physicians Association of Psychiatrists Committee on pharmacogenetic diseases, Chinese society of Pharmacology, mental health professional committee of the Chinese nursing association, expert consensus on the code of practice for therapeutic drug monitoring (2019 edition)J. Neurosci. Mental Health 22202260160810.3969/j.issn.1009-6574.2002.08.013 · doi ↗
- 8Division of Therapeutic Drug Monitoring, Chinese Pharmacological Society Pharmaceutical bioanalysis committee, dalian Institute of chemical physics, Chinese academy of sciences, expert consensus on the use of chromatography for quality assurance in therapeutic drug monitoring (version 2021)Chin. Pharmaceut. J.5620211443144810.11669/cpj.2021.17.016 · doi ↗