Understanding the associations between receipt of, and interest in, advice from a healthcare professional and quality of life in individuals with a stoma from colorectal cancer: a latent profile analysis
William Goodman, Amy Downing, Matthew Allsop, Julie Munro, Gill Hubbard, Rebecca J Beeken

TL;DR
People with a stoma from colorectal cancer vary in quality of life, and those with lower quality of life want more advice from healthcare professionals.
Contribution
This study identifies distinct quality of life profiles and their associations with advice-seeking behavior in stoma patients.
Findings
Five distinct quality of life profiles were identified among stoma patients.
Profiles with lower quality of life showed stronger interest in receiving advice across multiple areas.
Tailoring advice to specific patient profiles may improve outcomes.
Abstract
To explore whether profiles derived from self-reported quality of life were associated with receipt of, and interest in, advice from a healthcare professional in people with a stoma. Secondary analysis of cross-sectional national survey data from England of 4487 people with a stoma from colorectal cancer. The survey assessed quality of life using various scales, receipt and interest in various forms of advice, and physical activity. A three-step latent profile analysis was conducted to determine the optimum number of profiles. Multinomial regression explored factors associated with profile membership. A series of logistic regression models examined whether profile membership was associated with interest in advice. Five profiles were identified; ‘consistently good quality of life’, ‘functional issues’, ‘functional and financial issues’, ‘low quality of life’ and ‘supported but…
Genes, proteins, chemicals, diseases, species, mutations and cell lines named across the full text — each resolved to its canonical identifier and authoritative record.
Click any figure to enlarge with its caption.
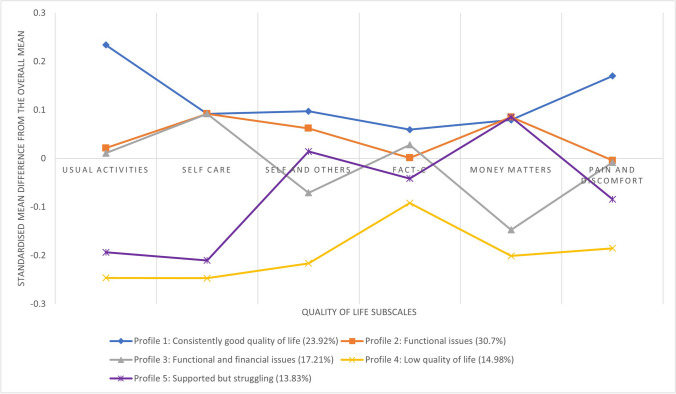 Figure 1
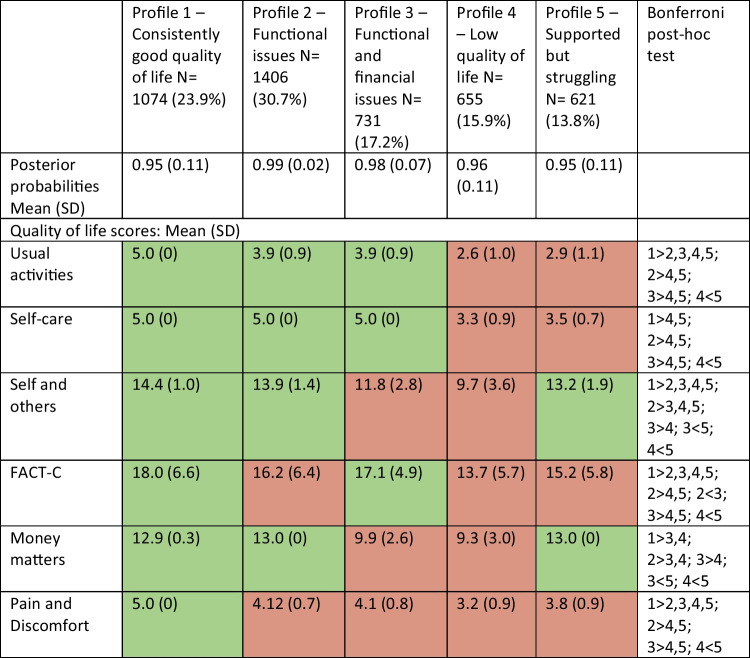 Figure 2
Peer Reviews
No public reviews on file for this paper yet. If you reviewed it on a platform where reviews are public (OpenReview, ICLR, NeurIPS, ICML), you can paste yours below so the community can read it here.
Videos
No videos yet. Explain this paper in a talk, walkthrough, or lecture? Add one.
Taxonomy
TopicsStoma care and complications · Diverticular Disease and Complications · Colorectal Cancer Surgical Treatments
Introduction
A stoma is an artificial opening on the abdomen that has been created to divert the flow of faeces or urine [1]. Recent estimates suggest over 175,000 people in the UK live with a stoma, with 13,500 stoma formation surgeries conducted annually [2]. Colorectal cancer is the foremost reason for creation of a bowel stoma [3], with those that have a stoma formed due to cancer having impaired quality of life (QoL) compared to those without a stoma [4]. A systematic review found that stoma complications, a changing body and changes to usual activities can negatively impact QoL, which can be further influenced by demographic and clinical characteristics such as age, gender and the time since cancer treatment [5]. Although QoL increases over time research suggests that it is still lower for those with, compared to those without, a stoma [4]. QoL is increasingly viewed as a key measure to evaluate patients’ recovery from treatment [6] and is incorporated into the NHS long-term strategy to enhance patient care and encourage patient self-management [7]. Therefore, an understanding of how QoL varies across people with a stoma will aid in the development of interventions to increase QoL. Specific groups in greatest need can be targeted by healthcare professionals to improve the relevant aspects of their QOL.
The receipt of advice from healthcare professionals is a common approach to empower patients with the ability to self-manage their condition, adopt healthier behaviours and thus improve their QoL. Behavioural factors such as physical activity can be associated with higher levels of QoL in people with colorectal cancer, and smoking has been associated with lower levels of QoL [8, 9]. A large study of colorectal cancer survivors (n=15254) looking at recall of physical activity advice found that receipt of advice from a healthcare professional was associated with reporting meeting physical activity guidelines [10]. A study of research priorities for people with a stoma found that communication with healthcare professionals about living with a stoma was ranked as one of their top priorities [11]. Research has also found that 42% of people living with a stoma had not received physical activity advice and 30% had not received dietary advice but 90% of these individuals wanted to receive this advice [12]. Furthermore, a previous study of people with a stoma from colorectal cancer concluded that ostomy nurses should provide advice to patients in order to help them adjust to specific challenges they may face such as stoma complications [13]. However, not all patients have the same needs, and understanding how to direct and adapt advice could support the delivery of more personalised care in line with the NHS long-term strategy [7].
QoL is a multidimensional construct that can help to capture an individual’s view on their experience of health and allows for the evaluation of interventions designed to improve this [14, 15]. Latent profile analysis (LPA) allows for the identification of subgroups of a sample. This is done by exploring whether there are patterns of responses to certain variables which allow for the exploration of group membership with other variables [16]. We conducted a previous exploratory LPA study which found that people with a stoma can be divided into 4 distinct groups based upon their self-reported QoL [17]. Those in the ‘low quality of life’ profile were more likely to have hernia or bulge, have a newer stoma and were less likely to be physically active whereas those in the ‘some quality of life concerns’ and ‘financial concerns’ profiles were more likely to be younger compared to the ‘consistently good quality of life’ profile. However, in this study, the advice and support that patients needed were inferred from their profile rather than assessed by self-report.
The present study includes this self-report information by utilising population-based data from a survey of colorectal cancer survivors collected in 2013 in England [18]. The primary objective of this study is to use LPA to identify groups of patients, based upon their self-reported QoL, and explore the associations between group membership and advice they received or would like to receive.
Methods
Study design
This study is a secondary analysis of a cross-sectional, national survey of colorectal cancer patients. The data were accessed using the COloRECTal cancer data Repository (CORECT-R). The CORECT-R resource, and analyses based upon the data within it, has received approval from the Southwest-Central Bristol research ethics committee (18/SW/0134) and conformed to the ethical guidelines of the Declaration of Helsinki.
Procedure and participants
Participants that had received a diagnosis of colorectal cancer in 2010 and 2011 and who were still alive as of January 2013 were sent a postal survey with 2 follow-up reminders. Eligible individuals were identified by the National Cancer Registration and Analysis Service and the survey was administered by the National Health Service (NHS) England. A total of 21,802 people responded to the survey; this study is focussed on the 4487 who self-reported that a stoma was present when completing the survey.
Measures
Demographic and clinical characteristics
Sex was measured using a single question and recorded as male or female. Age was from their time of diagnosis. An area-based measure of socioeconomic status was derived using the Indices of Multiple Deprivation [19]. Individuals were assigned to a quintile ranging from 1 (least deprived) to 5 (most deprived) based upon their postcode at diagnosis. Respondents were asked whether they had certain long-standing health problems (e.g. angina pectoris, high blood pressure) which were summed to provide the number of comorbid conditions each individual had, with the maximum being 17. Time since initial treatment was assessed by asking participants whether they were still receiving their initial treatment, or whether they were less than 3 months, between 3 and 12 months, between 1 and 5 years, or more than 5 years since treatment.
Behavioural measures
Physical activity was measured by a single item asking how many days in the past week they had been physically active for 30 min or more, in a way that it had raised their heartbeat. Smoking status was recorded as non-smoker, ex-smoker or smoker.
Receipt of and interest in advice
Participants were asked whether they had received advice from healthcare professionals across several different categories. They were also asked whether it would have been helpful to have more advice on each of these aspects. These questions came from the Cancer Patient Experience Survey [20] and were important for this study in that they map to key QoL domains. For the purposes of this study, the advice questions were condensed into diet and exercise, any financial information, information for family and friends, physical aspects of living with and beyond cancer and psychological aspects of living with and beyond cancer. Online Resource 1 outlines how these categories were condensed.
Quality of life
Several measures of QoL were used in the survey. Participants completed the EuroQol - 5 Dimensions - 5 Levels (EQ-5D-5L) but the visual analogue scale was not included in the questionnaire [21]. The dimensions of self-care (e.g. ‘I have no problems washing or dressing myself’), usual activities (e.g. ‘I have no problems doing my usual activities’) and pain and discomfort (e.g. ‘I have no pain or discomfort’) were used in the present study. Participants completed only the Additional Concerns subscale from the Functional Assessment of Cancer Therapy-Colorectal (FACT-C) scale in order to obtain participants’ views on specific concerns related to colorectal cancer [22](e.g. ‘I like the appearance of my body’). The survey also included the Social Difficulties Inventory [23], which consists of three subscales. The money matters subscale (e.g. ‘Have you had any financial difficulties’) and the self and others subscale (e.g. ‘Have you had any difficulty communicating with those closest to you (e.g. partner, children, parents)’) were used in the present study.
For the EQ-5D-5L, the dimensions were single items and the means were used in the analysis [21]. The dimensions use a Likert scale with 5 options (ranging from no problems to severe problems). Research suggests that Likert responses can be used as continuous measures as long as there are at least 5 levels [24, 25]. The FACT-C Additional Concerns subscale (7 items) score was calculated following the guidance for the scale [22]. The scores range from 0 to 28, with higher scores indicating better QoL. The Social Difficulties Inventory subscales were calculated according to the guidance [23]. The range for the self and others subscale (5 items) was 0-15 and for money matters (5 items) it was 0-13, with higher scores indicating worse QoL. However, to ensure comparability of the scales across the analysis, the scores for the EQ-5D-5L and the Social Difficulties Inventory were reversed so that higher scores indicated better QoL and lower scores indicated worse QoL.
The subscales/dimensions that were used within the present study were selected to allow for comparison with our previous LPA study within this population, which was the 2^nd^ study in a programme of work exploring the factors associated with QoL in people with a stoma [17]. Information on which subscales were selected to be comparable with those of the previous study can be found in Online Resource 2.
Statistical analysis
Data were analysed using Stata v16.0 and Latent GOLD v6.0.
All variables were summarised descriptively. Whilst the variables of deprivation quintile and time since cancer treatment are summarised descriptively, they were treated as continuous variables in the analyses alongside age, number of comorbidities and days in a week physically active due to having 5 or more categories [26]. The variables with the most missing data were those related to interest in receiving more advice, with missing data at 16.5% for these variables. This was a multi-response question; hence all variables had the same missing data if the question was missed. To account for the missing data in the analysis the maximum likelihood method was used which uses all available data.
The three-step approach to LPA was used for this study. The first step involved identifying the optimum number of profiles. A series of models were run with 1 to 6 (the number of subscales included in the analysis) profiles. These models were assessed on several model fit statistics: Akaike Information Criteria (AIC) and Bayesian Information Criteria (BIC) and entropy. For AIC and BIC, a smaller number indicates a better fit and for entropy a number closer to 1 indicates a better separation between profiles. The size of the smallest profile was also taken into consideration, and if this was below 5% of the sample then this model was not considered. Once the optimum model was selected, participants were assigned to their profile based upon probability scores. To present the QoL scores for each profile graphically, profile scores were standardised from 0 (poor QoL) to 1 (good QoL) for each subscale with the difference between the individual profile subscales and the standardised mean subscale scores calculated. This standardised mean difference was plotted. This approach was taken because of the differing total scores across the subscales used.
A one-way analysis of variance (ANOVA) was conducted to test whether there was an overall difference in the subscales across each profile and post hoc Bonferroni tests were conducted to test for differences in the subscale scores between profiles. A multinomial regression analysis was conducted to explore whether demographic and clinical characteristics, behavioural measures and receipt of advice were associated with profile membership. Overall differences between the profiles were assessed with the Wald Omnibus tests and associations between profiles were assessed with Wald χ^2^ pairwise comparison tests, with the Bonferroni correction applied for multiple tests. Finally, a series of logistic regressions was conducted exploring whether profile membership was associated with interest in receiving advice, controlling for clinical and demographic characteristics and whether they had previously received advice.
Results
Descriptive statistics
Table 1 provides an overview of the descriptive statistics of the sample. The sample of 4487 people with a stoma from colorectal cancer were predominantly male (60.4%), were between 1 and 5 years from their initial treatment (75.2%), and were physically active for an average of 2.1 days a week (SD=2.4). The majority of participants did not receive advice on any of the reported areas, although 48.6% of participants did report receiving advice on free prescriptions. Participants were most interested in receiving advice on the physical (28.5%) and psychological (24.3%) effects of treatment. Table 1. Descriptive statistics for the sample (N=4487)VariablesN (%)Demographic and clinical characteristics Sex Female1589 (35.4) Male2712 (60.4) Missing186 (4.2) Age: mean (SD)71.2 (10.9) Missing229 (5.1) Deprivation quintile 1, least deprived917 (20.4) 21071 (23.9) 31017 (22.7) 4846 (18.9) 5, most deprived636 (14.2) Missing0 Number of comorbidities: mean (SD)1.7 (1.5) Missing261 (5.8) Time since cancer treatment Still having treatment185 (4.1) Less than 3 months since treatment77 (1.7) Between 3 and 12 months since treatment680 (15.2) Between 1 and 5 years since treatment3374 (75.2) More than 5 years since treatment53 (1.2) Missing195 (4.4) Days in a week physically active: mean (SD)2.1 (2.4) Missing157 (3.5) Smoking status Non-smoker2231 (49.7) Ex-smoker1776 (39.6) Smoker393 (8.8) Missing87 (1.9)Receipt and interest in advice Advice received: diet, lifestyle and physical activity Yes2211 (49.3) No2033 (45.3) Missing243 (5.4) Advice received: financial information Yes2429 (54.1) No1815 (40.5) Missing243 (5.4) Advice received: information for family and friends Yes757 (16.9) No3487 (77.7) Missing243 (5.4) Advice received: physical effects of treatment Yes1091 (24.3) No3153 (70.3) Missing243 (5.4) Advice received: psychological effects of treatment Yes709 (15.8) No3535 (78.8) Missing243 (5.4) Interest in advice: diet, lifestyle and physical activity Yes1025 (22.8) No2722 (60.7) Missing740 (16.5) Interest in advice: financial information Yes982 (21.9) No2765 (61.6) Missing740 (16.5) Interest in advice: information for family and friends Yes564 (12.6) No3183 (70.9) Missing740 (16.5) Interest in advice: physical effects of treatment Yes1278 (28.5) No2469 (55.0) Missing740 (16.5) Interest in advice: psychological effects of treatment Yes1090 (24.3) No2657 (59.2) Missing740 (16.5)Quality of life Usual activities: mean (SD) range 1–53.8 (1.2) Missing61 (1.4) Self-care: mean (SD) range 1–54.5 (0.9) Missing34 (0.8) Self and others: mean (SD) range 0–1512.9 (2.6) Missing486 (10.8) FACT-C: mean (SD) range 0–2816.3 (6.2) Missing0 Money matters: mean (SD) range 0–1311.9 (2.2) Missing542 (12.1) Pain and discomfort: mean (SD) range 1–54.2 (0.9) Missing59 (1.3)N number of participants, SD standard deviation
Latent profile analysis
Based upon the model fit statistics and review of the overall make-up of the profiles the 5-profile model was selected as the optimum model. Model fit statistics for all models conducted can be found in Online Resource 3. Table 2 presents the average scores of the QoL subscales across each of the profiles and Fig. 1 graphically represents the standardised QoL scores for all the profiles. Table 2. Final profile frequencies and quality of life scores for each subscale*N *number of participants, *SD *standard deviation, post hoc Bonferroni tests indicate significant differences (p<.05) between the profiles, boxes highlighted in green indicate scores above the overall mean and those in red indicate scores below the overall meanFig. 1Representation of each of the profiles across the subscales
Profile 1 is characterised by higher-than-average scores across all QoL subscales; therefore, this was labelled as the ‘consistently good quality of life’ profile. Profile 2 was characterised as having generally higher-than-average scores on the usual activities, self-care, self and others and money matters subscales but lower-than-average scores on the FACT-C and pain and discomfort subscales; therefore, this was labelled as ‘functional issues’. Profile 3 was characterised by similar scores to profile 2 but with additional problems around money matters and this was labelled as ‘functional and financial issues’. Profile 4 was characterised by lower-than-average scores across all subscales and so was labelled the ‘low quality of life’ profile. Profile 5 had similarly low scores to profile 4 on the usual activities, self-care and FACT-C subscales but high scores on the self and others and money matters subscales and so this was labelled ‘supported but struggling’.
Association with latent profile membership and interest in advice
Table 3 outlines the descriptive statistics across all the profiles and the Wald Omnibus and χ^2^ tests for differences between profiles. Table 4 outlines the results from the multinomial regression with profile 1 ‘consistently good quality of life’ used as the reference group. Individuals that were classified into profiles 2–5 were more likely to have more comorbidities, be closer to when their treatment occurred and be less physically active compared to those in profile 1. Those that were members of profile 3 and 4 were more likely to be younger than those in profile 1 but those in profile 5 were more likely to be older. Those classified into profiles 4 and 5 were also more likely to be smokers than non-smokers and live in a more deprived area than those in profile 1. Those in profiles 3, 4 and 5 were more likely to be male than those in profile 1. Table 3. Descriptive statistics across the profilesVariableProfile 1, consistently good quality of life N= 1074 (23.9%)Profile 2, functional issues N= 1406 (30.7%)Profile 3, functional and financial issues N= 731 (17.2%)Profile 4, low quality of life N= 655 (15.0%)Profile 5, supported but struggling N= 621 (13.8%)Wald Omnibus p valueN (%)Demographic and clinical characteristicsSex42<.001 Female396 (36.9)548 (39.0)228 (31.2)206 (31.5)211 (34.0) Male628 (58.5)796 (56.6)484 (66.2)421 (64.3)383 (61.7)Deprivation quintile4441-3<.001 1, least deprived260 (24.2)314 (22.3)145 (19.8)98 (15.0)100 (16.1) 2276 (25.7)346 (24.6)195 (26.7)127 (19.4)127 (20.5) 3237 (22.1)330 (23.5)153 (20.9)138 (21.1)159 (25.6) 4177 (16.5)256 (18.2)138 (18.9)141 (21.5)134 (21.6) 5, most deprived124 (11.6)160 (11.4)100 (13.7)151 (23.1)101 (16.3)Time since diagnosis4, 511<.001 Still having treatment25 (2.3)59 (4.2)28 (3.8)41 (6.3)32 (5.2) < 3 months14 (1.3)21 (1.5)18 (2.5)15 (2.3)9 (1.5) 3 to 12 months133 (12.4)202 43 (14.4)151 (20.7)100 (15.3)94 (15.1) 1 to 5 years861 (80.2)1056 (75.1)515 (70.5)477 (72.8)465 (74.9) > 5 years10 (0.9)21 (1.5)7 (1.0)7 (1.1)8 (1.3)Smoking status410.004 Non-smoker592 (55.1)728 (51.8)360 (49.3)278 (42.4)273 (44.0) Ex-smoker394 (36.7)547 (38.9)287 (39.3)276 (42.1)272 (43.8) Smoker65 (6.1)103 (7.3)77 (10.5)90 (13.7)58 (9.3)Mean (SD) Comorbidities1.2 (0.04)^2-5^1.7 (0.04)^1, 4, 5^1.4 (0.1)^1, 4^2.4 (0.1)^1-3, 5^2.4 (0.1)^1, 2, 4^<.001 Age72.1 (0.3)^3-5^73.5 (0.3)^3-5^63.7 (0.4)^1, 2, 4, 5^68.2 (0.5)^1-3, 5^76.5 (0.4)^1-4^<.001 Physical activity2.9 (0.1)^2-5^2.1 (0.1)^1, 4, 5^2.4 (0.1)^1, 4, 5^1.3 (0.1)^1-3^1.0 (0.1)^1-3^<.001VariableProfile 1, consistently good quality of life N= 1074 (23.9%)Profile 2, functional issues N= 1406 (30.7%)Profile 3, functional and financial issues N= 731 (17.2%)Profile 4, low quality of life N= 655 (15.0%)Profile 5, supported but struggling N= 621 (13.8%)Wald Omnibus p valueN (%)Receipt of adviceAdvice received: diet, lifestyle and physical activity0.14 Yes510 (47.5)683 (48.6)403 (55.1)322 (49.2)293 (47.2) No500 (46.6)639 (45.5)303 (41.5)304 (46.4)287 (46.2)Advice received: financial information3, 43, 41, 21, 2<.001 Yes499 (46.5)683 (48.6)493 (67.4)420 (64.1)334 (53.8) No511 (47.6)639 (45.5)213 (29.1)206 (31.5)246 (39.6)Advice received: information for family and friends0.28 Yes145 (13.5)202 (14.4)155 (21.2)138 (21.1)117 (18.8) No865 (80.5)1120 (79.7)551 (75.4)488 (74.5)463 (74.6)Advice received: physical effects of treatment0.61 Yes228 (21.2)317 (22.6)226 (30.9)173 (26.4)147 (23.7) No782 (72.8)1005 (71.5)480 (65.7)453 (69.2)433 (69.7)Advice received: psychological effects of treatment0.63 Yes146 (13.6)194 (13.8)149 (20.4)117 (17.9)103 (16.6) No864 (80.5)1128 (80.2)557 (76.2)509 (77.7)477 (76.8)Superscript numbers relate to Wald χ^2^ pairwise comparison tests at p < .05 between each class and the class number indicated (1, consistently good quality of life; 2, functional issues; 3, functional and financial issues; 4, low quality of life; 5, supported but struggling); percentages might not add up to 100% due to missing dataTable 4Variables associated with profile membershipProfile 2, functional issuesProfile 3, functional and financial issuesProfile 4, low quality of lifeProfile 5, supported but strugglingOdds ratio (95%CI)Sex, male (reference: female)1.0 (0.8; 1.2)**1.4 (1.1; 1.8)****1.5 (1.2; 1.9)****1.4 (1.1; 1.8)**Age1.0 (1.0; 1.0)**0.9 (0.9; 0.9)****0.9 (0.9; 1.0)****1.0 (1.0; 1.1)**Deprivation quintile1.0 (0.9; 1.1)1.0 (1.0; 1.1)**1.2 (1.1; 1.3)****1.2 (1.1; 1.3)Number of comorbidities1.3 (1.2; 1.4)****1.4 (1.2; 1.5)****1.8 (1.7; 2.0)****1.6 (1.4; 1.7)Time since treatment0.8 (0.7; 0.9)****0.8 (0.7; 0.9)****0.8 (0.7; 0.9)****0.7 (0.6; 0.9)Days in a week physically active0.9 (0.9; 0.9)****0.9 (0.9; 1.0)****0.8 (0.7; 0.8)****0.7 (0.7; 0.8)**Smoking status (reference: non-smoker) Ex-smoker1.1 (0.9;1.3)1.2 (1.0; 1.5)1.2 (0.9; 1.5)1.3 (1.1; 1.7) Smoker1.2 (0.9; 1.7)1.4 (1.0; 2.1)**2.1 (1.4; 3.0)****2.0 (1.3; 3.0)**Advice received: diet, lifestyle and physical activity, yes (reference: no)1.1 (0.9; 1.4)1.0 (0.8; 1.2)0.8 (0.7; 1.1)1.0 (0.8; 1.3)Advice received: financial information, yes (reference: no)1.0 (0.9; 1.2)**1.7 (1.3; 2.1)**1.7 (1.3; 2.1)**1.2 (1.0; 1.6)Advice received: information for family and friends, yes (reference: no)1.0 (0.8; 1.3)1.2 (0.9; 1.6)1.4 (1.0; 1.9)1.2 (0.9; 1.7)Advice received: physical effects of treatment, yes (reference: no)1.2 (0.9; 1.5)1.2 (0.9; 1.3)1.1 (0.8; 1.5)1.2 (0.9; 1.6)Advice received: psychological effects of treatment, yes (reference: no)0.9 (0.7; 1.2)1.0 (0.7; 1.4)0.9 (0.6; 1.3)1.2 (0.8; 1.7)Bold values indicate statistical significance at p<.05; where 1.0 is bold, this remains a significant result and is the result of rounding; profile 1 ‘consistently good quality of life’ is used as the reference category for the other profilesCI confidence interval
Across profiles 3 and 4 individuals were more likely to have received financial advice compared to profile 1. But there were no other significant differences observed across the other receipt of advice variables.
Table 5 outlines the results of the logistic regression models exploring interest in receiving advice, with ‘not interested’ as the reference category. These results indicate that having already received advice was associated with less interest in wanting further advice, except for financial information where there was no significant difference. There were also significant results for profile membership being associated with interest in receiving further advice across all advice categories apart from financial information for the ‘Functional issues’ profile. Across all regressions, there were consistent findings that membership of profiles 2, 3, 4 and 5 compared to profile 1 were more likely to be interested in receiving further advice. Table 5. Logistic regression model results exploring interest in receiving adviceInterest in diet, lifestyle and physical activity adviceInterest in financial informationInterest in advice for family and friendsInterest in advice on the physical effects of treatmentInterest in advice on the psychological effects of treatmentOdds ratio (95%CI)Sex, male (reference: female)0.9 (0.8; 1.1)1.1 (0.9; 1.3)1.1 (0.9; 1.4)**0.8 (0.7; 1.0)****0.7 (0.6; 0.9)Age1.0 (1.0; 1.0)****1.0 (1.0; 1.0)****1.0 (1.0; 1.0)****1.0 (1.0; 1.0)****1.0 (1.0; 1.0)**Deprivation quintile1.0 (0.9; 1.1)**1.1 (1.1; 1.2)1.0 (0.9; 1.0)1.0 (0.9; 1.1)1.0 (0.9; 1.1)Number of comorbidities1.1 (1.0; 1.1)****1.1 (1.0; 1.2)****1.2 (1.1; 1.3)****1.1 (1.0; 1.1)****1.1 (1.1; 1.2)**Time since treatment1.0 (0.9; 1.2)0.9 (0.8; 1.0)1.0 (0.9; 1.1)1.0 (0.9; 1.1)1.1 (1.0; 1.2)Days in a week physically active1.0 (1.0; 1.0)1.0 (1.0; 1.1)1.0 (0.9; 1.0)1.0 (1.0; 1.0)1.0 (1.0; 1.0)Smoking status (reference: non-smoker) Ex-smoker0.9 (0.8; 1.1)0.9 (0.8; 1.1)1.0 (0.8; 1.3)0.9 (0.7; 1.0)0.8 (0.7; 1.0) Smoker1.0 (0.8; 1.3)1.3 (1.0; 1.8)1.2 (0.9; 1.7)1.0 (0.8; 1.3)0.9 (0.7; 1.2)Advice received: diet, lifestyle and physical activity, yes (reference: no)**0.5 (0.4; 0.6)**Advice received: financial information, yes (reference: no)0.9 (0.8; 1.1)Advice received: information for family and friends, yes (reference: no)**0.5 (0.4; 0.7)**Advice received: physical effects of treatment, yes (reference: no)**0.3 (0.2; 0.4)**Advice received: psychological effects of treatment, yes (reference: no)**0.4 (0.3; 0.5)Profiles (reference: 1, consistently good quality of life) 2, functional issues1.8 (1.4; 2.3)**1.2 (0.9; 1.6)**1.9 (1.3; 2.7)****1.8 (1.4; 2.3)2.0 (1.6; 2.6) 3, functional and financial issues2.6 (2.0; 3.4)****4.6 (3.5; 6.1)****3.9 (2.6; 5.8)****2.8 (2.2; 3.6)3.7 (2.8; 4.9) 4, low quality of life2.6 (2.0; 3.5)****5.4 (4.0; 7.3)****7.0 (4.7; 10.4)****4.2 (3.2; 5.5)5.2 (3.8; 6.9) 5, supported but struggling2.0 (1.5; 2.7)****1.8 (1.3; 2.5)****3.5 (2.3; 5.4)****1.7 (1.1; 4.9)**2.5 (1.8; 3.4)**Bold values indicate statistical significance at p<.05CI confidence interval
However, the strongest relationships were observed for the ‘low quality of life’ profile across all models, where being a member of this profile was associated with being interested in diet and physical activity advice (OR=2.6, 95%CI: 2.0; 3.5), financial information (OR=5.4, 95%CI: 4.0; 7.3), information for family and friends (OR=7.0, 95%CI: 4.7; 10.4), physical effects of living with and beyond cancer (OR=4.2, 95%CI: 3.2; 5.5) and psychological effects of living with and beyond cancer (OR=5.2, 95%CI: 3.8; 6.9) compared with profile 1.
Discussion
This study identified 5 distinct profiles of people with a stoma from colorectal cancer based upon their self-reported QoL. ‘Functional issues’ was the largest profile followed by ‘consistently good quality of life’, ‘functional and financial issues’, ‘low quality of life’ and ‘supported but struggling’. Members of the ‘functional and financial issues’ and ‘low quality of life’ profiles were more likely to have received advice on financial matters compared to profile 1, ‘consistently good quality of life’. There were no other differences between the profiles on the advice received. When compared with profile 1, all other profiles were more likely to be interested in receiving advice across all categories. These findings also compliment and confirm some of the findings from our previous LPA study and suggest further avenues for future research and tailoring of interventions [17].
The findings from the present study suggest there is no significant association between receipt of advice and profile membership beyond the receipt of financial information to the ‘low quality of life’ and ‘functional and financial issues’ profiles. This could suggest that health professionals are taking a blanket approach to the advice they provide to patients and not the tailored approach that is recommended and outlined in the NHS long-term strategy [7]. The Association for Stoma Care Nurses (ASCN) guidelines from 2021 indicate a number of areas in which advice and support should be offered to patients but there is no information provided on how to tailor this [27]. Research has suggested that patients can suffer from information overload which can prevent them from taking in information [28]; therefore, it is imperative that patients are not overburdened with possible unnecessary information which they are not interested in receiving.
This study has also identified that those from the profiles with the most QoL concerns, ‘low quality of life’, ‘supported but struggling’ and ‘functional and financial issues’ had the strongest associations with wanting more information for family, friends or carers. This could be due to them relying more on their support or possibly having younger families who could benefit from additional information or advice. A review of research into living with a stoma suggests that those that perceive they have greater social support from their family and friends have less difficulty in adjusting to a stoma than those who perceive they have little social support [29]. Therefore, ensuring that family and friends are included when advice is provided by healthcare professionals to patients may have a beneficial impact on the QoL of the patient.
Members across all profiles were less physically active than those in the ‘consistently good quality of life’ profile. Whilst this is in line with our previous LPA study for the ‘low quality of life’ profile [17], it may suggest that colorectal cancer survivors with a stoma have more functional issues than the wider stoma population. Lower levels of physical activity could also be related to being more likely to have comorbid conditions, or due to them being more likely to be closer to their initial treatment with side effects from certain cancer treatments associated with lower levels of physical activity [30, 31]. However, to determine causality a prospective study would be needed. Furthermore, being a smoker was associated with being a member of the ‘low quality of life’ profile, which previous research suggests is related to lower levels of QoL [9]. Around half of the respondents reported receiving advice on their health behaviour but close to a quarter of people reported being interested in receiving advice on this; therefore, a tailored approach of offering health behaviour advice dependent on individuals’ lifestyle and clinical characteristics may provide more positive outcomes.
This study supports the findings of our previous LPA research in this population [17]. Our previous LPA study identified 2 profiles with financial concerns similar to those identified by the present study, ‘functional and financial issues’ and ‘low quality of life’. The members of these profiles across both studies were likely to be younger [17] which is in line with other research that suggests that the QoL of younger individuals could be more impacted than older individuals [32, 33]. Therefore, it may be that there needs to be more comprehensive advice provided to younger individuals around financial issues. However, this study also identified those from profile 5, ‘supported but struggling’, as wanting more financial advice despite reporting no financial concerns. This could be explained by their reported concerns in carrying out usual activities and self-care and they may be pre-empting a change in their circumstances and want additional financial advice now.
A strength of this study is the large sample size, with the broad range of variables available which amplify our understanding from our previous LPA study amongst this population [17]. Furthermore, we can assess clinically meaningful differences between the profiles across some subscales. For example, for both the FACT-C additional concerns subscale and the subscales for the Social Difficulties Inventory, a change in scores of 2–3 points indicates a clinically meaningful difference [34, 35]. Therefore, apart from the ‘consistently good quality of life’ and ‘functional issues’ profiles, all profiles are different from each other in a clinically significant way. Future studies targeting interventions tailored to each profile could use this approach to look for clinically meaningful improvements in QoL as participants may move between profiles in response to interventions.
There are some limitations associated with this study. Firstly, the measures assessing QoL were generic and were not able to take into account the unique concerns of people with a stoma which would better allow us to identify the physical and mental issues associated with having a stoma and aid in tailoring interventions. This also impacts on the comparability with our previous LPA study which used stoma-related QoL measures [17]. Finally, although these results provide information on the type of advice patients would like to receive which can help in tailoring interventions, this data was collected several years ago and may not be indicative of current stoma care. National guidelines outlined in 2021 [27] have indicated areas for additional support to be offered to patients to facilitate their adjustment to their stoma similar to those outlined in this paper. However, consideration needs to be given to the personalisation of this support to patients which this paper offers advice on.
In conclusion, this study has identified 5 profiles based upon QoL of colorectal cancer survivors with a stoma. The results suggest that people with QoL concerns are not receiving adequate levels of advice across different areas relevant to their well-being, and this is particularly prominent for those who are in the ‘low quality of life’ profile. To improve care for this group of patients, ASCN guidelines on support for patients need to consider how to best to tailor advice to those patients that need it, and how to deliver this advice in a meaningful way.
Supplementary information
ESM 1(DOCX 13 kb)ESM 2(DOCX 13 kb)ESM 3(DOCX 12 kb)
The reference list from the paper itself. Each links out to its DOI / PubMed record.
- 1Taylor P An introduction to stomas: reasons for their formation Nurs Times 200510129636416052949 · pubmed ↗
- 2Kettle, J (2019) Sto Map Programme Baseline Report. Cited 2023 09 Feb; Available from: https://www.eoecph.nhs.uk/Files/Integrated%20Care/Sto Map%20Baseline%20Report%20FINAL.pdf
- 3Carlsson E Concerns and quality of life before surgery and during the recovery period in patients with rectal cancer and an ostomy J Wound Ostomy Continence Nurs 201037665466110.1097/WON.0b 013e 3181 f 90f 0c 21052026 · doi ↗ · pubmed ↗
- 4Wilson T Alexander D Clinical and non-clinical factors influencing postoperative health-related quality of life in patients with colorectal cancer Br J Surg 200895111408141510.1002/bjs.637618844250 · doi ↗ · pubmed ↗
- 5Vonk-Klaassen SM Ostomy-related problems and their impact on quality of life of colorectal cancer ostomates: a systematic review Qual Life Res 201625112513310.1007/s 11136-015-1050-326123983 PMC 4706578 · doi ↗ · pubmed ↗
- 6Megari K Quality of life in chronic disease patients Health Psychol Res 201313 e 2710.4081/hpr.2013.93226973912 PMC 4768563 · doi ↗ · pubmed ↗
- 7NHS (2019) The NHS long term plan. Cited 2023 02 Feb; Available from: https://www.longtermplan.nhs.uk/wp-content/uploads/2019/08/nhs-long-term-plan-version-1.2.pdf
- 8Eyl RE Quality of life and physical activity in long-term (≥5 years post-diagnosis) colorectal cancer survivors - systematic review Health Qual Life Outcomes 2018161121132985910810.1186/s 12955-018-0934-7PMC 5984808 · doi ↗ · pubmed ↗