Radiomic score for lung nodules as a prognostic biomarker in locally advanced rectal cancer patients: A bi‐institutional study
Zhiyuan Zhang, Jiazhou Wang, Di Dai, Fan Xia, Yiqun Sun, Guichao Li, Juefeng Wan, Lijun Shen, Hui Zhang, Yan Wang, Jie Zhong, Jun Bao, Zhen Zhang

TL;DR
This study develops a radiomic score to predict lung nodule malignancy and prognosis in rectal cancer patients, improving personalized treatment decisions.
Contribution
A novel radiomic score (Rad-score) is developed and validated for predicting lung nodule malignancy and prognosis in locally advanced rectal cancer patients.
Findings
The Rad-score effectively distinguishes lung nodule malignancy with C-index values of 0.793 in training and 0.730 in validation sets.
The Cli-Rad-score outperforms clinicopathological data alone in risk stratification for LARC patients with lung nodules.
Abstract
Undetermined lung nodules are common in locally advanced rectal cancer (LARC) and lack precise risk stratification. This study aimed to develop a radiomic‐based score (Rad‐score) to distinguish metastasis and predict overall survival (OS) in patients with LARC and lung nodules. Retrospective data from two institutions (July 10, 2006—September 24, 2015) was used to develop and validate the Rad‐score for distinguishing lung nodule malignancy. The prognostic value of the Rad‐score was investigated in LARC cohorts, leading to the construction and validation of a clinical and radiomic score (Cli‐Rad‐score) that incorporates both clinical and radiomic information for the purpose of improving personalized clinical prognosis prediction. Descriptive statistics, survival analysis, and model comparison were performed to assess the results. The Rad‐score demonstrated great performance in…
Genes, proteins, chemicals, diseases, species, mutations and cell lines named across the full text — each resolved to its canonical identifier and authoritative record.
Click any figure to enlarge with its caption.
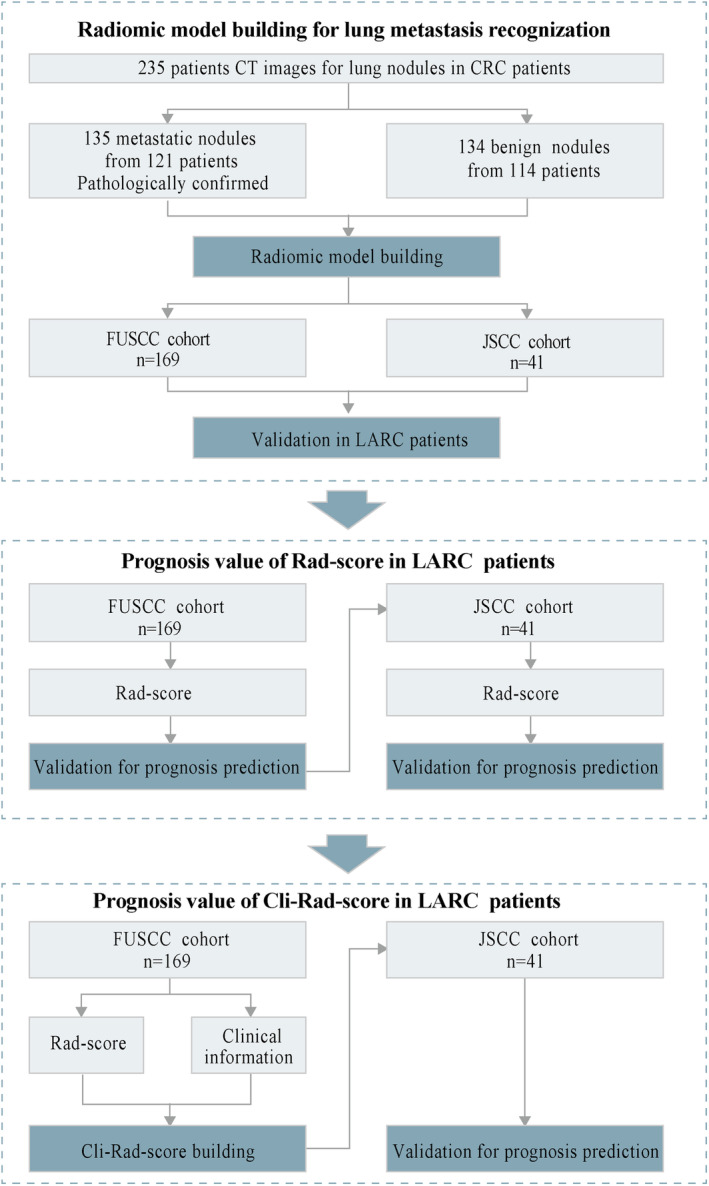 FIGURE 1
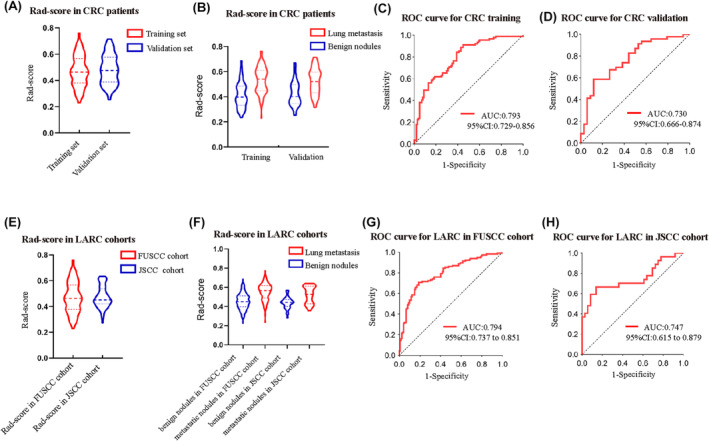 FIGURE 2
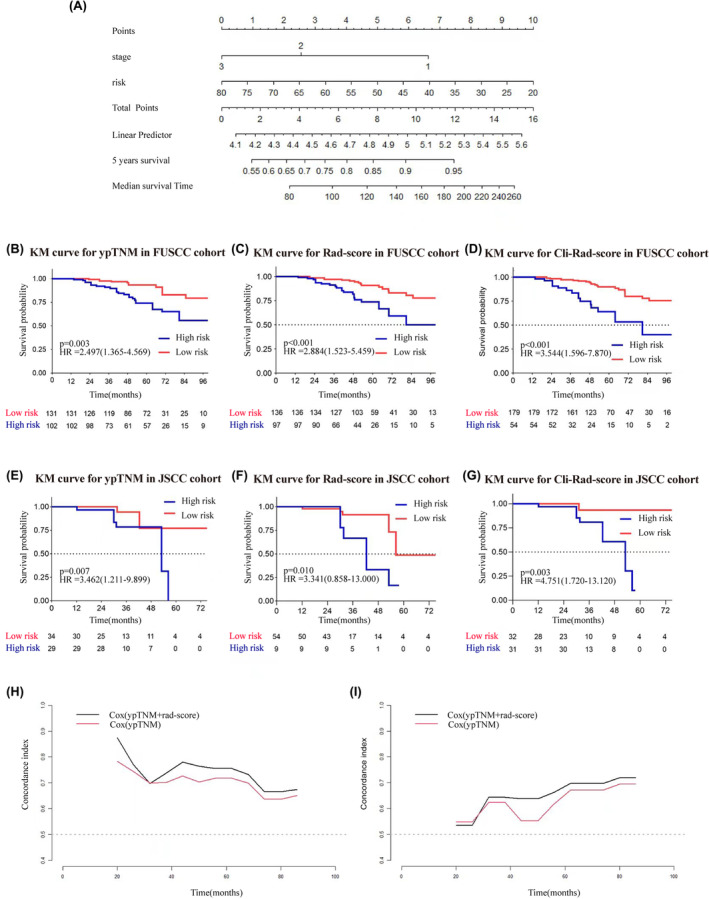 FIGURE 3
| Patients enrolled in LARC in FUSCC |
| Patients enrolled in LARC in JSCC |
| |||||
|---|---|---|---|---|---|---|---|---|
| Nodules distribution | Nodules distribution | |||||||
| Overall ( | Benign ( | Metastasis ( | Overall ( | Benign ( | Metastasis ( | |||
| Gender, | ||||||||
| Female | 62 (36.7) | 34 (35.4) | 28 (38.4) | 0.817 | 29 (70.7) | 18 (69.2) | 11 (73.3) | 1.000 |
| Male | 107 (63.3) | 62 (64.6) | 45 (61.6) | 12 (29.3) | 8 (30.8) | 4 (26.7) | ||
| Age, Median (IQR) | 57 [48.00, 62.00] | 55.5 [47.00, 61.00] | 58 [50.00, 62.00] | 0.124 | 56.56 (11.09) | 57.96 (11.21) | 54.13 (10.82) | 0.293 |
| Location, | ||||||||
| Rectal | 169 (100.0) | 96 (100.0) | 73 (100.0) | 41 (100.0) | 26 (100.0) | 15 (100.0) | ||
| Colon | 0 (0.0) | 0 (0.0) | 0 (0.0) | 0 (0.0) | 0 (0.0) | 0 (0.0) | ||
| cT, | ||||||||
| cT2 | 4 (2.4) | 4 (4.2) | 0 (0.0) | 0.218 | 1 (2.4) | 0 (0.0) | 1 (6.7) | 0.180 |
| cT3 | 134 (79.3) | 76 (79.2) | 58 (79.5) | 16 (39.0) | 12 (46.2) | 4 (26.7) | ||
| cT4 | 31 (18.3) | 16 (16.7) | 15 (20.5) | 24 (58.5) | 14 (53.8) | 10 (66.7) | ||
| cN, | ||||||||
| cN0 | 9 (5.3) | 5 (5.2) | 4 (5.5) | 0.459 | 9 (22.0) | 4 (15.4) | 5 (33.3) | 0.200 |
| cN1 | 60 (35.5) | 38 (39.6) | 22 (30.1) | 14 (34.1) | 8 (30.8) | 6 (40.0) | ||
| cN2 | 100 (59.2) | 53 (55.2) | 47 (64.4) | 18 (43.9) | 14 (53.8) | 4 (26.7) | ||
| cstage, | ||||||||
| cI | 2 (1.2) | 2 (2.1) | 0 (0.0) | 0.529 | 0 (0.0) | 0 (0.0) | 0 (0.0) | 0.017 |
| cII | 7 (4.1) | 3 (3.1) | 4 (5.5) | 7 (17.1) | 4 (15.4) | 3 (20.0) | ||
| cIII | 160 (94.7) | 91 (94.8) | 69 (94.5) | 30 (73.2) | 22 (84.6) | 8 (53.3) | ||
| cIV | 0 (0.0) | 0 (0.0) | 0 (0.0) | 4 (9.8) | 0 (0.0) | 4 (26.7) | ||
| CEA, | ||||||||
| Normal | 91 (53.8) | 61 (63.5) | 30 (41.1) | 0.001 | 36 (87.8) | 22 (84.6) | 14 (93.3) | 0.744 |
| Abnormal | 75 (44.4) | 32 (33.3) | 43 (58.9) | 5 (12.2) | 4 (15.4) | 1 (6.7) | ||
| Unknown | 3 (1.8) | 3 (3.1) | 0 (0.0) | 0 (0.0) | 0 (0.0) | 0 (0.0) | ||
| Distance to anus, | ||||||||
| >5 cm | 74 (43.8) | 50 (52.1) | 24 (32.9) | 0.019 | 30 (73.2) | 18 (69.2) | 12 (80.0) | 0.701 |
| <5 cm | 95 (56.2) | 46 (47.9) | 49 (67.1) | 11 (26.8) | 8 (30.8) | 3 (20.0) | ||
| Neoadjuvant treatment, | ||||||||
| Yes | 169 (100.0) | 96 (100.0) | 73 (100.0) | 26 (63.4) | 16 (61.5) | 10 (66.7) | 1.000 | |
| No | 0 (0.0) | 0 (0.0) | 0 (0.0) | 15 (36.6) | 10 (38.5) | 5 (33.3) | ||
| Surgery, | ||||||||
| No | 0 (0.0) | 0 (0.0) | 0 (0.0) | 0.149 | 3 (7.3) | 1 (3.8) | 2 (13.3) | 0.164 |
| Dixon | 91 (53.8) | 58 (60.4) | 33 (45.2) | 23 (56.1) | 17 (65.4) | 6 (40.0) | ||
| Miles | 72 (42.6) | 35 (36.5) | 37 (50.7) | 13 (31.7) | 6 (23.1) | 7 (46.7) | ||
| Colon cancer resection | 0 (0.0) | 0 (0.0) | 0 (0.0) | 0 (0.0) | 0 (0.0) | 0 (0.0) | ||
| Transanal resection | 0 (0.0) | 0 (0.0) | 0 (0.0) | 0 (0.0) | 0 (0.0) | 0 (0.0) | ||
| Hartmann | 6 (3.6) | 3 (3.1) | 3 (4.1) | 2 (4.9) | 2 (7.7) | 0 (0.0) | ||
| pCR, | ||||||||
| Non‐pCR | 142 (84.0) | 73 (76.0) | 69 (94.5) | <0.001 | 5 (12.2) | 4 (15.4) | 1 (6.7) | 0.636 |
| pCR | 24 (14.2) | 22 (22.9) | 2 (2.7) | 36 (87.8) | 22 (84.6) | 14 (93.3) | ||
| Unknown | 3 (1.8) | 1 (1.0) | 2 (2.7) | 0 (0.0) | 0 (0.0) | 0 (0.0) | ||
| Pathology, | ||||||||
| Adenocarcinoma | 159 (94.1) | 87 (90.6) | 72 (98.6) | 0.097 | 35 (85.4) | 22 (84.6) | 13 (86.7) | 0.895 |
| Mucinous adenocarcinoma | 4 (2.4) | 4 (4.2) | 0 (0.0) | 2 (4.9) | 1 (3.8) | 1 (6.7) | ||
| Signet ring cell carcinoma | 0 (0.0) | 0 (0.0) | 0 (0.0) | 2 (4.9) | 2 (7.7) | 0 (0.0) | ||
| Squamous | 0 (0.0) | 0 (0.0) | 0 (0.0) | 2 (4.9) | 1 (3.8) | 1 (6.7) | ||
| Unknown | 6 (3.6) | 5 (5.2) | 1 (1.4) | 0 (0.0) | 0 (0.0) | 0 (0.0) | ||
| Differentiation, | ||||||||
| Poorly | 17 (10.1) | 5 (5.2) | 12 (16.4) | <0.001 | 14 (34.1) | 8 (30.8) | 6 (40.0) | 0.637 |
| Moderately | 82 (48.5) | 39 (40.6) | 43 (58.9) | 18 (43.9) | 11 (42.3) | 7 (46.7) | ||
| Highly | 4 (2.4) | 3 (3.1) | 1 (1.4) | 2 (4.9) | 1 (3.8) | 1 (6.7) | ||
| Unknown | 66 (39.1) | 49 (51.0) | 17 (23.3) | 7 (17.1) | 6 (23.1) | 1 (6.7) | ||
| CRM, | ||||||||
| Negative | 165 (97.6) | 96 (100) | 69 (94.5) | 0.033 | 26 (63.4) | 14 (53.8) | 12 (80.0) | 0.181 |
| Positive | 4 (2.4) | 0 (0.0) | 4 (5.5) | 0 (0.0) | 0 (0.0) | 0 (0.0) | ||
| Unknown | 0 (0.0) | 0 (0.0) | 0 (0.0) | 15 (36.6) | 12 (46.2) | 3 (20.0) | ||
| Vascular invasion, | ||||||||
| Negative | 155 (91.7) | 91 (94.8) | 64 (87.7) | 0.167 | 22 (53.7) | 12 (46.2) | 10 (66.7) | 0.344 |
| Positive | 14 (8.3) | 5 (5.2) | 9 (12.3) | 5 (12.2) | 3 (11.5) | 2 (13.3) | ||
| Unknown | 0 (0.0) | 0 (0.0) | 0 (0.0) | 14 (34.1) | 11 (42.3) | 3 (20.0) | ||
| Perineural invasion, | ||||||||
| Negative | 144 (85.2) | 90 (93.8) | 54 (74.0) | 0.001 | 24 (58.5) | 14 (53.8) | 10 (66.7) | 0.196 |
| Positive | 25 (14.8) | 6 (6.2) | 19 (26.0) | 3 (7.3) | 1 (3.8) | 2 (13.3) | ||
| Unknown | 0 (0.0) | 0 (0.0) | 0 (0.0) | 14 (34.1) | 11 (42.3) | 3 (20.0) | ||
| ypT, | ||||||||
| ypT0 | 29 (17.2) | 26 (27.1) | 3 (4.1) | <0.001 | 8 (19.5) | 7 (26.9) | 1 (6.7) | 0.489 |
| ypT1 | 6 (3.6) | 5 (5.2) | 1 (1.4) | 2 (4.9) | 1 (3.8) | 1 (6.7) | ||
| ypT2 | 45 (26.6) | 25 (26.0) | 20 (27.4) | 11 (26.8) | 6 (23.1) | 5 (33.3) | ||
| ypT3 | 86 (50.9) | 39 (40.6) | 47 (64.4) | 15 (36.6) | 10 (38.5) | 5 (33.3) | ||
| ypT4 | 3 (1.8) | 1 (1.0) | 2 (2.7) | 2 (4.9) | 1 (3.8) | 1 (6.7) | ||
| Unknown | 0 (0.0) | 0 (0.0) | 0 (0.0) | 3 (7.3) | 1 (3.8) | 2 (13.3) | ||
| ypN, | ||||||||
| ypN0 | 103 (60.9) | 69 (71.9) | 34 (46.6) | 0.003 | 32 (78.0) | 20 (76.9) | 12 (80.0) | 0.708 |
| ypN1 | 52 (30.8) | 20 (20.8) | 32 (43.8) | 7 (17.1) | 4 (15.4) | 3 (20.0) | ||
| ypN2 | 14 (8.3) | 7 (7.3) | 7 (9.6) | 2 (4.9) | 2 (7.7) | 0 (0.0) | ||
| Unknown | 0 (0.0) | 0 (0.0) | 0 (0.0) | 0 (0.0) | 0 (0.0) | 0 (0.0) | ||
| yp‐stage, | ||||||||
| yp0 | 24 (14.2) | 22 (22.9) | 2 (2.7) | <0.001 | 11 (26.8) | 9 (34.6) | 2 (13.3) | 0.516 |
| ypI | 38 (22.5) | 27 (28.1) | 11 (15.1) | 11 (26.8) | 6 (23.1) | 5 (33.3) | ||
| ypII | 39 (23.1) | 19 (19.8) | 20 (27.4) | 7 (17.1) | 4 (15.4) | 3 (20.0) | ||
| ypIII | 68 (40.2) | 28 (29.2) | 40 (54.8) | 9 (22.0) | 6 (23.1) | 3 (20.0) | ||
| Unknown | 0 (0.0) | 0 (0.0) | 0 (0.0) | 3 (7.3) | 1 (3.8) | 2 (13.3) | ||
| Pathologic confirmation, | ||||||||
| No | 139 (82.2) | 94 (97.9) | 45 (61.6) | <0.001 | 40 (97.6) | 26 (100.0) | 14 (93.3) | 0.366 |
| Yes | 30 (17.8) | 2 (2.1) | 28 (38.4) | 1 (2.4) | 0 (0.0) | 1 (6.7) | ||
| Number of lung nodules, | ||||||||
| Single | 87 (51.5) | 63 (65.6) | 24 (32.9) | <0.001 | 15 (36.6) | 12 (46.2) | 3 (20.0) | 0.181 |
| Multi | 82 (48.5) | 33 (34.4) | 49 (67.1) | 26 (63.4) | 14 (53.8) | 12 (80.0) | ||
| Lateral, | ||||||||
| Unilateral | 103 (60.9) | 70 (72.9) | 33 (45.2) | <0.001 | 22 (53.7) | 17 (65.4) | 5 (33.3) | 0.097 |
| Bilateral | 66 (39.1) | 26 (27.1) | 40 (54.8) | 19 (46.3) | 9 (34.6) | 10 (66.4) | ||
| FUSCC cohort | JSCC cohort | |||
|---|---|---|---|---|
| Model | C‐index | 95% confidence interval | C‐index | 95% confidence interval |
| Rad‐score for metastasis recognization in LARC patients | 0.794 | 0.737–0.851 | 0.747 | 0.615–0.879 |
| Prognosis prediction from ypTNM stage | 0.695 | 0.638–0.752 | 0.595 | 0.472–0.718 |
| Prognosis prediction from Rad‐score | 0.633 | 0.538–0.727 | 0.546 | 0.412–0.680 |
| Prognosis prediction from Cli‐Rad‐score | 0.735 | 0.668–0.802 | 0.618 | 0.500–0.736 |
- —National Natural Science Foundation of China 10.13039/501100001809
- —Shanghai Anti‐Cancer Association 10.13039/100017633
- —Shanghai Municipal Health Commission 10.13039/100017950
- —Shanghai Science and Technology Development Foundation 10.13039/100012543
- —Beijing Xisike Clinical Oncology Research Foundation 10.13039/100018904
- —National Natural Science Foundation of China 10.13039/501100001809
Peer Reviews
No public reviews on file for this paper yet. If you reviewed it on a platform where reviews are public (OpenReview, ICLR, NeurIPS, ICML), you can paste yours below so the community can read it here.
Videos
No videos yet. Explain this paper in a talk, walkthrough, or lecture? Add one.
Taxonomy
TopicsRadiomics and Machine Learning in Medical Imaging · Lung Cancer Diagnosis and Treatment · Colorectal Cancer Surgical Treatments
INTRODUCTION
1
Tumor metastasis is a significant contributor to mortality in colorectal cancer (CRC). Among the extra‐abdominal sites, lung metastases are more commonly observed in rectal cancer compared to colon cancer.1, 2, 3 Accurately diagnosing lung nodules plays a crucial role in the management of locally advanced rectal cancer (LARC) as it aids in determining tumor stage and guiding personalized treatment decisions. In the era of precision and personalized medicine, various clinical approaches have been suggested to evaluate the malignancy of lung nodules and assess the risk of prognosis.4, 5, 6 However, confirming the nature of lung nodules poses challenges due to the invasive nature of biopsies or the need for prolonged follow‐up, which is often impractical during the initial diagnostic phase. Imaging features and PET‐CT scans can provide indications of potentially malignant nodules. For high‐risk patients, it may also be advisable to perform biopsies to accurately determine the pathological type of the nodules. Due to the challenges associated with confirming the nature of benign nodules, a long‐term follow‐up approach is often employed in clinical practice. This is inappropriate as clinically suspected benign nodules undergo surgical confirmation. While this may not be the ideal solution, it represents the closest approximation to the “gold standard” currently utilized in the field. Therefore, the identification of reliable indicators for recognizing malignant lung nodules and assessing prognostic risk is of utmost importance. Radiomics is a sophisticated quantitative tool that transforms digital medical images into high‐dimensional data, allowing researchers to extract quantitative features.7 Previous studies on radiomics have demonstrated its significant potential in identifying malignancies and classifying prognostic outcomes in CRC patients.8, 9 However, the value of radiomics in prognostic prediction for LARC patients is an area that requires further investigation and exploration.
There are numerous prognostic prediction models for locally progressive rectal cancer, and in addition to conventional clinical factors, it is important to explore imaging features. Image‐based predictive tools come from several main sources: advances in model building with multi‐omics, functional magnetic resonance image sequence, and incorporation of additional predictors such as PETCT.10, 11, 12 However, all these predictions are aimed at primary foci for affective feature extraction, and there is still a lack of appropriate assessment methods for patients at high risk of potential lung metastases accompanied by pulmonary nodules.
Our study aimed to evaluate the significance of CT‐based radiomic features in identifying lung metastases and predicting prognosis in patients with LARC.
MATERIALS AND METHODS
2
Study design and data source
2.1
In this retrospective study, we recruited CRC and LARC patients from two hospitals: Fudan University Shanghai Cancer Center (FUSCC) and JiangSu Province Cancer Center (JSCC). The development of the predictive model for the lung nodule radiomic score (Rad‐score) was based on a dataset of 235 CRC patients from FUSCC. Benign lung nodules were confirmed by stable morphological state on follow‐up CT scans over a 2‐year period or through pathological biopsy. Lung metastases were verified through surgical resection or biopsy specimens. The CRC patient cohort was randomly divided into two datasets, Rad‐train and Rad‐valid, with a 70/30 ratio, respectively, for training and validation using a random algorithm. After constructing the model, we applied the Rad‐score to validate the nodules nature assessment of malignancy in patients with LARC. Internal validation was performed using LARC patients from FUSCC (FUSCC cohort). Information regarding lung nodules was collected from follow‐up data and pathological diagnoses. Following internal validation, we recruited LARC patients from JSCC for external validation (JSCC cohort). The data from these different cohorts were meticulously separated to ensure the rigorous validation of the model.
To predict prognosis, relevant clinical information was extracted from the electronic medical record (EMR) system. Independent clinical prognostic factors were identified through careful filtering. To further evaluate the enhanced prognostic prediction capacity of established Rad‐score, Cli‐Rad‐score was developed based on a nomogram with Rad‐score and clinical prognostic factord. The Cli‐Rad‐score was constructed using the FUSCC cohort and further validated in the JSCC cohort. Survival data obtained from medical records or follow‐ups conducted by healthcare professionals, were utilized for analysis. Please refer to Figure 1; Figure S1 for visual representation of the study flow diagram.
Flowchart for radiomic study. The lung images from CRC patients in Fudan University Shanghai Cancer Center were divided into two cohorts at a ratio of 7:3 to generate a radiomic model by LASSO regression and validate it. To test the stability of the model in LARC patients, the malignant prediction from the radiomic model was conducted in two separate cohorts from FUSCC (FUSCC cohort) and JiangSu province Cancer Center (JSCC cohort). To explore the prognostic value of the radiomic model in LARC patients, a COX regression model was built based on LARC patients in FUSCC, and then a nomogram based on the clinical and radiomic information was built in FUSCC cohort and validated in JSCC cohort. CRC colon and rectal cancer, FUSCC, Fudan University Shanghai Cancer Center; JSCC, JiangSu province Cancer Center; LARC Locally Advanced Rectal Cancer; LASSO, Least Absolute Shrinkage and Selection Operator.
This study received approval from the Institutional Review Boards of both FUSCC and JSCC. It was conducted in accordance with the ethical principles outlined in the 1964 Helsinki Declaration and its subsequent amendments.
Patients' enrollment and exclusion criteria
2.2
To establish the Rad‐score, a group of CRC patients was selected based on specific criteria. These criteria included: (1) Histologically‐confirmed colorectal cancer without any other concurrent malignant tumors, (2) histologically‐confirmed lung metastases in the period of follow‐up, (3) follow‐up of non‐progressing lesions for at least 2 years or biopsy confirmation for benign nodules, (4) presence of at least one pulmonary nodule with a diameter less than 20 mm, (5) inclusion of only solid nodules. It is important to note that no contrast injection was administered to the patients in this cohort.
For the prognostic analysis, the inclusion criteria for rectal cancer patients were as follows: (1) histologically‐confirmed locally advanced rectal cancer without any other concurrent malignant tumors, (2) histologically‐proven lung metastases in the period of follow‐up or evidence of increasing volume during the follow‐up period, (3) detection of lung metastases within 6 months from the time of diagnosis, (4) follow‐up of non‐progressing lesions for at least 1 year or biopsy confirmation for benign nodules, (5) presence of at least one pulmonary nodule with a diameter less than 20 mm, (6) availability of complete CT datasets and clinical characteristics, (7) inclusion of only solid nodules. It is important to note that no contrast injection was administered to the patients in this analysis. The overall survival (OS) time was defined from the date of diagnosis to the date of death event.
CT image segmentation and radiomic model development
2.3
All patients included in the study underwent lung CT examinations prior to neoadjuvant chemoradiotherapy or surgery. In cases where patients had multiple nodules, we randomly selected up to three qualified nodules for inclusion. The selected nodule lesion was then reconstructed using standard parameters, including a slice thickness of 1.0 mm, slice increment of 1 mm, pitch of 1.078, field of view of 15 cm, and a matrix size of 512 × 512. These parameters were used to ensure consistent and accurate image reconstruction for further analysis.
CT scan images were retrieved from the hospital's picture archiving and communication system (PACS). In order to analyze the images, the boundaries of the regions of interest (ROIs) were defined by the outer contour of the solid pulmonary nodules. These ROIs were then composed into a 3D volume, with each slide representing a slice of the ROI. A doctor with at least 5 years of experience in interpreting medical images delineates the boundaries, which are then reviewed by another doctor with at least 10 years of experience using MIM software (v6.6.3; MIM Software Inc.). Figure S2 provides representative examples of this process.
A total of 254 radiomic features were extracted from the CT scan images using a custom MATLAB‐based tool (MathWorks, Natick, MA, USA). Our previous publications13 provide a detailed description of the extraction algorithms utilized in this study, which categorized the extracted features into four groups: (1) histogram‐based features, (2) gray level co‐occurrence matrix (GLCM) features,14 (3) gray‐level run‐length matrix (GLRLM) features,15 and (4) wavelet‐based features. To identify the most informative features, the least absolute shrinkage and selection operator (LASSO) logistic model was employed in the training cohort. Subsequently, a logistic model was utilized to establish the Rad‐score based on the selected features.
Evaluation of prognostic prediction score
2.4
Furthermore, we assessed the prognostic predictive ability of the Rad‐score in LARC patients with lung nodules. Univariate Cox analysis was conducted to evaluate the association between the Rad‐score and patient outcomes. To determine the optimal cutoff value for the Rad‐score, we utilized the algorithm provided by the “survminer” package in R.
Prognostic model establishment and validation
2.5
The EMR system was utilized to obtain clinical and pathological information regarding patients. This data included age, gender, primary tumor location, type of surgery, distribution and number of pulmonary nodules, levels of carcinoembryonic antigen (CEA), clinical stage (cTNM), pathological stage after surgery (ypTNM), pathological type, response to neoadjuvant chemotherapy, degree of tumor differentiation, presence of vascular invasion, perineural invasion (PNI), circumferential resection margin (CRM), and patient survival outcomes.
Univariate and multivariate Cox regression analyses were performed to identify potential predictors of survival among the collected clinicopathological variables. Variables that displayed statistical significance (p < 0.05) in the multivariate Cox regression analysis were integrated into the development of the prognostic Cli‐Rad‐score, in conjunction with the Rad‐score. The discriminatory ability of the prognostic Cli‐Rad‐score and the Rad‐score biomarker was assessed using Harrell's concordance index (C‐index) and Kaplan–Meier (KM) survival analysis.
Statistical analysis
2.6
All statistical analyses were performed using R software (version 4.0.1; https://www.r‐project.org/). Two‐sided tests were conducted, and a significance level of p < 0.05 was considered statistically significant. The following R packages were utilized: “glmnet”, “timeROC”, “rms”, ‘survival’, “Hmisc”, and “maxstat.” LASSO regression was employed for feature selection, model building, and the calculation of receiver operating characteristic (ROC) curves and C‐indexes to evaluate model performance. Survival analysis was conducted using a Cox proportional hazards model. KM survival analysis, log‐rank test and C‐index were employed to assess OS prediction. ANOVA test was used to compare the time‐related predictive ability of the prognostic models. The optimal cutoff point was determined using the “maxstat” package. Calibration curves for the models can be found in the supplementary materials.
RESULTS
3
Patient characteristics
3.1
A radiomics model was developed using 235 CRC patients, divided into a training set (Rad‐train) and a validation set (Rad‐valid). In the Rad‐train set, there were 89 benign lung nodules and 84 metastatic nodules. The diagnosis of benign nodules was primarily established through follow‐up data, with a median follow‐up duration of 60.2 months implemented to ensure the reliability of the diagnosis. Detailed patient characteristics can be found in Table 1, while specific information for the Rad‐train and Rad‐valid sets is provided in Tables S2 and S3.
To validate the model's performance in predicting malignancy in LARC patients, a total of 238 nodules from 169 patients in the FUSCC cohort and 63 nodules from 41 patients in the JSCC cohort were included. Among these, 96 nodules in the FUSCC cohort and 26 nodules in the JSCC cohort were malignant. Due to the size of some nodules, it may not always be possible to obtain pathological confirmation, particularly in cases where the patient is diagnosed with locally advanced rectal cancer. However, in the FUSCC cohort, pathological confirmation was available for 17.8% of patients, and in the JSCC cohort, it was available for 2.4% of patients. In most cases, nodules were confirmed through follow‐up. The median follow‐up times for LARC patients were 58.4 months in the FUSCC cohort and 31.4 months in the JSCC cohort. Detailed information can be found in Table 1; Table S1.
Rad‐score construction and validation
3.2
The Rad‐score matrix was derived from the gross tumor volume (GTV) calculated from CT images. Through the utilization of least absolute shrinkage and selection operator (LASSO) regression (Figure S3), the Rad‐score was constructed using seven selected radiomic features: “scaled_kurtosis,” “LL_GLCM_Maximal_Correlation_Coefficient,” “HL_GLCM_Sum_variance,” “LL_GLRMS_LRHGE,” “HH_GLRMS_LGRE,” “LH_absolute_median,” and “HL_absolute_median.” These features, listed in Table S4, capture the heterogeneity characteristics of malignant nodules, which represent more aggressive tumor variants with chaotic and disordered growth patterns.
Following the evaluation of the model, nodules were categorized into high‐risk and low‐risk groups based on an optimal cutoff value. Figure S4; Table S5 provide details about the distribution characteristics and cutoff values. The training and validation sets were constructed using data from CRC patients. In evaluating the model's performance in predicting lung metastasis, the areas under the curve (AUC) were 0.793 (95% CI: 0.729–0.856) for the Rad‐train set and 0.730 (95% CI: 0.666–0.874) for the Rad‐valid set, as illustrated in Figure 2.
Training and validation for malignant prediction. The radiomic model was established in cohorts of CRC patients in FUSCC, whose lung metastasis was confirmed by pathological examination. (A, B) represents the Rad‐score from CRC patients. For further validation in LARC patients, patients from FUSCC and JSCC were enrolled, and their lung nodules were extracted for radiomic prediction. (C, D) represent the Rad‐score and concordance in the training set and validation set of CRC patients from FUSCC, with the cut‐off value of 0.405 and 0.518, respectively. (E, F) represents the Rad‐score of LARC patients' lung nodules from FUSCC and JSCC. (G, H) represent the Rad‐score and concordance from LARC patients in FUSCC and JSCC separately, with the cut‐off value of 0.518 and 0.509, respectively. CRC colon and rectal cancer, FUSCC, Fudan University Shanghai Cancer Center; JSCC, JiangSu province Cancer Center; LARC, Locally Advanced Rectal Cancer.
Validation of the Rad‐score for lung metastasis distinction in LARC patients
3.3
In order to confirm the effectiveness of the Rad‐score in LARC patients, we conducted evaluations in two distinct cohorts: the LARC FUSCC cohort and the JSCC cohort. In the FUSCC cohort, the Rad‐score exhibited an AUC of 0.794 (95% CI: 0.737–0.851) for predicting lung metastasis, indicating a robust ability to differentiate between malignant and benign lung nodules. Similarly, in the JSCC cohort, the AUC for the Rad‐score prediction of lung metastasis was 0.747 (95% CI: 0.615–0.879). These results highlight the consistent and reliable performance of the Rad‐score in identifying malignant lung nodules in LARC patients. The features of the Rad‐score distribution are depicted in Figure 2, as well as in Table S5; Figure S4.
Prognostic value of the Rad‐score
3.4
The Rad‐score demonstrated a strong predictive ability for identifying LARC patients with poorer prognosis. KM analysis revealed a significant association between the Rad‐score and OS risk in both the FUSCC cohort (HR = 2.884, 95% CI: 1.523–5.459, p < 0.001) and JSCC cohort (HR = 3.341, 95% CI: 0.858–13.000, p = 0.010). Notably, patients with a low Rad‐score had longer OS compared to those with a high Rad‐score. More detailed information were presented in Figure 3C,F. Table 2 contains the C‐indices for the models, and additional details can be found in Table S8.
Survival analysis of ypTNM stage and Cli‐Rad‐score. (A) represents the nomogram for prognostic prediction, (B) represents the prognostic stratification from ypTNM stage in FUSCC, (C) represents the prognostic stratification from the Rad‐score in FUSCC, (D) represents the prognostic stratification from the Cli‐Rad‐score in FUSCC, (E) represents the prognostic stratification from ypTNM stage in JSCC, (F) represents the prognostic stratification from the Rad‐score in JSCC, (G) represents the prognostic stratification from the Cli‐Rad‐score in JSCC, (H) represents the incremental C‐index of the Cli‐Rad‐score compared to ypTNM stage in FUSCC, (I) represents the incremental C‐index of the Cli‐Rad‐score compared to ypTNM stage in JSCC.
Construction of a comprehensive clinical and radiomic model
3.5
Following the completion of both univariate and multivariate Cox regression analyses, it was determined that only ypTNM stage after neoadjuvant chemoradiation was independently associated with prognosis (p = 0.005). These results were listed in Tables S6, S7. A nomogram was developed for the Cli‐Rad‐score, incorporating ypTNM stage and Rad‐score, as depicted in Figure 3A. Due to the limited number and similar clinical prognosis of patients with ypTNM 0‐I, they were combined for further analysis.
A multivariate Cox analysis was performed to investigate whether ypTNM and Rad‐score are independent prognostic factors. The KM analysis demonstrated a remarkably significant disparity in OS between the high‐risk and low‐risk cohorts, as stratified by the ypTNM stage (hazard ratio [HR] = 2.497, 95% confidence interval [CI]: 1.365–4.569, p = 0.003) and Cli‐Rad‐score (HR = 3.544, 95% CI: 1.596–7.870, p < 0.001) in the FUSCC cohort. Additionally, in the JSCC cohort, the ypTNM stage (HR = 3.462, 95% CI: 1.211–9.899, p = 0.007) and Cli‐Rad‐score (HR = 4.751, 95% CI: 1.720–13.120, p = 0.003) also showed a significant difference in OS (Figure 3B–G; Table S8). Calibration curves for all prognostic models can be found in Figure S5 in the supplementary materials.
The results of this study reveal that incorporating the Rad‐score into the prognosis prediction for patients with pulmonary nodules leads to increased accuracy.
Incremental value of the radiomic signature
3.6
Subsequently, we conducted an analysis to assess the extent of the Rad‐score's enhanced predictive capacity by evaluating the Cli‐Rad‐score. Table 2 displays the C‐index values for ypTNM stage, Rad‐score, and Cli‐Rad‐score. The Cli‐Rad‐score demonstrated a higher C‐index than ypTNM stage alone or Rad‐score alone in both cohorts (FUSCC cohort: C‐index = 0.735, 95% CI: 0.668–0.802; JSCC cohort: C‐index = 0.618, 95% CI: 0.500–0.736; ypTNM stage alone: FUSCC cohort: C‐index = 0.695, 95% CI: 0.538–0.727; JSCC cohort: C‐index = 0.595, 95% CI: 0.472–0.718; Rad‐score alone: FUSCC cohort: C‐index = 0.633, 95% CI: 0.538–0.727; JSCC cohort: C‐index = 0.546, 95% CI: 0.412–0.680).
An evaluation of the Cli‐Rad‐score's performance at various time points was conducted by time‐related C‐indexs. The Cli‐Rad‐score consistently exhibited a higher C‐index for prognostic prediction at different time points (Figure 3H,I). Anova test results indicated that the Cli‐Rad‐score significantly outperformed ypTNM stage alone in prognostic prediction (FUSCC cohort: p = 0.015, JSCC cohort: p < 0.001). These findings indicated that the Cli‐Rad‐score performed more effectively in prognostic prediction than ypTNM stage alone.
DISCUSSION
4
This study introduces a CT‐based radiomics score for predicting lung nodule nature and assessing survival in LARC patients. The Rad‐score, comprised of seven radiomic features, achieved high accuracy in identifying malignant nodules (AUC = 0.794, 95%CI: 0.737–0.851). It also showed good prognostic prediction performance in both the internal and external cohorts. Compared to ypTNM stage alone, the Cli‐Rad‐score demonstrated improved prognostic capability in the internal (C‐index = 0.735, 95%CI: 0.668–0.802, p = 0.015) and external cohorts (C‐index = 0.618, 95%CI: 0.500–0.736, p < 0.001). Radiomics holds promise as a reliable tool for distinguishing lung nodule malignancy and predicting prognosis in LARC patients.
Despite advances in neoadjuvant radiochemotherapy, metastasis remains a significant challenge in LARC patients, particularly when it comes to lung metastasis.2, 16 The high incidence of lung metastasis in this population, coupled with the difficulty of distinguishing it from benign nodules, often results in delays in receiving appropriate treatment.3, 17, 18, 19 This presents a critical clinical challenge in accurately evaluating the nature of lung nodules in LARC patients.
The use of early local treatment such as surgery and radiotherapy, for lung metastasis in selective patients has been the focus of extensive research and attention.3, 20, 21, 22, 23, 24, 25, 26, 27, 28, 29 However, there is currently limited conclusive evidence regarding the identification of biomarkers for screening high‐risk patients with a poor prognosis.26, 30, 31 The application of radiomics in the assessment of pulmonary nodules can provide valuable clinical insights for the identification of high‐risk patients. CT‐based radiomics facilitates clinical decision‐making with rich information.29, 30 Ongoing research explores conventional and dynamic radiomic features to detect lung metastasis.14, 15, 31 However, more exploration is required to fully understand the value of radiomic scores in LARC patients.
Our study had several limitations. First, the classification of pulmonary nodules in patients with LARC was mainly based on follow‐up data rather than pathological verification. Second, there is a scarcity of detailed information on adjuvant therapy and subsequent chemotherapy because of information loss while receiving treatment at various centers. Third, despite the possibility of employing other modeling techniques for a more comprehensive analysis, LASSO performed satisfactorily in our study. Finally, the external cohort comprised a restricted number of patients, and the inclusion of multiple nodules in some individuals may have impacted the statistical analysis. Future research should endeavor to overcome these limitations by accumulating more data and validating our findings in larger cohorts. In conclusion, our study validated the Rad‐score as a noninvasive method for assessing lung nodules malignancy in LARC patients. Additionally, we developed and validated the Cli‐Rad‐score prognostic model by integrating the Rad‐score and ypTNM staging. This research provides the initial assessment of the Rad‐score in predicting malignant tumors and prognosis in patients with LARC, highlighting its significant potential clinical usefulness.
AUTHOR CONTRIBUTIONS
Zhiyuan Zhang: Conceptualization (lead); data curation (lead); formal analysis (lead); investigation (lead); methodology (lead); project administration (lead); resources (lead); software (equal); validation (equal); visualization (equal); writing – original draft (lead); writing – review and editing (lead). Jiazhou Wang: Data curation (lead); formal analysis (lead); funding acquisition (equal); investigation (equal); methodology (lead); resources (equal); software (lead); validation (lead); writing – review and editing (equal). Di Dai: Data curation (equal); investigation (equal); resources (equal); validation (lead). Fan Xia: Investigation (equal); resources (equal); supervision (equal); writing – review and editing (equal). Yiqun Sun: Data curation (equal); investigation (equal); methodology (equal); resources (equal); validation (equal); visualization (equal); writing – review and editing (equal). Guichao Li: Resources (equal). Juefeng Wan: Resources (equal). Lijun Shen: Funding acquisition (equal); resources (equal). Hui Zhang: Resources (equal). Yan Wang: Resources (equal). Jie Zhong: Resources (equal); writing – original draft (equal). Jun Bao: Conceptualization (lead); funding acquisition (lead); project administration (equal); resources (lead); visualization (equal); writing – original draft (equal); writing – review and editing (equal). Zhen Zhang: Conceptualization (lead); funding acquisition (lead); project administration (lead); resources (lead); supervision (lead); writing – review and editing (lead).
FUNDING INFORMATION
This work was supported in part by research grants from Shanghai Anticancer Association (HYXH2021096, Zhen Zhang). National Natural Science Foundation of China (82003229, Recipient: Zhen Zhang). The Science and Technology Commission of Shanghai Municipality (STCSM) (21Y21900200, Zhen Zhang). National Natural Science Foundation of China (82272732, Zhen Zhang); Beijing Xisike Clinical Oncology Research Foundation (Y‐Young2022‐0278, Zhiyuan Zhang); Shanghai Municipal Health Commission (20214Y0146, Lijun Shen).
CONFLICT OF INTEREST STATEMENT
The authors declare no potential conflicts of interest.
ETHICS STATEMENT
The Research was approved by the Institutional Review Boards of Fudan University Shanghai Cancer Center (2111246‐26) and JiangSu Province Cancer Center (2020科_059), and was conducted under the ethical standards of the 1964 Helsinki Declaration and its later amendments. The trial was approved by the local IRB and participants signed informed consent.
CODE AVAILABILITY
This radiomic processing software is developed using self‐made code in the R programming language. The relevant code can be referenced from the cited articles in the Methods section of the paper. The code underlying this article may be shared upon reasonable request to the corresponding author, following approval from the involved Research Institutions.
CONSENT FOR PUBLICATION
Written informed consent was obtained from the patient for publication.
CONSENT TO PARTICIPATE
Written informed consent was obtained from all patients in this study.
Supporting information
Data S1:
The reference list from the paper itself. Each links out to its DOI / PubMed record.
- 1Sung H , Ferlay J , Siegel RL , et al. Global cancer statistics 2020: GLOBOCAN estimates of incidence and mortality worldwide for 36 cancers in 185 countries. CA Cancer J Clin. 2021;71(3):209‐249.33538338 10.3322/caac.21660 · doi ↗ · pubmed ↗
- 2Riihimaki M , Hemminki A , Sundquist J , Hemminki K . Patterns of metastasis in colon and rectal cancer. Sci Rep. 2016;6:29765.27416752 10.1038/srep 29765 PMC 4945942 · doi ↗ · pubmed ↗
- 3Mitry E , Guiu B , Cosconea S , Jooste V , Faivre J , Bouvier A‐M . Epidemiology, management and prognosis of colorectal cancer with lung metastases: a 30‐year population‐based study. Gut. 2010;59(10):1383‐1388.20732912 10.1136/gut.2010.211557 · doi ↗ · pubmed ↗
- 4Di Nicolantonio F , Vitiello PP , Marsoni S , et al. Precision oncology in metastatic colorectal cancer—from biology to medicine. Nat Rev Clin Oncol. 2021;18(8):506‐525.33864051 10.1038/s 41571-021-00495-z · doi ↗ · pubmed ↗
- 5Chuang SC , Huang CW , Chen YT , et al. Effect of KRAS and NRAS mutations on the prognosis of patients with synchronous metastatic colorectal cancer presenting with liver‐only and lung‐only metastases. Oncol Lett. 2020;20(3):2119‐2130.32782529 10.3892/ol.2020.11795 PMC 7400335 · doi ↗ · pubmed ↗
- 6Cavallaro P , Bordeianou L , Stafford C , et al. Impact of single‐organ metastasis to the liver or lung and genetic mutation status on prognosis in stage IV colorectal cancer. Clin Colorectal Cancer. 2020;19(1):e 8‐e 17.31899147 10.1016/j.clcc.2019.12.001 · doi ↗ · pubmed ↗
- 7Gillies RJ , Kinahan PE , Hricak H . Radiomics: images are more than pictures, they are data. Radiology. 2016;278(2):563‐577.26579733 10.1148/radiol.2015151169 PMC 4734157 · doi ↗ · pubmed ↗
- 8Hu T , Wang S , Huang L , et al. A clinical‐radiomics nomogram for the preoperative prediction of lung metastasis in colorectal cancer patients with indeterminate pulmonary nodules. Eur Radiol. 2019;29(1):439‐449.29948074 10.1007/s 00330-018-5539-3 · doi ↗ · pubmed ↗