Consistency of information on the provision of water fluoridation in Brazil
Anna Laura Santos Doalto, Lorrayne Belotti, Camila de Moraes Paulino, Paulo Frazão

TL;DR
This study found inconsistencies in data about water fluoridation in Brazilian municipalities, highlighting the need for better data collection.
Contribution
The study identifies regional discrepancies in fluoridation data and emphasizes the importance of improving data reliability.
Findings
84% agreement between data sources, with a Kappa of 0.668 indicating substantial agreement.
An average discrepancy of 8.1 percentage points in fluoridation provision estimates.
The Northeast region showed the largest discrepancy of 21.4 percentage points.
Abstract
This study aimed to assess the consistency of data regarding the provision of fluoridation in Brazilian municipalities with water supply systems. Official data from the National Basic Sanitation Survey and the National Information System on Sanitation for 2017 were compared. Out of 5,570 municipalities in Brazil, 4,546 (81.6%) had water supply systems. The agreement between data sources was 84%, with a Kappa of 0.668, indicating substantial agreement. However, the estimates of fluoridation provision exhibited an average discrepancy of 8.1 percentage points, ranging from 1.2 points in the Central-West region to 21.4 points in the Northeast region. To address these inconsistencies, it is essential to enhance information sources, ensuring more reliable data for health, sanitation authorities, and society at large.
Click any figure to enlarge with its caption.
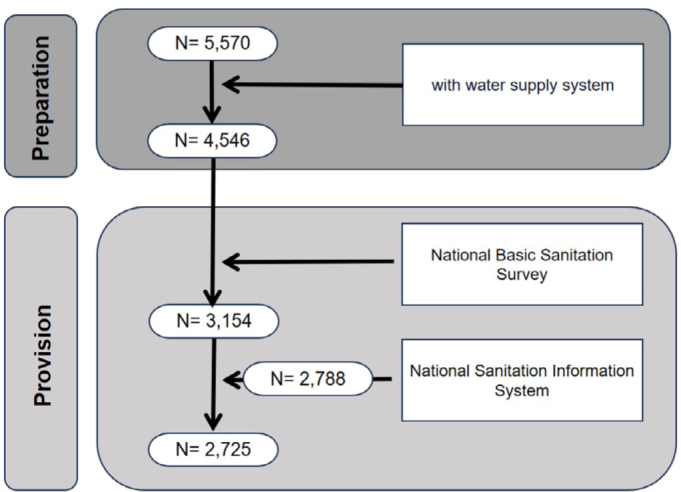 Figure 1
| Municipalities with WSS | Fluoridation coverage | Dif. pp. | PC | Kappa | LL | UL | Meaning | ||
|---|---|---|---|---|---|---|---|---|---|
| PNSB | SNIS | ||||||||
| Brasil | 4,546 | 69.4 | 61.3 | 8.1 | 84.1 | 0.668 | 0.648 | 0.689 | Substantial |
| North | 287 | 18.8 | 17.4 | 1.4 | 78.7 | 0.540 | 0.442 | 0.638 | Moderate |
| Northeast | 1,168 | 37.9 | 16.5 | 21.4 | 67.1 | 0.324 | 0.278 | 0.371 | Regular |
| Southeast | 1,616 | 88.3 | 84.8 | 3.5 | 92.6 | 0.692 | 0.646 | 0.738 | Substantial |
| South | 1,049 | 94.6 | 89.7 | 4.9 | 90.2 | 0.338 | 0.252 | 0.424 | Regular |
| Central-West | 426 | 55.9 | 54.7 | 1.2 | 86.6 | 0.751 | 0.696 | 0.806 | Substantial |
- —The study had no specific funding. Anna Laura Santos Doalto received a scientific initiation scholarship from CNPq and Paulo Frazão is a 1D researcher at CNPq. This work was carried out with the suppo
Peer Reviews
No public reviews on file for this paper yet. If you reviewed it on a platform where reviews are public (OpenReview, ICLR, NeurIPS, ICML), you can paste yours below so the community can read it here.
Videos
No videos yet. Explain this paper in a talk, walkthrough, or lecture? Add one.
Taxonomy
TopicsChild Nutrition and Water Access · Global Maternal and Child Health · Maternal and Neonatal Healthcare
INTRODUCTION
A thorough comprehension of population health and the evaluation of intersectoral health policies’ impact fundamentally rely on consistent data regarding health determinants. These determinants serve as the groundwork for formulating and executing public policies that affect the health status of communities, encompassing socioeconomic, environmental, behavioral factors, and access to health services^ 1 ^.
One of these determinants encompasses the provision of treated and fluoridated water, which is a public health strategy known to effectively prevent and reduce tooth decay. However, its efficacy is intricately tied to monitoring the quality of drinking water concerning the fluoride parameter and relies on accurate information regarding its supply. Ensuring the effectiveness of its provision is a pivotal step in promoting oral health on a population level and mitigating inequalities in access to dental care^ 2 ^. This is particularly critical in Brazil, where public spending on oral health has been limited to 0.07% of gross domestic product (GDP)^ 3 ^, whereas in some European countries with similar economies, it has reached 0.12% of GDP^ 4 ^.
The objective was to assess the consistency of information regarding fluoridation coverage in Brazilian municipalities with water supply systems in 2017, based on two official sources of information.
METHODS
Descriptive study utilizing openly available official data from the year 2017 sourced from the following:
- National Basic Sanitation Survey (*Pesquisa Nacional de Saneamento Básico –*PNSB)^ 5 ^: An initiative led by the Brazilian Institute of Geography and Statistics (Instituto Brasileiro de Geografia e Estatística – IBGE) aimed at gathering data from entities responsible for water supply and sewage services across Brazilian municipalities. This survey encompasses registration and operational details concerning water capture, collection, treatment, distribution, and billing. PNSB facilitates assessments of service provision and quality, as well as analysis of environmental conditions, directly impacting population health and quality of life.
- National Sanitation Information System (Sistema Nacional de Informações sobre Saneamento – SNIS)^ 6 ^: A database administered by the Sanitation Secretariat, under the Ministry of Regional Development in 2017. It is designed to compile institutional, administrative, operational, managerial, economic-financial, accounting, and quality-related information regarding the provision of water, sewage, and urban solid waste management services. The platform serves as a reference for comparing and assessing service performance. Data is collected annually from service providers or municipal bodies responsible for managing these services. The database is publicly accessible free of charge through a dedicated electronic platform.
Initially, the study encompassed all 5,570 Brazilian municipalities. Subsequently, municipalities with water supply systems (WSS) were categorized based on the provision of fluoridation. They were classified into three distinct categories: “yes,” indicating the provision of fluoridation; “no,” indicating its absence; and “no information,” for cases where data was unavailable.
Data analysis entailed processing records using the municipal code and summarizing the proportion of municipalities ensuring the provision of public policy according to each data source. The difference in coverage of the strategy provision (in percentage points) was then calculated for the country and each geographic region. To assess the agreement between the data sources from PNSB and SNIS, a percentage agreement was utilized, ranging from 0 to 100%, and the Kappa statistic, varying from 0.0 to 1.0, alongside corresponding intervals of 95% confidence. The values were interpreted based on the following criteria: 0.01 to 0.20 for slight agreement, 0.21 to 0.40 for fair agreement, 0.41 to 0.60 for moderate agreement, 0.61 to 0.80 for substantial agreement, and 0.81 to 1.0 for almost perfect agreement.
RESULTS
Of the 5,570 Brazilian municipalities, 4,546 had WSS. In Figure 1, the data flow illustrates the cross-referencing of information from both sources. According to data from the PNSB, water fluoridation was provided in 69.4% (3,154) of municipalities with WSS, while, according to SNIS, 61.3% (2,788) received the benefit, reflecting a discrepancy of 8.1 percentage points (Table 1), with significant variation between Brazilian geographic regions (1.2 pp. for the Central-West to 21.4 pp. for the Northeast). The percentage agreement was 84.1%, with lower values in the North (78.7%) and Northeast (67.1%) regions. The Kappa statistic was 0.668 (95% CI: 0.648-0.689), indicating substantial agreement. This value was lower than 0.61 in the North, Northeast, and South regions.
Data flow in information sources.
DISCUSSION
The consistency of information regarding the provision of water fluoridation in supply systems was substantial nationwide. However, lower percentage agreement was observed in the North and Northeast regions. Additionally, the difference in strategy coverage between information sources exceeded 20 percentage points in the Northeast region. Both sources relied on declarations from water supply service providers, making it impractical to adopt one as a reference over the other. The findings underscore the necessity of supplementing provider declarations with additional data and highlight significant opportunities for enhancing information regarding the provision of this strategy and intersectoral management of public policy.
The percent agreement metric indicates total agreement irrespective of chance, with the North and Northeast regions displaying lower values compared to the national average. Conversely, the Kappa statistic gauges agreement beyond chance, influenced by the asymmetry in agreement and disagreement between information sources. Therefore, the value obtained for the South region should not be a cause for concern given that 922 municipalities of the 1,049 with WSS belonging to the region were provided by public policy, according to both sources of information. Likewise, the higher Kappa statistic values observed for the Central-West region warrant scrutiny, considering that 225 out of 426 municipalities with WSS in the region received the benefit according to the compared sources. While the symmetry of values in this region tends to align the Kappa statistic closer to the percent agreement value, asymmetry may lead to discrepancies^ 7 ^.
Studies assessing information consistency benefit from a diverse array of available data. However, a significant limitation arises from the absence of direct water sample collection data from the distribution networks of WSS in the North, Northeast, and Central-West regions. Respectively, only 1.0, 13.9, and 9.6% of municipalities in these regions had health surveillance records on fluoride concentration in WSS^ 8 ^. The availability of such records would facilitate comparison with the self-declared data provided by both information sources.
The study concludes that while there is substantial consistency of information on water supply system fluoridation at the national level, there is an 8.1 percentage point discrepancy at the municipal level, with inconsistencies exceeding 20 percentage points in the Northeast region. These findings underscore the imperative to enhance information regarding public policy strategy and management. The seemingly straightforward measurement process poses a significant challenge for sanitation authorities, particularly in the Northeast region, where water resources are limited, and control procedures for water supply systems must maintain rigorous precision akin to other regions.
The reference list from the paper itself. Each links out to its DOI / PubMed record.
- 11. Glouberman S, Millar J. Evolution of the determinants of health, health policy, and health information systems in Canada. Am J Public Health 2003; 93(3): 388-92. https://doi:10.2105/ajph.93.3.38810.2105/ajph.93.3.388PMC 144774912604478 · doi ↗ · pubmed ↗
- 2Guarnizo-Herreño CC Frazão P Narvai PC Epidemiology, politics, and dental public health Peres MA Antunes JLF Watt RG Oral epidemiology. Textbooks in contemporary dentistry Edinburgh Springer 20214193610.1007/978-3-030-50123-5_28 · doi ↗
- 3Brasil Ministério da Saúde. Contas do SUS na perspectiva da contabilidade internacional: Brasil, 2010–2014 Brasília Ministério da Saúde 2018
- 44. Winkelmann J, van Ginneken E, Gomez Rossi J. Oral health care in Europe: financing, access, and provision. Eur J Public Health 2022;32(Supplement_3):ckac 129-372. https://doi.org/10.1093/eurpub/ckac 129.37235833482 · pubmed ↗
- 55. Instituto Brasileiro de Geografia e Estatística. Pesquisa Nacional de Saneamento Básico. Principais resultados [Internet]. 2017 [cited on Nov 8, 2022]. Available at: https://www.ibge.gov.br/estatisticas/multidominio/meio-ambiente/9073-pesquisa-nacional-de-saneamento-basico.html
- 66. Brasil. Ministério do Desenvolvimento Regional. Sistema Nacional de Informação sobre Saneamento (SNIS) [Internet]. 2017. [cited on Dec 13, 2022]. Available at: https://basedosdados.org/dataset/2a 543ad 8-3cdb-4047-9498-efe 7fb 8ed 697?table=df 7cf 198-4889-4baf-bb 77-4e 0e 28eb 90ca&utm_term=&utm_campaign=Conjuntos+de+dados+-+Gratuito&utm_source=adwords&utm_medium=ppc&hsa_acc=9488864076&hsa_cam=20482085189&hsa_grp=153440173817&hsa_ad=687132798620&hsa_src=g&hsa_tgt=dsa-2260403512265&hsa_kw=&hsa_mt=&hsa_n
- 77. Cicchetti DV, Feinstein AR. High agreement but low kappa: II. Resolving the paradoxes. J Clin Epidemiol. 1990;43(6):551-8. https://doi.org/10.1016/0895-4356(90)90159-m 10.1016/0895-4356(90)90159-m 2189948 · doi ↗ · pubmed ↗
- 8Paulino CM Belotti L Frazão P Cobertura da informação e da conformidade do fluoreto na água de abastecimento: diferenciais demográficos e socioeconômicos dos municípios brasileiros Vigil Sanit Debate 202311 e 0214910.22239/2317-269x.02149 · doi ↗