Development and validation of a predictive model for severe white matter hyperintensity with obesity
Fu Chen, Lin-hao Cao, Fei-yue Ma, Li-li Zeng, Ji-rong He

TL;DR
This study developed a model to predict severe white matter hyperintensity in obese individuals without using MRI, using factors like hypertension and uric acid.
Contribution
A novel prediction model and nomogram for identifying severe white matter hyperintensity in obesity without MRI.
Findings
The model achieved an AUC of 0.823 with 60% sensitivity and 91.4% specificity.
Calibration curves showed good fit between observed and predicted probabilities in both training and validation groups.
The nomogram demonstrated strong clinical utility for early detection of SWO.
Abstract
The purpose of the present study was to identify predictors of severe white matter hyperintensity (WMH) with obesity (SWO), and to build a prediction model for screening obese people with severe WMH without Nuclear Magnetic Resonance Imaging (MRI) examination. From September 2020 to October 2021, 650 patients with WMH were recruited consecutively. The subjects were divided into two groups, SWO group and non-SWO group. Univariate and Logistic regression analysis were was applied to explore the potential predictors of SWO. The Youden index method was adopted to determine the best cut-off value in the establishment of the prediction model of SWO. Each parameter had two options, low and high. The score table of the prediction model and nomogram based on the logistic regression were constructed. Of the 650 subjects, 487 subjects (75%) were randomly assigned to the training group and 163…
Genes, proteins, chemicals, diseases, species, mutations and cell lines named across the full text — each resolved to its canonical identifier and authoritative record.
Click any figure to enlarge with its caption.
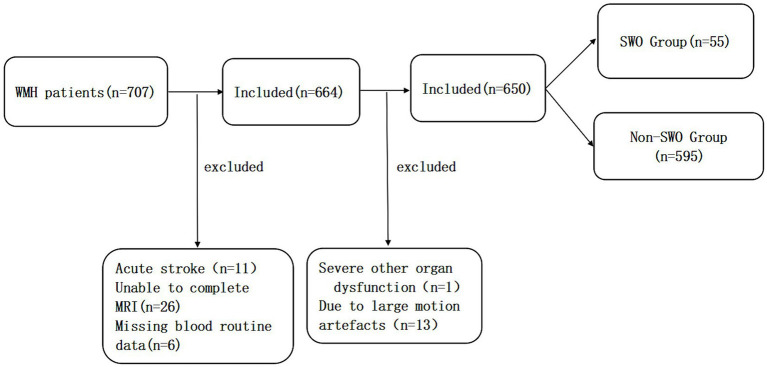 Figure 1
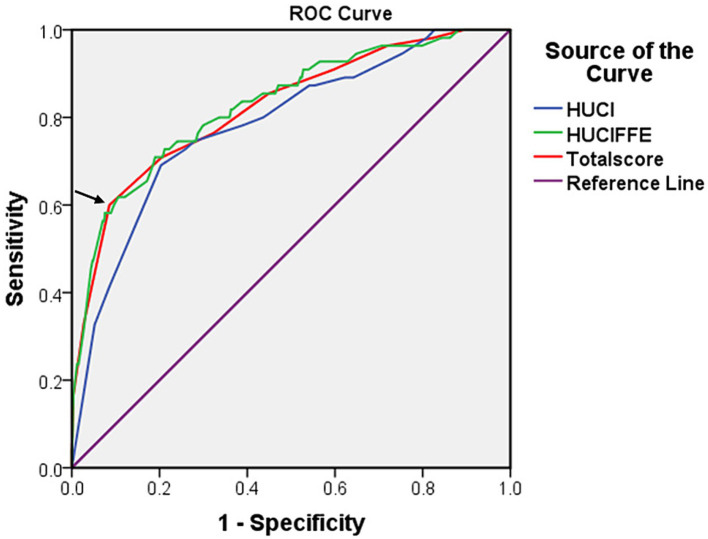 Figure 2
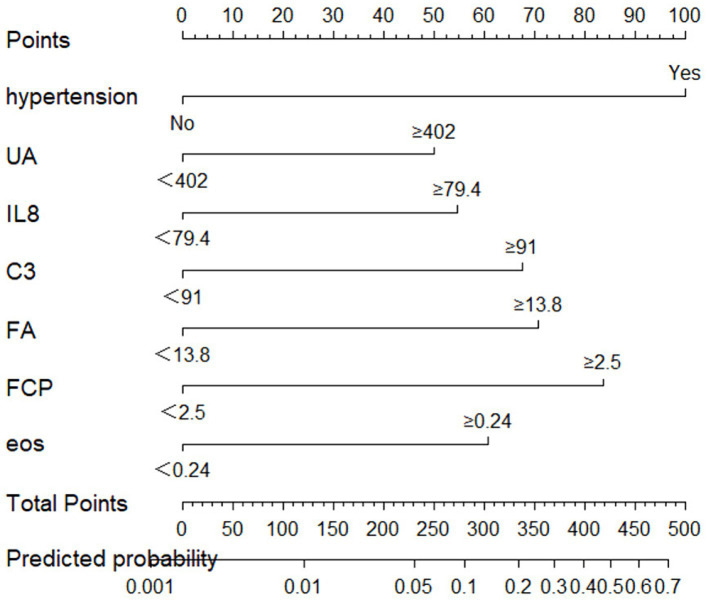 Figure 3
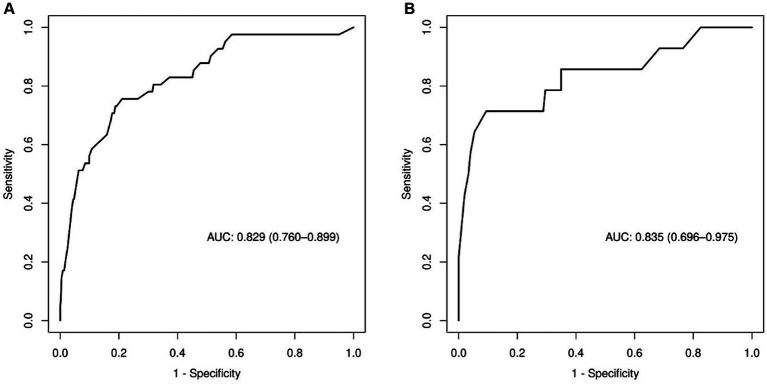 Figure 4
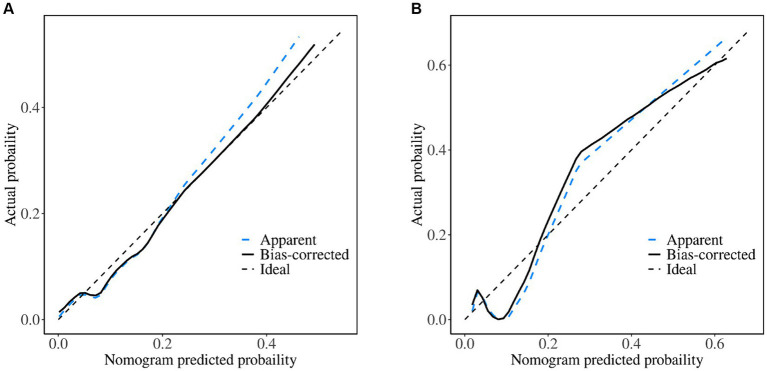 Figure 5
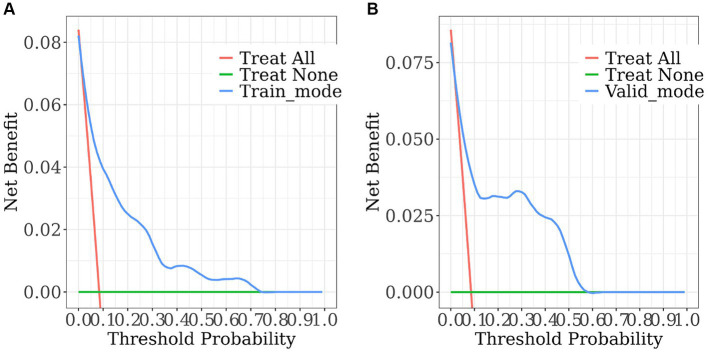 Figure 6
| Variables | Total | SWO Group ( | Non-SWO Group ( | ||
|---|---|---|---|---|---|
| Age (year) | 67.1 ± 11.5 | 64.1 ± 12.6 | 67.5 ± 11.4 | 0.668 | |
| Sex ( | 0.349 | ||||
| Male | 399 (61.4%) | 37 (63.7%) | 362 (60.8%) | ||
| Female | 251 (38.6%) | 18 (32.7%) | 233 (39.2%) | ||
| Hypertension | 426 (65.5%) | 50 (90.9%) | 376 (63.2%) | < 0.001* | |
| Diabetes | 203 (31.2%) | 20 (36.4%) | 183 (30.8%) | 0.391 | |
| Hyperlipidemia | 227 (34.9%) | 24 (43.6%) | 203 (34.1%) | 0.157 | |
| Cardiac disease | 89 (13.7%) | 10 (18.2%) | 79 (13.3%) | 0.311 | |
| Previous strokes | 209 (32.2%) | 19 (34.5%) | 190 (31.9%) | 0.691 | |
| Smoking | 123 (18.9%) | 8 (14.5%) | 115 (19.3%) | 0.386 | |
| WBC (10^9/L) | 6.5 ± 1.9 | 6.5 ± 1.7 | 6.5 ± 2.0 | 0.016* | |
| Neutrophil (10^9/L) | 4.0 ± 1.5 | 4.0 ± 1.3 | 4.0 ± 1.6 | 0.656 | |
| Lymphocyte (10^9/L) | 1.8 ± 0.7 | 1.8 ± 0.7 | 1.8 ± 0.7 | 0.295 | |
| Monocyte (10^9/L) | 0.5 ± 0.1 | 0.5 ± 0.1 | 0.5 ± 0.1 | 0.297 | |
| Basophil (10^9/L) | 0.2 (0.1, 0.3) | 0.2 (0.1, 0.4) | 0.2 (0.1, 0.3) | 0.068 | |
| Eosinophil (10^9/L) | 0.1 (0.1, 0.2) | 0.2 (0.1, 0.3) | 0.2 (0.1, 0.2) | 0.021* | |
| ALT (IU/L) | 17.0 (12.0, 24.0) | 18.0 (13.0, 29.8) | 17.0 (12.0, 24.0) | 0.206 | |
| AST (IU/L) | 20.0 (16.0, 24.0) | 19.0 (16.0, 23.0) | 20.0 (16.0, 24.0) | 0.579 | |
| Albumin (g/L) | 37.8 ± 3.4 | 39.3 ± 3.3 | 37.6 ± 3.4 | 0.216 | |
| BUN (mmol/L) | 5.8 ± 1.6 | 5.6 ± 1.5 | 5.9 ± 1.6 | 0.580 | |
| Cr (umol/L) | 80.0 ± 21.9 | 79.3 ± 16.8 | 80.2 ± 22.4 | 0.080 | |
| UA (umol/L) | 360.1 ± 96.7 | 393.1 ± 114.9 | 357.5 ± 94.1 | 0.005* | |
| Complement (U/mL) | 49.8 ± 11.1 | 49.3 ± 12.4 | 49.8 ± 11.1 | 0.194 | |
| TC (mmol/L) | 4.3 ± 1.0 | 4.1 ± 1.1 | 4.3 ± 1.0 | 0.745 | |
| TG (mmol/L) | 1.4 ± 0.9 | 1.7 ± 0.9 | 1.4 ± 0.9 | 0.334 | |
| HDL (mmol/L) | 1.1(0.9, 1.3) | 1.1(0.9, 1.2) | 1.1(0.9, 1.3) | 0.648 | |
| LDL (mmol/L) | 2.7 ± 0.8 | 2.6 ± 0.8 | 2.8 ± 0.8 | 0.410 | |
| Free IL-2 (pg/mL) | 563.8 ± 222.4 | 559.9 ± 269.1 | 561.9 ± 216.7 | 0.285 | |
| IL-β (pg/mL) | 3.9 (2.2, 4.7) | 3.8 (2.8, 4.9) | 3.7 (2.2, 4.7) | 0.919 | |
| TNF-α (pg/mL) | 21.9 ± 12.8 | 25.7 ± 13.5 | 21.4 ± 12.7 | 0.500 | |
| IL-10 (pg/mL) | 2.6 (2.0, 3.4) | 2.8 (2.0, 3.4) | 2.6 (2.0, 3.4) | 0.525 | |
| IL-8 (pg/mL) | 73.4 (40.4, 155.5) | 112.0 (47.8, 237.5) | 71.8 (39.4, 148.3) | 0.051 | |
| IL-6 (pg/mL) | 3.7 (1.7, 5.8) | 3.2 (1.1, 5.5) | 3.4 (1.7, 5.8) | 0.854 | |
| FA (ng/mL) | 8.7 ± 5.0 | 8.0 ± 3.7 | 8.8 ± 5.1 | 0.056 | |
| VitB12 (pg/mL) | 307.0 (219.0, 465.5) | 300.5 (203.8, 484.0) | 299.5 (219.0, 464.0) | 0.341 | |
| HbA1c (%) | 5.9 (5.6, 6.7) | 6.2 (5.8, 7.1) | 5.9 (5.6, 6.7) | 0.136 | |
| IgA (mg/dL) | 362.6 ± 117.1 | 262.8 ± 96.1 | 262.8 ± 119.7 | 0.805 | |
| IgG (mg/dL) | 1171.9 ± 291.6 | 1161.6 ± 307.2 | 1171.6 ± 291.5 | 0.215 | |
| IgM (mg/dL) | 80.5 (58.0, 108.8) | 78.5 (62.8, 158.5) | 79.0 (57.3, 108.0) | 0.259 | |
| CRP (mg/dL) | 0.2 (0.2, 0.5) | 0.3 (0.2, 0.6) | 0.2 (0.1, 0.5) | 0.127 | |
| C3 (mg/dL) | 88.0 ± 17.3 | 96.6 ± 14.7 | 87.1 ± 17.4 | <0.001* | |
| C4 (mg/dL) | 21.7 ± 6.6 | 23.3 ± 5.8 | 21.6 ± 6.7 | 0.007* | |
| 25OH-VitD(nmol/L) | 51.9 ± 23.1 | 48.2 ± 19.5 | 50.6 ± 21.7 | 0.519 | |
| FBG (mg/dL) | 5.8 ± 2.1 | 5.4 ± 1.1 | 5.9 ± 2.1 | 0.792 | |
| 2hPBG (mg/dL) | 9.8 ± 3.2 | 10.2 ± 3.2 | 9.7 ± 3.5 | 0.214 | |
| FCP (mg/mL) | 2.8 ± 1.3 | 3.4 ± 1.0 | 2.6 ± 1.3 | <0.001* | |
| 2hPCP (ng/mL) | 8.3 (5.6, 12.2) | 10.1 (7.0, 12.9) | 8.1 (5.4, 12.0) | 0.270 | |
| B | S.E. | Wald | Sig. | Exp (B) | 95% C.I. | |
|---|---|---|---|---|---|---|
| Hypertension | 1.566 | 0.485 | 10.425 | 0.001 | 4.785 | 1.850–12.377 |
| IL-8 | 0.859 | 0.332 | 6.698 | 0.010 | 2.360 | 1.232–4.521 |
| UA | 0.906 | 0.299 | 9.156 | 0.002 | 2.474 | 1.376–4.448 |
| C3 | 1.394 | 0.355 | 15.426 | 0.000 | 4.031 | 2.010–8.081 |
| Constant | −6.817 | 0.816 | 69.739 | 0.000 | 0.001 |
| Variables | Obesity group (BMI ≥ 28 kg/m2) | Non-obesity group (BMI < 28 kg/m2) | |
|---|---|---|---|
| Age | 64.1 ± 11.2 | 67.8 ± 11.4 | 0.161 |
| Hypertension | 93 (87.7%) | 333 (61.2%) | <0.001* |
| Diabetes | 41 (38.7%) | 162 (29.8%) | 0.070 |
| Hyperlipidemia | 45 (42.5%) | 182 (33.5%) | 0.075 |
| Cardiac disease | 15 (14.2%) | 74 (13.6%) | 0.881 |
| Previous strokes | 34 (32.1%) | 175 (32.2%) | 0.985 |
| Smoking | 18 (17.0%) | 105 (19.3%) | 0.577 |
| WBC (10^9/L) | 6.1 ± 1.7 | 6.6 ± 2.0 | 0.141 |
| Neutrophil (10^9/L) | 3.7 ± 1.2 | 4.1 ± 1.6 | 0.975 |
| Lymphocyte(10^9/L) | 1.8 ± 0.7 | 1.9 ± 0.7 | 0.278 |
| Monocyte (10^9/L) | 0.4 ± 0.1 | 0.5 ± 0.1 | 0.419 |
| Basophil (10^9/L) | 0.2 (0.1, 0.3) | 0.2 (0.1, 0.2) | 0.221 |
| Eosinophil (10^9/L) | 0.1 (0.1, 0.3) | 0.1 (0.1, 0.2) | 0.518 |
| ALT (IU/L) | 19.0 (13.0, 31.0) | 17.0 (12.0, 23.0) | 0.063 |
| AST (IU/L) | 19.0 (16.0, 25.0) | 20 (16.0, 23.0) | 0.780 |
| Albumin (g/L) | 39.6 ± 3.1 | 37.5 ± 3.4 | 0.007* |
| BUN (mmol/L) | 5.7 ± 1.5 | 5.9 ± 1.6 | 0.782 |
| Cr (umol/L) | 78.0 ± 14.2 | 80.4 ± 23.1 | 0.303 |
| UA (umol/L) | 385.0 ± 101.3 | 355.3 ± 95.4 | 0.002* |
| Complement (U/mL) | 50.2 ± 10.7 | 49.7 ± 11.3 | 0.191 |
| TC (mmol/L) | 4.0 ± 1.1 | 4.3 ± 1.0 | 0.490 |
| TG (mmol/L) | 1.6 ± 0.7 | 1.4 ± 0.9 | 0.187 |
| HDL (mmol/L) | 1.0 (0.9, 1.1) | 1.1 (0.9, 1.3) | 0.525 |
| LDL (mmol/L) | 2.6 ± 0.8 | 2.8 ± 0.8 | 0.980 |
| Free IL-2 (pg/mL) | 559.9 ± 251.7 | 564.6 ± 217.3 | 0.497 |
| IL-β (pg/mL) | 3.8 (3.0, 4.7) | 3.7 (2.2, 4.7) | 0.857 |
| TNF-α (pg/mL) | 23.6 ± 14.3 | 21.6 ± 12.5 | 0.542 |
| IL-10 (pg/mL) | 2.7 (2.1, 3.3) | 2.6 (2.0, 3.5) | 0.996 |
| IL-8 (pg/mL) | 101.0 (47.1, 233.0) | 71.6 (39.0, 146.0) | 0.218 |
| IL-6 (pg/mL) | 3.3 (1.3, 5.6) | 3.4 (1.7, 5.8) | 0.755 |
| FA (ng/mL) | 8.1 ± 4.4 | 8.9 ± 5.1 | 0.024* |
| VitB12 (pg/mL) | 299.0 (230.0, 445.0) | 300.0 (215.5, 467.5) | 0.825 |
| HbA1c (%) | 6.2 (5.8, 6.9) | 5.9 (5.6, 6.7) | 0.133 |
| IgA (mg/dL) | 268.7 ± 117.4 | 261.4 ± 117.4 | 0.329 |
| IgG (mg/dL) | 1153.2 ± 285.4 | 1175.4 ± 293.6 | 0.336 |
| IgM (mg/dL) | 72.0 (53.0, 110.0) | 80.0 (59.5, 108.5) | 0.955 |
| CRP (mg/dL) | 0.3 (0.2, 0.4) | 0.2 (0.1, 0.5) | 0.533 |
| C3 (mg/dL) | 95.0 ± 12.8 | 86.7 ± 17.8 | <0.001* |
| C4 (mg/dL) | 23.1 ± 5.9 | 21.5 ± 6.7 | 0.082 |
| 25OH-VitD(nmol/L) | 49.7 ± 21.2 | 52.3 ± 23.5 | 0.349 |
| FBG (mg/dL) | 5.5 ± 1.2 | 5.9 ± 2.2 | 0.703 |
| 2hPBG (mg/dL) | 10.8 ± 3.3 | 9.7 ± 3.1 | 0.039* |
| FCP (mg/mL) | 3.4 ± 1.0 | 2.6 ± 1.3 | <0.001* |
| 2hPCP (ng/mL) | 9.9 (5.8, 12.9) | 8.1 (5.5, 11.9) | 0.708 |
| B | S.E. | Wald | Sig. | Exp (B) | 95% C.I. | |
|---|---|---|---|---|---|---|
| Hypertension | 1.984 | 0.757 | 6.875 | 0.009 | 7.272 | 1.650–32.044 |
| Albumin | 0.137 | 0.061 | 5.066 | 0.024 | 1.147 | 1.018–1.293 |
| FCP | 0.367 | 0.155 | 5.629 | 0.018 | 1.443 | 1.066–1.955 |
| Constant | −9.684 | 2.574 | 14.159 | 0.000 | 0.000 |
| Variables | Severe WMH group (Fazekas = 4,5,6) | Non-severe WMH group (Fazekas = 0,1,2,3) | |
|---|---|---|---|
| Age | 70.7 ± 10.3 | 63.8 ± 11.6 | <0.001* |
| Hypertension | 222 (76.8%) | 204 (56.5%) | <0.001* |
| Diabetes | 99 (34.3%) | 104 (28.8%) | 0.136 |
| Hyperlipidemia | 96 (33.2%) | 131 (36.3%) | 0.415 |
| Cardiac disease | 42 (14.5%) | 47 (13.0%) | 0.577 |
| Previous strokes | 110 (38.1%) | 99 (27.4%) | 0.004* |
| Smoking | 58 (20.1%) | 65 (18.0%) | 0.504 |
| WBC (10^9/L) | 6.5 ± 1.9 | 6.5 ± 2.0 | 0.007* |
| Neutrophil (10^9/L) | 4.0 ± 1.4 | 4.0 ± 1.6 | 0.026* |
| Lymphocyte(10^9/L) | 1.8 ± 0.7 | 1.9 ± 0.6 | 0.188 |
| Monocyte (10^9/L) | 0.5 ± 0.1 | 0.4 ± 0.2 | <0.001* |
| Basophil (10^9/L) | 0.2 ± 0.1 | 0.2 ± 0.1 | 0.541 |
| Eosinophil (10^9/L) | 0.2 ± 0.1 | 0.2 ± 0.1 | 0.048* |
| ALT (IU/L) | 16.0 (12.0, 23.0) | 18.0 (13.0, 25.0) | 0.792 |
| AST (IU/L) | 19.0 (16.0, 23.0) | 20.0 (16.0, 24.0) | 0.207 |
| Albumin (g/L) | 37.4 ± 3.5 | 38.3 ± 3.4 | 0.001* |
| BUN (mmol/L) | 6.0 ± 1.6 | 5.6 ± 1.6 | 0.001* |
| Cr (umol/L) | 83.3 ± 23.3 | 76.9 ± 20.1 | 0.001* |
| UA (umol/L) | 368.9 ± 94.5 | 351.6 ± 98.6 | 0.122 |
| Complement (U/mL) | 49.0 ± 12.1 | 50.4 ± 10.1 | 0.390 |
| TC (mmol/L) | 4.2 ± 1.0 | 4.4 ± 1.1 | 0.953 |
| TG (mmol/L) | 1.4 ± 0.7 | 1.5 ± 1.0 | 0.226 |
| HDL (mmol/L) | 1.1 (0.9, 1.3) | 1.0 (0.9, 1.3) | 0.253 |
| LDL (mmol/L) | 2.7 ± 0.8 | 2.8 ± 0.8 | 0.890 |
| Free IL-2 (pg/mL) | 580.6 ± 244.7 | 547.6 ± 198.6 | 0.001* |
| IL-β (pg/mL) | 3.6 (2.1, 4.8) | 3.7 (2.6, 4.5) | 0.476 |
| TNF-α (pg/mL) | 23.7 ± 12.7 | 20.2 ± 12.7 | 0.070 |
| IL-10 (pg/mL) | 2.5 (2.0, 3.4) | 2.6 (2.0, 3.5) | 0.629 |
| IL-8 (pg/mL) | 85.9 (52.178) | 62.4 (27.4, 141.3) | 0.648 |
| IL-6 (pg/mL) | 3.7 (1.6, 6.7) | 3.2 (1.7, 5.3) | 0.612 |
| FA (ng/mL) | 8.7 ± 4.7 | 8.7 ± 5.3 | 0.067 |
| VitB12 (pg/mL) | 295.0 (196.8, 484.0) | 304.0 (231.0, 464.5) | 0.315 |
| HbA1c (%) | 5.9 (5.7, 6.6) | 5.9 (5.6, 6.8) | 0.346 |
| IgA (mg/dL) | 272.2 ± 123.3 | 253.3 ± 110.7 | 0.004* |
| IgG (mg/dL) | 1171.1 ± 282.1 | 1172.6 ± 302.1 | 0.007* |
| IgM (mg/dL) | 79.0 (56.5, 111.3) | 80.0 (58.0, 108.0) | 0.430 |
| CRP (mg/dL) | 0.3 (0.2, 0.5) | 0.2 (0.1, 0.4) | 0.015* |
| C3 (mg/dL) | 86.9 ± 17.3 | 89.2 ± 17.4 | 0.934 |
| C4 (mg/dL) | 22.0 ± 7.1 | 21.4 ± 6.2 | 0.005* |
| 25OH-VitD (nmol/L) | 51.1 ± 23.0 | 52.7 ± 23.3 | 0.511 |
| FBG (mg/dL) | 5.6 ± 1.6 | 6.1 ± 2.4 | 0.284 |
| 2hPBG (mg/dL) | 9.7 ± 2.9 | 10.0 ± 3.4 | 0.522 |
| FCP (mg/mL) | 2.8 ± 1.1 | 2.7 ± 1.4 | 0.857 |
| 2hPCP (ng/mL) | 8.5 (6.1, 12.2) | 8.1 (5.0, 12.3) | 0.210 |
| B | S.E. | Wald | Sig. | Exp (B) | 95% C.I. | |
|---|---|---|---|---|---|---|
| Age | 0.056 | 0.016 | 12.831 | 0.000 | 1.058 | 1.026–1.091 |
| Hypertension | 1.007 | 0.340 | 8.756 | 0.003 | 2.738 | 1.405–5.335 |
| Constant | −4.618 | 1.110 | 17.324 | 0.000 | 0.010 |
| AUC |
| Upper | Lower | Cutoff value | Sensitivity | Specificity | |
|---|---|---|---|---|---|---|---|
| UA(umol/L) | 0.622 | 0.003 | 0.538 | 0.707 | 402 | 0.509 | 0.741 |
| IL8(pg/mL) | 0.623 | 0.003 | 0.548 | 0.698 | 79.4 | 0.731 | 0.511 |
| C3(mg/dL) | 0.682 | <0.001 | 0.613 | 0.751 | 91 | 0.800 | 0.520 |
| C4(mg/dL) | 0.603 | 0.011 | 0.520 | 0.686 | 26 | 0.491 | 0.741 |
| FA(ng/mL) | 0.562 | 0.130 | 0.479 | 0.645 | 13.8 | 0.327 | 0.836 |
| Eosinophil(10^9/L) | 0.638 | 0.001 | 0.564 | 0.713 | 0.24 | 0.400 | 0.807 |
| FCP(mg/mL) | 0.691 | <0.001 | 0.623 | 0.760 | 2.5 | 0.836 | 0.530 |
| WBC(10^9/L) | 0.585 | 0.037 | 0.506 | 0.664 | 6.51 | 0.564 | 0.618 |
| B | S.E. | Z | Sig. | Exp (B) | 95% C.I. | |
|---|---|---|---|---|---|---|
| Hypertension | 1.65 | 0.54 | 3.09 | 0.002 | 5.23 | 1.83 ~ 14.93 |
| IL-8 | 0.86 | 0.36 | 2.43 | 0.015 | 2.37 | 1.18 ~ 4.77 |
| C3 | 1.37 | 0.39 | 3.51 | <0.001 | 3.92 | 1.83 ~ 8.41 |
| UA | 0.92 | 0.33 | 2.78 | 0.005 | 2.52 | 1.31 ~ 4.82 |
| FCP | 1.89 | 0.45 | 4.18 | <0.001 | 6.61 | 2.73 ~ 16.04 |
| FA | 0.83 | 0.36 | 2.32 | 0.020 | 2.30 | 1.14 ~ 4.64 |
| Eosinophil | 1.00 | 0.34 | 2.92 | 0.003 | 2.72 | 1.39 ~ 5.31 |
| Item | Classification | Cutoff | Points |
|---|---|---|---|
| Hypertension | Yes | 3 | |
| IL-8 (pg/mL) | High | ≥79.4 | 1 |
| C3 (mg/dL) | High | ≥91 | 2 |
| UA (umol/L) | High | ≥402 | 1 |
| FA (ng/mL) | High | ≥13.8 | 2 |
| FCP (mg/mL) | High | ≥2.5 | 2 |
| Eosinophil (10^9/L) | High | ≥0.24 | 1 |
| Total score | High | ≥9 |
Peer Reviews
No public reviews on file for this paper yet. If you reviewed it on a platform where reviews are public (OpenReview, ICLR, NeurIPS, ICML), you can paste yours below so the community can read it here.
Videos
No videos yet. Explain this paper in a talk, walkthrough, or lecture? Add one.
Taxonomy
TopicsLinguistics and language evolution · Medieval Literature and History
Introduction
1
White matter hyperintensity (WMH), also known as leukoaraiosis or white matter lesions, is structural alteration to the brain that affects the white matter tracts specializing in higher brain activities. It is characterized by destruction to the myelin sheaths of central nerve cells. On imaging, the lesion presents as speckled or patchy changes in the periventricular or subcortical white matter, with high signal changed on MRI-T2-weighted images and fluid-attenuated inversion recovery (FLAIR) sequences (Fazekas et al., 1993). The lesion affects the white matter bundle, which is dedicated to higher brain functions. Cognitive decline, dementia, balance disorder, urinary dysfunction, and mood disorders are some of the principal clinical manifestations of WMH (Jing et al., 2017). It also raises the risk of stroke and mortality (Debette and Markus, 2010). WMH seriously influences the quality of life and self-care ability of patients, causing great harm to the health of the population. Therefore, it is very important and meaningful to explore the pathogenesis of WMH and take interventions based on the pathogenesis to control the WMH hazard.
Of individuals aged 1–45 years, 25.94% develop WMH (Wang et al., 2019). Whereas more than 50% of adults began to develop WMH in their 40 s (Wen et al., 2009), and the incidence rose sharply with advancing age (Moroni et al., 2018). In the Helsinki Aging Brain Study, 65% of people aged 70–75 years suffered from WMH (Ylikoski et al., 1995), while in more large cohort studies, a staggering 90% or more of people aged 80–90 years suffered from WMH (Longstreth et al., 1996; Garde et al., 2000; Deleeuw et al., 2001). The high prevalence of WMH seriously affected patients’ capacity for self-care and social functioning, putting their health at risk and placing a heavy burden on society. In order to manage WMH and enhance public health, it was crucial to investigate and define the mechanisms that cause these lesions as well as to pinpoint targets for intervention based on these mechanisms.
The pathogenesis of WMH is not fully understood. Numerous studies have been published to investigate the potential risk factors and pathogenesis of WMH, including oxidative stress, hypoperfusion, endothelial dysfunction, and blood–brain barrier impairment (Teoh et al., 2009). It is now widely acknowledged that hypertension, especially systolic blood pressure, is a independent risk factor for WMH (Dufouil et al., 2001). In addition, higher WMH volume has been linked to diabetes (van Harten et al., 2007) and smoking (Gons et al., 2011; Power et al., 2015). Studies have reported inconsistent findings regarding the role of inflammatory and metabolic factors in the pathogenesis of WMH. According to Giwa et al. (2012) and Zhang et al. (2015) a number of inflammatory proteins and cytokines, like complement C3 and C-reactive protein, could lead to cerebral microangiopathy and WMH through a series of reactions. Altendahl et al. (2020) and Boots et al. (2020) discovered that, however, a variety of variables, such as C-reactive protein and interleukins, were not substantially linked to WMH. WMH could be caused by various factors. Not all types of WMH were associated with inflammatory factors, which might be the reason for inconsistent conclusions. In addition, there might be different from WMH assessment methods, the type of institution where the patient was kept (general hospital, specialized hospital, rehab hospital, community hospital, research center, etc.), the main age groups of patients, and other varying factors in different research projects. These aspects could all produce erratic outcomes.
An estimated 1.9 billion individuals worldwide are either fat or overweight (Saltiel and Olefsky, 2017). Obesity raises disease mortality and increases the risk of a number of major illnesses, including cardiovascular diseases, type 2 diabetes, and tumors (Heron, 2018). Nowadays, it is widely acknowledged that obese patients suffer from chronic low inflammation. Such inflammation is also known as steatitis. Numerous inflammatory blood markers, including C-reactive protein, IL-6 and TNF are higher in these individuals (Rodríguez-Hernández et al., 2013; Dhananjayan et al., 2016). The anatomical and functional alterations in the brain as well as cognitive problems have been linked to this low-grade systemic inflammation (Haroon et al., 2012; Han et al., 2021). Obese patients have defective fibrinolytic systems, which might harm the endothelium of blood vessels. Additionally, obesity is linked to abnormal islet function, insulin resistance, and overexpression of monocyte chemotactic protein 1 (MCP-1) (Kahn and Flier, 2000; Parimisetty et al., 2016), which may affect energy homeostasis and cause excessive fat to accumulate in the liver, kidneys, heart, and other vital organs of the body, resulting in metabolic syndrome and increased organ load (Krzysztoszek et al., 2015).
Although there are no clear data on the rate of overlap between WMH and obesity, some studies had shown that people with high BMI were more likely to develop WMH (Lv et al., 2024). WMH and obesity were both associated with endothelial impairment and increased vascular load. Inflammatory and metabolic factors might have a more significant role in SWO. Therefore, a high rate of overlap between the two can be predicted. There was currently a lack of international research on SWO, so there was no research data to support the idea that there was a large number of patients with SWO, but as more relevant research is carried out in the future, more and more patients with SWO will be identified. The exploration of the pathogenesis of SWO, the screening, prediction, and intervention of SWO were also important for the health protection of the population.
The risk of illness beginning could be calculated using several indicators in prediction models, which could give a clearer, more understandable picture of the risk (Collins et al., 2015; Grant et al., 2018). In order to create a prediction model based on logistic regression coefficients that might more accurately predict the occurrence of SWO, we looked at various data on SWO, obesity, and WMH independently.
The aim of the present study is to identify predictors of SWO and to develop a prediction model to lay the foundation for further early diagnosis of the disease and early intervention, thereby reducing the hazard of WMH and improving the health of the WMH population.
Subjects and methods
2
Study subjects
2.1
From September 2020 to October 2021, 707 patients were screened consecutively in the Department of Neurology, Shanghai Jiaotong University School of Medicine affiliated Ruijin Hospital Luwan Branch. Inclusion criteria: patients over 18 years old who voluntarily participated in the study and signed informed consent. Exclusion criteria: (a) patients with acute disease conditions, such as acute infection, acute stroke, acute trauma and acute organ failure; (b) Patients who could not complete MRI. The study was approved by the Ethics Committee of Luwan Branch of Ruijin Hospital, Shanghai Jiao Tong University School of Medicine. All participants signed a written consent form. Among them, 57 patients did not meet the inclusion criteria, 11 patients had acute strokes, 26 patients were unable to complete MRI, 6 patients had no routine blood data, 1 patient suffered from severe other organ dysfunction and 13 patients had large motion artefacts on MRI. Eventually 650 people were recruited as study subjects (Figure 1).
The recruitment of the subjects in this study.
Assessment of WMH
2.2
The head MRI (1.5 Tesla) plain scan was completed after admission. WMH was rated in accordance with the Fazekas visual rating scale (Fazekas et al., 1993). According to the method of Fazekas, the WMH was divided into periventricular white matter hyperintensity (PVWMH) and deep white matter hyperintensity (DWMH). The scoring criteria of PVWMH was as follows: grade 0: no WMH; grade 1: caps or pencil-thin lining; grade 2: smooth halo; grade 3: irregular PVWMH extending into the deep white matter. The DWMH scoring standard: grade 0: no WMHs; grade 1: punctate foci; grade 2: beginning confluence of foci; grade 3: large confluent areas. Total score: added the regional scores of the two to get the total score. All MRI evaluations were independently conducted by one experienced neurologist who was unaware of the other clinical conditions. Fazekas scores of 0 to 3 are considered mild WMH or no WMH, whereas scores of 4 to 6 are considered severe WMH.
Assessment of obesity
2.3
The most frequently utilized indicator of obesity in today is BMI due to its simplicity and viability. In this study, we measured obesity using BMI. For the measurements, participants wore light clothing, were barefoot or in stocking feet. BMI is determined by dividing weight (in kilograms) by square height (in meters). In China, adults with a BMI between 24 kg/m^2^ and 27.9 kg/m^2^ are defined as overweight and those with a BMI ≥ 28 kg/m^2^ are defined as obese (Zhou and Cooperative Meta-Analysis Group of the Working Group on Obesity in China, 2002; Zeng et al., 2021).
Clinical data collection
2.4
The clinical data of the study subjects was registered, including age, sex, height, weight, smoking and basic diseases such as hypertension, diabetes, hyperlipidemia, cardiac disease and previous strokes. The second day after admission, the fasting elbow vein blood was collected to complete the blood laboratory tests, including white blood cell (WBC), neutrophil, lymphocyte, monocyte, basophil, eosinophil, alanine aminotransferase (ALT), aspartate aminotransferase (AST), albumin, urea nitrogen (BUN), creatinine (Cr), uric acid (UA), complement, total cholesterol (TC), triglyceride (TG), high-density lipoprotein (HDL), low-density lipoprotein (LDL), free Interleukin 2 (Free IL-2), Interleukin β (IL-β), Interleukin 6 (IL-6), Interleukin 8 (IL-8), Interleukin 10 (IL-10), tumor necrosis factor-α (TNF-α), folic acid (FA), Vitamin B12 (VitB12), glycated hemoglobin (HbA1c), Immunoglobulin A (IgA), Immunoglobulin G (IgG), Immunoglobulin M (IgM), complement 3 (C3), complement 4 (C4), C-reactive protein (CRP), 25OH-Vitamin D (25OH-VitD), fasting blood glucose (FBG), 2-h postprandial blood glucose (2hPBG), fasting C-peptide (FCP), 2-h postprandial C-peptide (2hPCP).
Statistical analysis
2.5
SPSS 22.0 statistical software (IBM Corporation, Armonk, NY, United States) was adopted to process and analyze the data. The Kolmogorov Smirnov test was used to test the normality of the data. For the measurement data of normal distribution, the mean ± standard deviation (x ± s) was used to express, and the t-test of two independent samples was used to analyze. For the measurement data with non-normal distribution, it was expressed as the median (quartile) [M (P25, p75)], and Mann Whitney U rank sum test was used to analyze. Count data was expressed as relative number composition ratio (%) or rate (%), and chi square test was used to analyze. The correlation between the test group and the control group was analyzed by multivariate logistic regression. Receiver operating characteristic curve (ROC) was drawn to analyze the diagnostic efficacy of the prediction models. The level of statistical significance was set at 0.05. Youden index was used to determine the best cutoff value. The nomogram’s predictive performance was assessed using calibration curves, a decision curve analysis (DCA), and a concordance index (C-index). By computing the net benefits at various threshold probabilities, a decision curve analysis (DCA) was used to assess the nomogram’s clinical value (Vickers et al., 2008). Internal validation was also carried out using the 1,000 bootstrap resample validation method in order to increase the model’s accuracy and stability. Using the previously described techniques, we conducted DCA, ROC, C-index, and calibration curve studies for testing validation. The nomogram was constructed using the Brms^ Package of R4.3.0 statistical software (R Foundation for Statistical Computing, Vienna, Austria).
Results
3
A study on severe WMH with obesity
3.1
Data characteristics
3.1.1
We excluded 57 non-compliant patients and finally a total of 650 patients met the inclusion criteria, including 399 males and 251 females, with an age range of 18–100 years and an average age of 67 ± 12 years. The population of the present study was Han nationality from mainland China. Between the SWO group (Fazekas = 4, 5, 6 and BMI ≥ 28 kg/m^2^, n = 55) and the non-SWO group (Fazekas = 0, 1, 2, 3 or BMI<28 kg/m^2^, n = 595), there were no obvious differences in sex, age, diabetes, hyperlipidemia, cardiac disease, previous strokes, smoking, neutrophil, lymphocyte, monocyte, basophil, ALT, AST, Albumin, BUN, Cr, complement, TC, TG, HDL, LDL, Free IL-2, IL-β, TNF-α, IL-10, IL-8, IL-6, FA, VitB12, HbA1c, IgA, IgG, IgM, CRP, 25OH-VitD, FBG, 2hPBG, FINS, 2hPINS, 2hPCP (p > 0.05), while, there were significant differences in hypertension, WBC, eosinophil, UA, C3, C4 and FCP (p < 0.05, Table 1).
Logistic regression analysis
3.1.2
In the logistic regression analysis, we included the factors with p < 0.1 in the multivariate analysis, and the results revealed that hypertension, IL-8, UA and C3 were independent risk factors for SWO (OR = 4.785, 95% CI: 1.850–12.377, p = 0.001, OR = 2.360, 95% CI: 1.232–4.521, p = 0.010, OR = 2.474, 95% CI: 1.376–4.448, p = 0.002, and OR = 4.031, 95% CI: 2.010–8.081, p = 0.000, respectively, Table 2).
A study on obesity
3.2
Data characteristics
3.2.1
In order to examine the effect of obesity and severe WMH on SWO, we analyzed the obesity and WMH groups, respectively. We divided obesity factors into two groups, obesity group (BMI < 28 kg/m^2^, n = 544) and non-obesity group (BMI ≥ 28 kg/m^2^, n = 106). There were significant differences in hypertension, albumin, UA, C3, FA, 2hPBG, FCP between the two groups (p < 0.05), and the other factors were not statistically significant (p > 0.05, Table 3).
Logistic regression analysis
3.2.2
The risk factors of obesity were further analyzed by logistic regression. The results showed that hypertension (OR = 7.272, 95% CI: 1.650–32.044, p = 0.009), albumin (OR = 1.147, 95% CI: 1.018–1.293, p = 0.024), fasting C-peptide (OR = 1.443, 95% CI: 1.066–1.955, p = 0.018) were three independent risk factors for obesity group (Table 4).
A study on WMH
3.3
Data characteristics
3.3.1
Similarly, we divided the recruited subjects into two groups. One group of patients with Fazekas score greater than or equal to 4 was defined as severe WMH group (n = 289), and the other group of patients with Fazekas score less than or equal to 3 was defined as non- severe WMH group (n = 361). Between the two groups,there were statistically significant differences in age, hypertension, previous strokes, WBC, neutrophil, monocyte, eosinophil, albumin, BUN, Cr, free IL-2, IgA, IgG, CRP, C4 (p < 0.05), and the other factors were not significantly different (p > 0.05, Table 5).
Logistic regression analysis
3.3.2
These factors were incorporated in logistic regression analysis, and the results demonstrated that age (OR = 1.058, 95% CI: 1.026–1.091, p = 0.000) and hypertension (OR = 2.738, 95% CI: 1.405–5.335, p = 0.003) were two independent risk factors for severe WMH group (Table 6). Hypertension was a specific risk factor for SWO.
Prediction model and nomogram of factors associated with SWO
4
Prediction model for SWO
4.1
Of the 650 subjects, 487 subjects (75%) were randomly assigned to the training group and 163 subjects (25%) to the validation group. There was no statistical significance between the training and validation groups (Supplementary Table S1). We constructed ROC curves of SWO and found that the area under the curve (AUC) values of IL-8, UA and C3 were all >0.5, p < 0.05. The Youden index was used to determine the best cutoff value. Each parameter had two options, low and high, and each option of the parameter was corrected by a defined point. Based on the coefficients calculated by the logistic regression model, the HUCI score was created, including four variables: hypertension, UA, C3 and IL-8. In order to improve the efficiency of the prediction model, we tried to include the classification data of the factors with p values less than 0.1 into the model. The detailed cut-off values, sensitivity, specificity and diagnostic rate of each parameter were shown in Table 7.
Through logistic regression analysis, we created the HUCIFFE score, which includes seven variables: hypertension, UA, C3, IL-8, FA, FCP and eosinophil (Table 8).
The AUCs of HUCI score and HUCIFFE score were 0.785 (95% CI: 0.720–0.850, p < 0.001) and 0.829 (95% CI: 0.768–0.890, p < 0.001), respectively. The efficacy test of HUCIFFE score was better than that of HUCI score, and had good predictive performance. The sensitivity and specificity were 70.9 and 81.0%, respectively (Figure 2).
The receiver operating characteristic (ROC) curves for the HUCI score (hypertension, UA, C3 and IL-8), the HUCIFFE score (hypertension, UA, C3, IL-8, FA, FCP and eosinophil) and the Total score for 650 patients. The arrow represents the cut-off value.
The receiver operating characteristic (ROC) curves for the HUCI score (hypertension, UA, C3 and IL-8), the HUCIFFE score (hypertension, UA, C3, IL-8, FA, FCP and eosinophil) and the Total score for 650 patients. The arrow represents the cut-off value.
We added the total scores of the seven classification factors, and used Youden index to determine the best cutoff value of the total score, then, we could judge the disease risk. Based on the coefficients calculated by the logistic regression model, we developed a scoring table for predicting SWO using the classification variables of hypertension, UA, C3, IL-8, FA, FCP and eosinophil. The AUCs of Total score was 0.823 (95% CI: 0.760–0.885, p < 0.001), respectively. The sensitivity and specificity were 60.0 and 91.4%, respectively (Figure 2; Table 9).
Development and validation of predictive nomogram
4.2
Model development
4.2.1
We created a prediction model that took UA, C3, IL-8, FA, FCP, eosinophil, and hypertension into account. The total scores for all the predictor variables were added up, and a vertical line representing the likelihood of SWO was projected down at the total score. Each predictor variable was calculated as a particular score on a grading scale. A higher probability of SWO is indicated by higher scores (Figure 3). For this nomogram, the area under the ROC curve (AUC) was 0.829 (95% CI, 0.760–0.899; Figure 4A). The calibration curves plotted based on 1,000 resamplings of the bootstrap method show a good fit between the actual probabilities in the nomogram and the predicted probabilities, which demonstrates the accuracy and stability of the predictive model (Figure 5A). The curves demonstrated that when the risk threshold was between 0 and 0.75, the model had a net benefit (Figure 6A).
Nomogram for predicting SWO probabilities.
The (ROC) curve of the nomogram. (A) Training set; (B) validation set.
Calibration curves of the nomogram. (A) Training set; (B) validation set. When the solid line (performance nomogram) is nearer the dashed line (ideal model), the nomogram’s prediction accuracy is higher.
The decision curve analysis of the nomogram. (A) Training set; (B) validation set. The horizontal solid line denotes patients without SWO, the red line represents all SWO patients, and the solid blue line comes from the prediction model. The estimated net benefit per patient for the nomogram prediction of SWO risk is shown in the figure. As the model curve is stretched, the net benefit rises.
Model validation
4.2.2
The nomogram demonstrated good stability and predictive performance in a 25% randomised internal validation. In the validation cohort, the model’s AUC was 0.835 (95% CI: 0.696, 0.975; Figure 4B). The validation cohort’s nomogram calibration curves further demonstrated the model’s good calibration (Figure 5B). When the risk threshold is between 0 and 0.55, the decision curve demonstrates that the model has a net benefit (Figure 6B).
Discussion
5
Logistic regression analyses showed significant associations between SWO and hypertension, IL-8, UA, and C3. We also looked at the groups of subjects who were obese or had severe WHM, and we found that hypertension was a shared risk factor for all three, while the other characteristics were exclusively linked to SWO. We evaluated WMH using the Fazekas scale, a visual rating scale that was frequently employed in clinical settings to score WMH. The study by Zeng et al. (2020) revealed that participants would begin to exhibit significant deterioration in cognitive performance and white matter architecture at a Fazekas score greater than 3, thus we selected a cut-off value of 3 to reflect this. We identified unique risk factors for SWO through the present study and developed two predictive models, including the nomogram plots and the HUCIFE scoring system, to predict the prevalence of SWO. Factors including hypertension, IL-8, UA, C3, and the synergistic variables such as FA, FCP, and eosinophil were adopted in the nomogram plots and the HUCIFFE scoring tables for predicting SWO. The two models had excellent performance with ROC and C indices of 0.829 and 0.828, respectively. These two models only required blood sample testing to operate and did not rely on magnetic resonance imaging. They could be used to screen the prevalence of SWO more conveniently, more economically and earlier, and laid the foundation for timely and further intervention of SWO.
The most significant risk factor for WMH was hypertension (Dufouil et al., 2001; de Leeuw et al., 2002), which was defined as having a systolic blood pressure (SBP) of less than 130 mmHg or a diastolic blood pressure (DBP) of less than 80 mmHg (Whelton et al., 2018). From the early 20th century, there has been recognition of the link between obesity and hypertension (Page, 1969). The general consensus is that the prevalence of obesity is positive correlated with hypertension. Insulin, leptin, the renin-angiotensin-aldosterone system (RAAS), sodium excretion, and stress natriuresis were some of the mechanisms by which obesity raised blood pressure (Landsberg et al., 2013). Mechanisms contributing to white matter lesions in the brain include gliosis, endothelial dysfunction, hypoperfusion and oxidative stress, all of them might be exacerbated by hypertension. It was suggested that BBB damage played a role in the etiology of WMH (Teoh et al., 2009; Wardlaw et al., 2015). This mechanism also encouraged BBB damage when hypertension was present, which worsened neuroinflammation in the brain (Toth et al., 2013). When compared to normotensive people, hypertension patients had a significantly higher relative risk of both subcortical WMH and periventricular WMH (de Leeuw et al., 2002). Hypertension thus played an important role in the pathogenesis of SWO by promoting and exacerbating the process.
Uric acid was a naturally occurring water-soluble antioxidant that efficiently scavenged the majority of reactive nitrogen and oxygen radicals in the peripheral nervous system (Gao et al., 2008) and provided the peripheral nervous system with good defense against oxidative stress (Bowman et al., 2010). Adipose tissue had the ability to make and secrete uric acid (Tsushima et al., 2013), and hyperuricaemia was twice as common in obese people as it was in healthy individuals (Liu et al., 2015). This was further supported by a study on fat mice, who had increased blood uric acid levels (Tsushima et al., 2013). Nitric oxide, according to Vannorsdall et al. (2008), might be mainly responsible for the effects of uric acid on the brain. High uric acid levels might decrease the nitric oxide availability, which would impair vascular tone and endothelial function, resulting in the development of WMH. High levels of uric acid in the CSF could subsequently impair the BBB (Bowman et al., 2010), which aided in the formation of WMH. Even so, some researches indicated that uric acid was not related to WMH (Kim et al., 2020). The opposite results might be explained by the various study subjects. Not all types of WMH were associated with uric acid. There were many aspects in the pathogenesis of WMH, different subtypes might have different pathogenesis. This might be the reason why uric acid was closely associated with some WMH subtypes, such as SWO, but not with the others. Uric acid might play a significant role in the etiology of SWO by reducing nitric oxide availability, harming the blood–brain barrier, and impairing endothelial function and vascular tone.
The most prevalent complement, C3, is a crucial part of innate immunity and is involved in immunological control and infection protection (Frank and Volanakis, 1998). Additionally, C3 levels are greater in obese individuals than in non-obese individuals and are most strongly correlated with abdominal obesity in particular, with this manifestation being more pronounced in extremely obese individuals (Hernández-Mijares et al., 2007). An animal experiment demonstrated that visceral adipocytes from obese mice upregulated the expression of PU.1, a member of the Ets family of DNA-binding proteins which controled the expression of inflammatory factors and enzymes that increase levels of chronic inflammation, such as tumour necrosis factor and interleukins in vivo (Lin et al., 2012). These inflammatory factors also stimulated adipocytes to express C3 mRNA, thus raised serum C3 levels. The protease histonectin L (CTSL) cleft C3 into two pieces, C3a and C3b (Asavapanumas et al., 2021), and once cleft, C3a bound to its receptor C3aR, promoting vascular inflammation and BBB damage (Propson et al., 2021). Insufficient perfusion of C3a receptors caused white matter injury in microglia, which was exacerbated by elevated C3 levels (Zhang et al., 2020). This could likewise play a role in the etiology of SWO.
IL8 functioned as a chemokine, inducing chemotaxis in macrophages, neutrophils, basophils, and T cells (Hammond et al., 1995; Bonecchi et al., 2000; Straczkowski et al., 2002; Janeway, 2012; Turner et al., 2014). IL-8 was generated and secreted by human adipocytes and Bruun et al. (2000, 2001) demonstrated that blood IL-8 levels were higher in obese individuals, which could led to increased local and systemic inflammation as well as insulin resistance (Gregor and Hotamisligil, 2011; Lin et al., 2020). This localized and widespread inflammation brought about microvascular alterations and created a chronic underperfusion, which in turn caused persistent oligodendrocyte mortality and ongoing degeneration of myelin fibres, resulting in progressive white matter injury (Sandu et al., 2015). Moreover, IL-8, which increased pro-inflammatory and pro-oxidant nitric oxide and affected the cerebral microvascular endothelium, might be linked to cytokine overexpression associated with microglia activation, resulting in WMH (Sloane et al., 1999; Frodl and Amico, 2014). The pathogenesis of SWO was significantly influenced by the chronic perfusion deficit condition and increased nitric oxide processes brought on by IL-8, which promoted oligodendrocyte death in SWO.
Earlier studies focused more on the predictive value of individual parameters. However, when determining a patient’s diagnosis and prognosis for a disease, doctors naturally combine a number of patient characteristics and symptoms, such as predictors and test results, and probability estimates are rarely based on individual predictors. Prediction is therefore by its very nature multivariate (Collins et al., 2015). Combinations of two or more parameters or raising the parameter of related can be utilized to enhance the diagnostic performance since several risk variables included in a model might produce synergistic effects. Based on the present study, we finally constructed a prediction model that included hypertension, UA, C3, IL-8, FA, FCP and eosinophil. The results of the ROC analysis in this study demonstrate the excellent performance of the model. The model makes it easy for clinicians to predict the probability of obese brain white matter lesions. For each individual patient, we can substitute the patient’s data into a nomogram (Figure 3) and add up the scores obtained for each item, and the probability corresponding to the total score is the patient’s risk of developing the disease. The model is straightforward and understandable, making it simple to use in routine clinical practice. Moreover, we can estimate risk using the HUCIFFE scale (Table 9), where a total score of 9 or higher indicates a high risk for SWO. The two measures can be used to validate one another and mainly used for SWO screening. This technology enables for fast risk assessment, as well as screening at community hospitals, nursing homes, and other locations without access to MRI, allowing for early detection and intervention and preserving vital medical resources. So that we can better control the hazards of WMH.
The present study also has some limitations. The subjects in this study were provided by a single centre and the Chinese obesity criteria (BMI ≥28 kg/m^2^) were used, and the model might limit its generalizability. Even though bootstraps with 1,000 resamples were used to confirm our nomogram, additional prospective multicenter studies were still required to verify our findings externally. The average age of the subjects in this study is older, while older subjects exhibit higher WMH volumes. BMI was adopted as the only marker of obesity and there were no available data on other anthropometric markers of obesity (e.g., waist-hip circumference or waist circumference), which might be biased. In addition, WMH can be divided into PVWMHs and DWMHs, and obesity can be divided into subcutaneous fatty and visceral fatty. This subdivision into specific subtypes could better improve the predictability of SWO. Last but not least, our study’s sample size was somewhat modest and has to be expanded in order to further validate the results.
Conclusion
6
According to our study, we used the synergistic variables FA, FCP, and eosinophil for SWO along with hypertension, IL-8, UA, and C3 to create a nomogram (Figure 3) and a HUCIFFE scale (Table 9). The nomogram enables visualization of the patient’s WMH risk. When the HUCIFFE scale is scored higher than 9, the patient has a significantly increased risk of developing the disease. The two forms can be compared and validated against one another, and they can be widely used in clinical practice. These two models only require blood sample testing to operate and do not rely on magnetic resonance imaging. The screening can be conducted in community hospitals, nursing homes, and other locations without access to MRI, allowing for the earliest possible detection and intervention as well as providing assessment criteria for the early identification and control of WMH hazards.
Data availability statement
The original contributions presented in the study are included in the article/Supplementary material, further inquiries can be directed to the corresponding authors.
Ethics statement
The studies involving humans were approved by the Ethics Committee of Luwan Branch of Ruijin Hospital, Shanghai Jiao Tong University School of Medicine. The studies were conducted in accordance with the local legislation and institutional requirements. The participants provided their written informed consent to participate in this study.
Author contributions
FC: Conceptualization, Data curation, Formal analysis, Investigation, Methodology, Project administration, Validation, Visualization, Writing – original draft, Writing – review & editing. L-hC: Formal analysis, Investigation, Methodology, Writing – review & editing. F-yM: Investigation, Writing – review & editing. L-lZ: Conceptualization, Formal analysis, Investigation, Writing – review & editing. J-rH: Conceptualization, Formal analysis, Funding acquisition, Investigation, Methodology, Project administration, Resources, Software, Supervision, Validation, Writing – original draft, Writing – review & editing.
The reference list from the paper itself. Each links out to its DOI / PubMed record.
- 1Altendahl M.Maillard P.Harvey D.Cotter D.Walters S.Wolf A.. (2020). An IL-18-centered inflammatory network as a biomarker for cerebral white matter injury. P Lo S One 15:e 0227835. doi: 10.1371/journal.pone.0227835, PMID: 31978079 PMC 6980497 · doi ↗ · pubmed ↗
- 2Asavapanumas N.Tradtrantip L.Verkman A. S. (2021). Targeting the complement system in neuromyelitis optica spectrum disorder. Expert. Opin. Biol. Ther. 21, 1073–1086. doi: 10.1080/14712598.2021.188422333513036 PMC 8316261 · doi ↗ · pubmed ↗
- 3Bonecchi R.Facchetti F.Dusi S.Luini W.Lissandrini D.Simmelink M.. (2000). Induction of functional IL-8 receptors by IL-4 and IL-13 in human monocytes. J. Immunol. 164, 3862–3869. doi: 10.4049/jimmunol.164.7.3862, PMID: 10725748 · doi ↗ · pubmed ↗
- 4Boots E. A.Castellanos K. J.Zhan L.Barnes L. L.Tussing-Humphreys L.Deoni S. C. L.. (2020). Inflammation, cognition, and white matter in older adults: an examination by race. Front. Aging Neurosci. 12:553998. doi: 10.3389/fnagi.2020.553998, PMID: 33192454 PMC 7662133 · doi ↗ · pubmed ↗
- 5Bowman G. L.Shannon J.Frei B.Kaye J. A.Quinn J. F. (2010). Uric acid as a CNS antioxidant. J. Alzheimers Dis. 19, 1331–1336. doi: 10.3233/JAD-2010-133020061611 PMC 2859185 · doi ↗ · pubmed ↗
- 6Bruun J. M.Pedersen S. B.Richelsen B. (2000). Interleukin-8 production in human adipose tissue. Inhibitory effects of anti-diabetic compounds, the thiazolidinedione ciglitazone and the biguanide metformin. Horm. Metab. Res. 32, 537–541. doi: 10.1055/s-2007-978682, PMID: 11246821 · doi ↗ · pubmed ↗
- 7Bruun J. M.Pedersen S. B.Richelsen B. (2001). Regulation of interleukin 8 production and gene expression in human adipose tissue in vitro. J. Clin. Endocrinol. Metab. 86, 1267–1273. doi: 10.1210/jc.86.3.1267, PMID: 11238519 · doi ↗ · pubmed ↗
- 8Collins G. S.Reitsma J. B.Altman D. G.Moons K. G. M. (2015). Transparent reporting of a multivariable prediction model for individual prognosis or diagnosis (TRIPOD): the TRIPOD statement. BMJ 350:g 7594. doi: 10.1136/bmj.g 759425569120 · doi ↗ · pubmed ↗