Epidemiological and Clinical Characteristics Associated with COVID-19 Severity Among Hospitalized Patients in the United Arab Emirates: A Retrospective Multicentre Study
Najlaa Al-Bluwi, Razan Agha, Ankita Shukla, Rouba Karen Zeidan, Hamzah AlZubaidi, Manal Awad, Amal Hussein, Muzan Abdelbagi, Khaled AlSayed, Mohamad B. Alebaji, Mahasin Shaheen, Laila Salameh, Bassam Mahboub, Hady Elkhodary, Riyad Bendardaf, Ghada Mohammed, Dima Wardat

TL;DR
This study identifies risk factors for severe COVID-19 in hospitalized patients in the UAE, including obesity, diabetes, and dehydration, to help improve monitoring and early detection.
Contribution
The study provides new insights into specific clinical and epidemiological risk factors for severe COVID-19 in the UAE population.
Findings
Obesity and diabetes were strongly associated with severe COVID-19 outcomes.
Smoking and higher oxygen saturation were protective factors against severe disease.
Delays in hospital admission and elevated blood markers were linked to increased severity.
Abstract
To investigate the clinical and epidemiological factors associated with severe COVID-19 cases in hospitalized patients across two emirates within the United Arab Emirates (UAE). A retrospective observational analytical study analysed data from 738 medical records and conducted 573 in-depth interviews with patients hospitalized across multiple healthcare centers in the UAE, between 29 January 2020 and 14 October 2021. Regression analysis predicted risk factors for COVID-19 severity. Main risk factors identified were crowding (aOR 1.919; 95%CI 1.144, 3.221), obesity (aOR 2.383; 95%CI 1.332, 4.263), diabetes (aOR 11.14; 95%CI 2.653–46.797), severe dehydration (aOR 3.219; 95%CI 2.161, 4.795), cough or sore throat (aOR 1.607; 95%CI 1.032, 2.502), shortness of breath (aOR 1.921; 95%CI 1.294, 2.853), increased days from symptom onset to admission (aOR 1.055; 95%CI 1.006, 1.105), elevated ANC…
Genes, proteins, chemicals, diseases, species, mutations and cell lines named across the full text — each resolved to its canonical identifier and authoritative record.
Click any figure to enlarge with its caption.
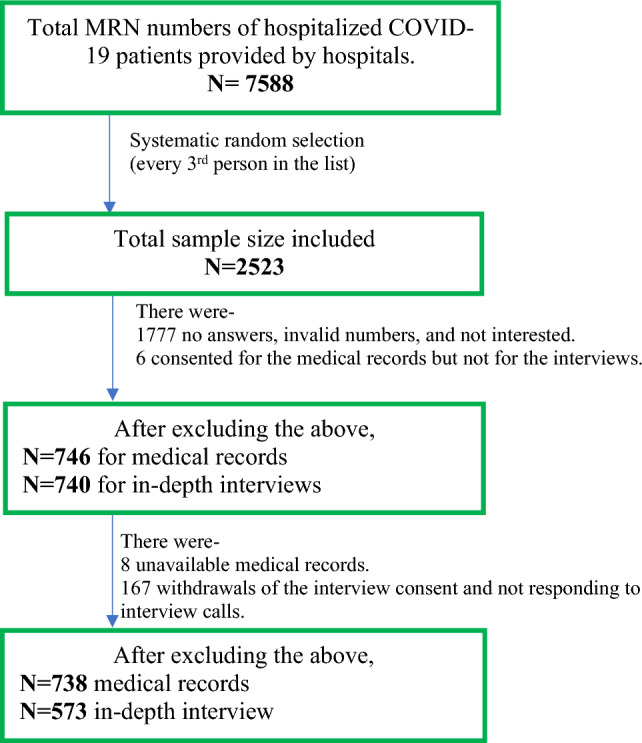 Figure 1
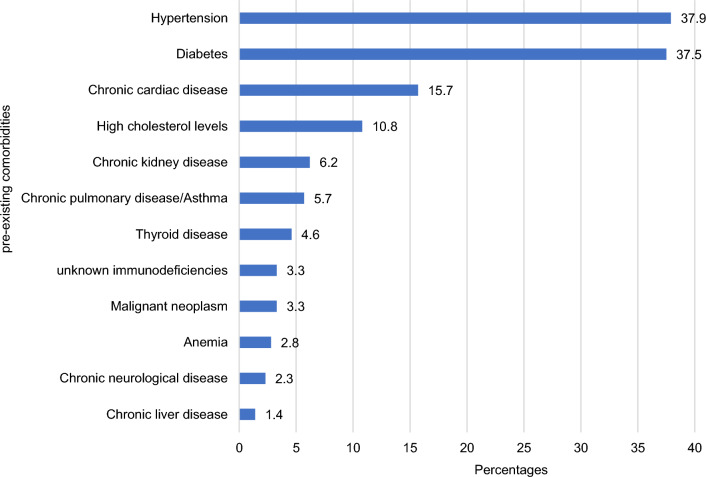 Figure 2
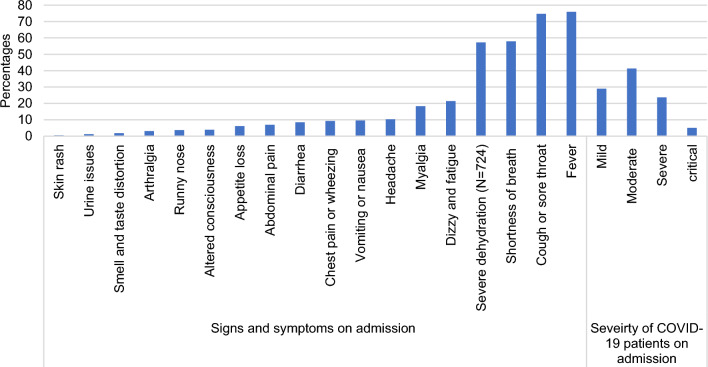 Figure 3
- —Clinical Epidemiology Research Group operational Grant, University of Sharjah UAE
- —COVID-19 Special UOS Grant, University of Sharjah UAE, CoV19-0301
Peer Reviews
No public reviews on file for this paper yet. If you reviewed it on a platform where reviews are public (OpenReview, ICLR, NeurIPS, ICML), you can paste yours below so the community can read it here.
Videos
No videos yet. Explain this paper in a talk, walkthrough, or lecture? Add one.
Taxonomy
TopicsCOVID-19 Clinical Research Studies · Long-Term Effects of COVID-19 · COVID-19 and healthcare impacts
Introduction
On May 5, 2023, the World Health Organization (WHO) declared that the Coronavirus Disease 2019 (COVID-19) pandemic no longer posed a public health emergency of international concern [1]. However, the disease is still affecting populations worldwide, leading to over 680 million confirmed cases and 6.5 million deaths. As of June 20, 2023, the United Arab Emirates (UAE) had reported 1,067,030 confirmed COVID-19 cases and 2349 deaths [2].
COVID-19 severity and clinical manifestations vary across geographical locations and host factors. Severe patients may exhibit various symptoms and laboratory abnormalities including respiratory system symptoms, musculoskeletal problems, gastrointestinal complaints, mucocutaneous symptoms [3], lymphopenia, thrombocytopenia, abnormal liver function tests, and elevated inflammatory markers [4, 5].
Previous studies have identified predictors of COVID-19 severity including sociodemographic factors such as ethnicity, gender, and residence area [6, 7]; as well as comorbidities like diabetes, hypertension, kidney diseases, nervous system disorders, and obesity [8]. Smoking status has also shown conflicting associations with some studies suggesting it as a potential predictor of adverse COVID-19 outcomes [9], while others associate current smoking to a lower risk of severe COVID-19 [10]. The UAE's diverse population, influenced by variations in ethnicity, genetics, culture, and social practices may significantly impact the spread and severity of COVID-19 [7, 11].
Previous studies in the UAE focused primarily on COVID-19 severity using medical records [8] specific populations such as paediatric patients [12], were confined to a single emirate [8], or a single healthcare facility [13]. This study aims to address these gaps by using two methods of data collection across multiple healthcare centres in more than one emirate. This approach will obtain more precise and reliable data, explore novel relationships, increase the access and diversity to eligible study subjects, and improve generalization of the results.
Methods
Study Design and Setting
A retrospective observational study was conducted in four major hospitals in Sharjah and Dubai, UAE. These hospitals comprised a mix of private, semi-governmental, and governmental institutions offering a wide range of clinical services, and specialized ICU units. The private hospital offered 254 beds, while the semi-governmental hospitals provided 417 and 325 beds, respectively. The governmental hospital had 762 beds. These hospitals were selected for their capacity, range of specialties, and to ensure diverse representation in the study.
Participants and Sample Size
This study included adults aged 18 years or older who tested positive for COVID-19 using the Real time Reverse Transcriptase Polymerase Chain Reaction (RT-PCR) test on nasal and/or pharyngeal swab specimens in laboratories, and who were admitted to one of the four selected hospitals between January 29, 2020, and October 14, 2021. Pregnant women and those unable to provide informed consent were excluded from the study. Each participating hospital provided a list of inpatients who met the inclusion criteria. Participants were then sorted in ascending order based on their hospital ID numbers. We performed a systematic random selection from these lists at predetermined regular intervals where every third person in the list was chosen.
For this study, a minimum of 385 patient records were needed, using the formula Sample Size = [z2 * p (1-p)] / e2, assuming a prevalence of 50%, a margin of error of 5%, and a confidence level of 95%. However, considering a non-response and incomplete response rate of 20%, the target minimum sample size was adjusted to 482 adults.
The final achieved sample was 738 for medical records and 573 for the detailed epidemiological telephone interviews. A detailed description of how the final sample size was achieved, as well as a breakdown of participants who were included, did not respond, did not consent, and the number of inaccessible medical records are presented in Fig. 1.Fig. 1. Description and breakdown of patients’ data
Data Collection and Study Tools
The study utilized data from both medical records, as well as in-depth interviews with COVID-19 hospitalized patients. The interview guide was initially prepared in English and translated into Arabic and Urdu by the study team. Back-translations were performed to ensure equivalence reliability. Before being sent to five specialists for content validation, 15 adults piloted the interview guide. Following the pilot study, the research team modified the study guide slightly to enhance its efficacy and validity. To ensure inter-rater reliability all interviewers and data collectors underwent the same training sessions.
The process of data collection was performed as follows. First, patients or their next of kin were invited to participate through telephone calls. Those who expressed willingness and consent were offered a convenient interview date and time. Those who declined to participate in the study were recorded as non-response. Next, the participants' medical data were retrieved. Finally, the interviews were conducted on the agreed-upon day and time.
The structured interview which collected information on sociodemographic characteristics, behavioral risk factors, and vaccination status took approximately ten minutes to complete.
Medical data were extracted from each patient’s electronic health records using a standardized data collection form. This form was a modified version of the WHO/International Severe Acute Respiratory and Emerging Infection Consortium acute respiratory infections (ISARIC) case record form. It included the following sections: severity on admission, past medical history, BMI categories (underweight < 18.5 kg/m^2^, normal 18.5–24.9 kg/m^2^, overweight 25.0–29.9 kg/m^2^, and obese > 29.9 kg/m^2^) [14], radiological testing, symptoms, clinical measures, and laboratory test results. Any missing or uncertain records were clarified through direct communication with healthcare providers or participants.
COVID-19 severity on admission was categorized into four categories following the National Health Commission of China guidelines that were available when we designed the study. The classification was defined as follows: (i) Mild: presented with mild symptoms without radiographic features; (ii) Moderate: presented with fever, respiratory symptoms, and radiographic features; (iii) Severe: met one of the three criteria: (a) dyspnea, respiration rate (RR) greater than 30 times/min, (b) oxygen saturation less than 93% in ambient air, and (c) PaO2/FiO2 less than 300 mm Hg; and (iv) Critical: met one of the following criteria: (a) respiratory failure, (b) septic shock, or (c) multiple organ failure [15]. To simplify regression analysis, COVID-19 severity was further grouped into two categories: non-severe (including mild) and severe (including, moderate, severe, and critical).
Data Analysis
Data were analysed using SPSS version 28 [16]. Descriptive data were analysed using counts and percentages, and normality was tested using the Kolmogorov–Smirnov test. Associations between categorical variables were explored using Chi-square and Fisher’s exact tests, while two group comparisons involving continuous variables were conducted using independent samples t-test and Mann–Whitney U tests. Multivariate binary logistic regression analysis was conducted to predict the odds of severe COVID-19. Independent variables included in the models were selected based on statistical significance, while variables with small-number observations were excluded. Four models were developed: the first focused on sociodemographic characteristics, smoking history and medical history; the second examined symptoms and clinical measures; the third analysed laboratory results; and the final model included all study variables.
Results
In total, clinical data from 738 patient medical records were extracted. Out of these, detailed epidemiological telephone interviews were conducted with 573 patients. The larger number of nonresponses in the interviews was attributed to refusal to consent to interviews, withdrawals of the interview consent on the day of the interview, or failure to answer the call during the scheduled appointments. However, the incomplete responses in interviews were due to patients either not completing the entire interviews or refusing to answer specific questions. Additionally, the medical records had gaps due to variations in test performance and information recording among different hospitals.
Sociodemographic Characteristics and Smoking History of Study Participants
Approximately half of the hospitalized COVID-19 patients were Arab (56.7%), employed (56.9%). and aged 30 to 60 years (61.5%). Most were married (79.1%) and had no family history of consanguinity (78.3%). While 76.5% identified themselves as non-smokers, 62.1% reported that no one in their family smoked (Table 1).Table 1. Sociodemographic characteristics, smoking history, and past medical history of study participantsVariable (N)n%Gender (737) Female26435.8 Male47364.2Marital status (561) Single559.8 Married44479.1 Divorced/widowed6211.1Age in years (733) 18–29435.9 30–6045161.5 60 + 23932.6 Age in years (median (IQR))50.06 (23)Education level (560) Less than high school19334.5 High school11520.5 Bachelors21939.1 Postgraduate335.9Ethnicity (573) Asian22238.7 Arab32556.7 Others264.5Income/month AED (513) Less than 30009919.3 3000–799913726.7 8000–1499910219.9 15,000–2999910219.9 More than 30,0007314.2Work status (552) Not working23843.1 Working31456.9Occupation (314) Labour/cleaner/delivery8326.4 Admin work8426.8 Managerial8627.4 Business3711.8 Health care worker247.6Area of residence (559) Dubai18733.5 Sharjah/Ajman35463.3 Other emirates183.2 Family history of consanguinity (557)12121.7Crowding (542) 1–2 person/room37469 3 or more person/room16831Smoking status (565) Non-smoker43276.5 Former smoker8214.5 Current smoker519Smoking frequency (day/month) (132) Not regular (not every day)5037.9 Regular (all 30 days)8262.1Smoking frequency (cigarettes/day) (105) 1–55451.4 6 and more5148.6Anyone in the family smokes (563)11320.1Past surgery (701)14420.5BMI (618) Underweight101.6 Normal14423.3 Overweight22636.6 Obese23838.5Pre-existing medications (738) ACE inhibitors598 ARBS537.2 NSAID537.2 Pressor support101.4Vaccination (573) Influenza6811.9 BCG32656.9 COVID-19 first dose28338.3 COVID-19 s dose26936.4 Previous measles infection8815.4Radiological testing (738) Chest x-ray66590.1 CT42657.7 Other223
Past Medical History of Patients
Hypertension (37.9%) and diabetes (37.5%) were the most common comorbidities among participants (Fig. 2). The majority were overweight or obese (75.1%). ACE inhibitors (8.0%) were the most frequently prescribed pre-existing medications, and 38.3% of patients had received the initial dose of the COVID-19 vaccine (Table 1).Fig. 2. Percentages of pre-existing comorbidities among study participants (N = 738)
COVID-19 Severity Categories and Symptoms on Admission
Around half of the hospitalized patients had a moderate form of COVID-19 (41.3%) on admission while 29% were classified as mild, 23.8% as severe and only 5% as critical. The most reported symptoms on admission were fever (75.9%), and cough or sore throat (74.7%) (Fig. 3). Lung abnormalities were diagnosed in 90.1% via chest X-ray and in 57.7% via CT scan (Table 1).Fig. 3. Percentages of COVID-19 severity and symptoms on admission of study participants (N = 738)
Clinical Measures on Admission
Patients had a median duration of 4 days (IQR 5 days) from symptom onset to hospitalization. Most clinical measurements were within the normal range, except for a slightly elevated median systolic blood pressure at (128 mmHg) (IQR 25) and median body temperature of (37.4 °C) (IQR 1.4 °C) (Table 2).Table 2. Clinical measures and laboratory resultsVariableNMedian^a^IQR^a^Normal rangeDuration from symptoms to admission (days)70145Clinical measures on admission Systolic BP (mmHg)72312825 < 120 Diastolic BP (mmHg)7217715 < 80 Temperature (°C)72637.41.436.50–37.00 Heart rate HR (beats/min)725922560–100 Respiratory rate RR (breaths/min)72020612–20 Oxygen saturation SpO2 (%)72396695–100 Glasgow coma score71615015Laboratory results Complete blood count CBC White blood count WBC (× 10^9^/l)5756.544.094.50–11.00 Hemoglobin Hb (g/dL)57613.102.4012.00–15.00 Platelets (× 10^9^/l)587209.00117.00150.00–410.00 Absolute neutrophile count ANC (10^3/ul)5674.993.742.00–7.00 Absolute lymphocyte count ALC (10^3/ul)5801.000.671.00–3.00 Coagulation profile Prothrombin time PT (Secs)36112.302.309.70–11.80 Activated partial thromboplastin time aPTT (Secs)31936.32^b^ ± 6.11^b^25.10–37.70 International normalized ratio INR3581.030.15 < 1.10 D-dimer (mg/l)4980.720.67 < 0.50 Electrolytes Sodium (mEq/L)558136.006.25135.00–145.00 Potassium (mEq/L)5623.990.783.60–5.20 Renal function Creatinine (umol/L)54684.0037.0044.00–133.00 Urea (mmol/L)5145.804.381.70–8.30 Liver function Albumin (g/l)51931.0011.0034.00–52.00 Bilirubin, total (umol/l)5218.807.001.71–20.50 Alanine aminotransferase/serum glutamic-pyruvic transaminase ALT/SGPT (U/L)52537.0036.5014.00–41.00 Aspartate aminotransferase/serum glutamic-oxaloacetic transaminase AST/SGOT (U/L)45840.0034.0015.00–37.00 Triglycerides (mmol/L)571.79^b^ ± 0.67^b^ < 1.70 Gamma-glutamyl transferase GGT (U/L)6133.0045.005.00–36.00 Inflammatory markers Erythrocyte sedimentation rate ESR (mm/1 h)11553.0048.00 < 20.00 Ferritin (ng/mL)485368.00553.0026.00–300.00 Procalcitonin (ng/mL)4510.140.26 < 0.05 Lactate (mmol/L)1101.470.900.50–2.20 Lactate dehydrogenase LDH (U/L)435367.00235.00135.00–214.00 C-reactive protein CRP (mg/l)54874.00104.500.10–3.00 Interleukins IL_6 (pg/mL)2724.4087.500.00–36.00 Indicators of cardiac injury Troponin (ng/mL)3330.0090.018 < 0.040 Creatinine kinase CK (U/L)265115.000187.00022.000–167.000 Immunoglobin G IgG (g/L)0006.00–16.00^a^p value of Kolmogorov–Smirnov ≤ 0.05; data is summarized in median and interquartile rang^b^p value of Kolmogorov–Smirnov > 0.05; data is summarized in mean and standard deviation
Laboratory Results
Upon admission, coagulation testing profiles indicated prolonged prothrombin time and elevated d-dimer levels with median values of 12.3 s (IQR 2.3 s) and 0.72 mg/l (IQR 0.670 mg/L) respectively. Elevated median values of inflammatory markers were also observed, ESR at 53 mm/1 h (IQR 48 mm/1 h), LDH at 367 U/L (IQR 235 U/L), ferritin at 368 ng/mL (IQR-553), procalcitonin 0.14 ng/mL (IQR 0.26 ng/mL), and CRP 74 mg/L (IQR 104.5 mg/L). Other laboratory results, including renal function, liver function, electrolytes, indicators of cardiac injury, and complete blood count were within normal limits (Table 2).
Bivariate Analysis
Men had a higher percentage of severe cases (74.1%) compared to women (65.0%). Divorced and widowed patients (75.8%) showed higher severity rates compared to married (68.0%) and single (52.7%) patients. Patients aged 65 years or older (74.2%) had a higher proportion of severe cases compared to those aged 30 to 59 years (72.1%) and 18 to 29 years (41.9%). Patients residing in other emirates (77.8%), or Sharjah/Ajman (74.4%) had higher severity rates compared to residents of Dubai (54.0%). Patients with a monthly income less than 15,000 AED (72.0%) had a higher proportion of severe COVID-19 than those with incomes ranging from 15,000 to 30,000 AED (58.4%) and more than 30,000 AED (69.9%). Living in residences with three or more people sharing one room (73.7%) was associated with higher severity rates compared to living in less crowded homes (65.1%). Non-smokers and former smokers (68.9%) had higher frequencies of moderate/severe cases compared to current smokers (59.8%) (Table 3).Table 3. Sociodemographic characteristics, smoking history, past medical history, and symptoms associated with COVID-19 severity on admissionVariablesNon severeSevereP-value^a^N (%)N (%)Gender Female92 (35)171 (65)0.009 Male121 (25.9)347 (74.1)Marital status Single26 (47.3)29 (52.7)0.024 Married141 (32)300 (68) Divorced/widowed15 (24.2)47 (75.8)Age in years 18–2925 (58.1)18 (41.9) < 0.001 30–60125 (27.9)323 (72.1) 60 + 61 (25.8)175 (74.2) Age (median (IQR))46.12 (26)51.58 (23) < 0.001^b^Education level ≤ High school98 (32.1)207 (67.9)0.234 Bachelors67 (30.6)152 (69.4) Postgraduate15 (45.5)18 (54.5)Ethnicity (570) Asian67 (30.5)153 (69.5)0.727 Arab109 (33.6)215 (66.4) Others8 (30.8)18 (69.2)Income/month AED < 15,00098 (28)242 (72)0.034 15,000–2999942 (41.6)59 (58.4) ≥ 30,00022 (30.1)51 (69.9)Work status Not working77 (32.6)159 (67.4)0.804 Working99 (31.6)214 (68.4)Occupation Labour/cleaner/delivery24 (28.9)59 (71.1)0.62 Admin work27 (32.1)57 (67.9) Managerial26 (30.6)59 (69.4) Business11 (29.7)26 (70.3) Health care worker11 (45.8)13 (54.2)Family history of consanguinity40 (33.1)81 (66.9)0.805Area of residence Dubai86 (46)101 (54) < 0.001 Sharjah/Ajman90 (25.6)261 (74.4) Other emirates4 (22.2)14 (77.8)Crowding 1–2 person/room130 (34.9)242 (65.1)0.048 3 or more person/room44 (26.3)123 (73.7)Smoking status Non-smoker/former smoker159 (31.1)352 (68.9)0.021 Current smoker24 (47.1)27 (52.9)Smoking frequency Not regular (not every day)17 (34.7)32 (65.3)0.527 Regular (all 30 days)33 (40.2)49 (59.8)Smoking frequency (cigarettes/day) 1–519 (35.8)34 (64.2)0.577 6 and more21 (41.2)30 (58.8)Anyone in the family smokes44 (38.9)69 (61.1)0.102Past surgery49 (34.0)95 (66.0)0.096BMI Underweight8 (80.0)2 (20.0) < 0.001 Normal52 (36.4)91 (63.6) Overweight69 (30.7)156 (69.3) Obese53 (22.4)184 (77.6)Comorbidities Chronic cardiac disease31 (27.2)83 (72.8)0.602 Hypertension65 (23.6)211 (76.4)0.009 Chronic pulmonary disease/asthma11 (26.2)31 (73.8)0.655 Chronic kidney disease15 (32.6)31 (67.4)0.603 Chronic liver disease6 (60)4 (40)0.072^c^ Chronic neurological disease‡4 (23.5)13 (76.5)0.789 Diabetes67 (24.5)206 (75.5)0.031 Malignant neoplasm9 (37.5)15 (62.5)0.365 Unknown immunodeficiencies2 (8.3)22 (91.7)0.022 Anaemia8 (38.1)13 (61.9)0.365 High cholesterol levels23 (28.7)57 (71.3)0.92 Thyroid disease9 (26.5)25 (73.5)0.717Pre-existing medications ACE inhibitors16 (27.1)43 (72.9)0.709 ARBS14 (26.4)39 (73.6)0.639 NSAID13 (24.5)40 (75.5)0.434 Pressor support3 (30.0)7 (70.0)0.957^c^Vaccination Influenza28 (41.2)40 (58.8)0.095 BCG121 (37.3)203 (62.7)0.003 COVID-19 first dose106 (37.7)175 (62.3) < 0.001 COVID-19 s dose101 (37.8)166 (62.2) < 0.001 Previous measles infection26 (29.5)62 (70.5)0.551Symptoms on admission Fever132 (23.7)424 (76.3) < 0.001 Cough or sore throat138 (25.3)408 (74.7) < 0.001 Shortness of breath74 (17.5)348 (82.5) < 0.001 Severe dehydration62 (15.1)348 (84.9) < 0.001 Dizzy and fatigue48 (30.4)110 (69.6)0.721 Myalgia37 (27.4)98 (72.6)0.605 Headache26 (34.2)505 (65.8)0.314 Vomiting or nausea30 (42.3)41 (57.7)0.011 Chest pain/chest wheezing13 (19.7)53 (80.3)0.074 Diarrhoea23 (37.1)39 (62.9)0.155 Abdominal pain21 (42.0)29 (58.0)0.04 Appetite loss16 (35.6)29 (64.4)0.336 Altered consciousness8 (27.6)21 (72.4)0.842 Runny nose13 (48.1)14 (51.9)0.028 Arthralgia3 (13.0)20 (87.0)0.083 Smell and taste distortion9 (69.2)4 (30.8)0.003^c^ Urine issues4 (44.4)5 (55.6)0.296^c^ Skin rash3 (75.0)1 (25.0)0.077^c^^a^Chi square test^b^Mann-Whitney U tests^c^Fisher exact test
A higher percentage of patients who had severe COVID-19 at admission were patients who were obese, had hypertension, diabetes, unknown immunodeficiencies, had not received the BCG vaccine, and had not received the first dose or second dose of the COVID-19 vaccine. A higher percentage of patients with fever (76.3%); cough or sore throat (74.7%); shortness of breath (82.5%); and severe dehydration (84.9%) were significantly associated with severe COVID-19 cases. In contrast, vomiting or nausea (57.7%); abdominal pain (58.0%); runny nose (51.9%); and smell and taste distortion (30.8%) were significantly associated with lower proportions of severe COVID-19 cases (Table 3).
Severe COVID-19 patients had significantly longer median durations from symptom onset to hospital admission (4 days), and higher medians of temperature (37.5 °C), heart rate (93 beats/min) and respiratory rate (20 breaths/min). In contrast, median oxygen saturation SpO2 (%) was significantly lower in severe COVID-19 patients compared to non-severe COVID-19 patients (95) (Table 4).Table 4. Association between clinical measures on admission, and laboratory results with COVID-19 severity on admissionVariablesNon severeSevereP-value^a^Mean/median ± SD/IQRMean/Median ± SD/IQRDuration from symptoms to admission (days)2445 < 0.001Clinical variables Systolic BP (mmHg)12524129260.090 Diastolic BP (mmHg)781677150.560 Temperature (°C)37.01.337.51.5 < 0.001 HR (Beats/Min)892493260.010 RR (Breaths/Min)184207 < 0.001 SpO2 (%)983958 < 0.001 Glasgow coma score1501500.070Laboratory variables CBC WBC (× 10^9^/l)6.104.106.804.080.002 Hb (g/dL)13.052.6313.102.400.806 Platelets (× 10^9^/l)208.00107.00209.00117.000.710 ANC (10^3/ul)4.273.145.104.02 < 0.001 ALC (10^3/ul)1.130.930.920. 590.001 Coagulation profile PT (Secs)12.702.1712.202.300.080 aPTT (Secs)36.40 ± 5.8036.20 ± 6.100.940^b^ INR1.030.161.040.150.890 D-dimer (mg/L)0.610.650.750.710.050 Electrolytes Sodium (mEq/L)136.005.00135.006.000.040 Potassium (mEq/L)4.000.773.900.790.810 Renal function Creatinine (umol/L)73.5035.0587.5035.90 < 0.001 Urea (mmol/L)5.715.005.894.200.830 Liver function Albumin (g/l)35.0012.0031.009.48 < 0.001 Bilirubin, total (umol/l)7.106.259.307.600.002 ALT/SGPT (U/L)33.0036.5037.5037.000.012 AST/SGOT (U/L)35.0033.0041.0034.000.040 Triglycerides (mmol/L)2.09 ± 0.541.70 ± 0.690.163^b^ GGT (U/L)39.0072.0032.0038.000.076 Inflammatory markers ESR (mm/1 h)40.0028.0059.8029.600.020 Ferritin (ng/mL)280.00498.00400.00598.000.140 Procalcitonin (ng/mL)0.100.250.150.270.001 Lactate (mmol/L)1.300.541.500.920.210 LDH (U/L)281.50230.00389.00229.00 < 0.001 CRP (mg/l)37.4083.3083.00106.60 < 0.001 IL_6 (pg/mL)45.0074.5021.2088.900.574 Cardiac injury indicators Troponin (ng/mL)0.0080.0210.0080.1700.770 CK (U/L)130.000202.000115.500180.5000.720^a^Mann-Whitney U tests^b^Independent samples t-test
Notable differences in laboratory results were observed between severe and non-severe cases. Severe cases exhibited higher medians for white blood count (WBC) (6.8 × 10^9/L), absolute neutrophil count (ANC) (5.10 × 10^3/ul), and lower median absolute lymphocyte (ALC) (0.9 × 10^3/ µL). Furthermore, electrolyte and renal function markers in the severe group demonstrated differences, with a lower median sodium concentration (135 mEq/L) and a higher median creatinine level (87.5 µmol/L). Severe COVID-19 patients exhibited significantly higher medians of total bilirubin (9.3umol/l); alanine transaminase (ALT/SGPT) (37.5 U/L); and aspartate transaminase (AST/SGOT) (41 U/L) compared to non-severe patients. On the other hand, the median albumin level was lower in severe COVID-19 patients (31 g/l). Inflammatory markers such as erythrocyte sedimentation rate (ESR) (59.8 mm/1 h), lactate dehydrogenase (LDH) (389 U/L), procalcitonin (0.15 ng/mL), and C-reactive protein (CRP) (83 mg/l) were significantly higher in the severe COVID-19 group compared to the non-severe group (Table 4).
Multiple Logistic Regression
Table 5 presents results of the multivariable logistic regression analysis. Model 4, which included all significant study variables, provided the best fit to the data with a Pseudo R^2^ value of 0.738 based on McFadden estimates compared to 0.143 for Model 1 (sociodemographic characteristics, smoking history, and past medical history), 0.334 for Model 2 (symptoms, and clinical measures), and 0.156 for Model 3 (laboratory results).Table 5. Predictors for COVID-19 severity using multivariable logistic regressionaORCI (95%)p-valueModel 1: Sociodemographic characteristics, smoking history, and past medical history (N = 400)BMI: Normal1 Overweight1.3710.778,2.4160.275 Obese2.3831.332,4.2630.003 Area of residence (Dubai vs Sharjah/Ajman)2.1201.346,3.3390.001 Crowding (1–2 person/room vs 3 or more person/room)1.9191.144,3.2210.014 Smoking status (Non-smoker/former vs Current smoker)0.3670.182,0.7400.005 COVID-19 first dose vaccination (no vs yes)0.5950.377,0.9390.026* Pseudo R*^2^ = 0.143Model 2: Symptoms, and clinical measures (N = 673) Severe dehydration (no vs yes)3.2192.161,4.795 < 0.001 Fever (no vs yes)1.9901.272,3.1130.003 Cough or sore throat (no vs yes)1.6071.032,2.5020.036 Shortness of breath (no vs yes)1.9211.294,2.8530.001 Oxygen saturation0.8530.801,0.907 < 0.001 Duration from symptoms to admission1.0551.006,1.1050.026* Pseudo R*^2^ = 0.334Model 3: Laboratory results (N = 309) ANC1.2631.121,1.424 < 0.001 ALC0.5400.323,0.9050.019 Bilirubin1.0361.004,1.0690.026* Pseudo R*^2^ = 0.156Model 4: Sociodemographic characteristics, smoking history, past medical history, symptoms, clinical measures, and laboratory results (N = 127) BMI: Normal1 Overweight1.6780.376,7.4900.479 Obese14.0402.204,89.4500.005 Diabetes (no vs yes)11.1402.653,46,797 < 0.001 Severe dehydration (no vs yes)6.7221.678,26.9310.007 Cough or sore throat (no vs yes)5.3551.241,23.1170.025 AST/SGOT1.0551.016,1.0950.005* Pseudo R*^2^ = 0.738aOR adjusted odds ratioModel 1: Includes 13 variables as follows: gender, marital status, age, income, BMI, area of residence, crowding, smoking status, hypertension, diabetes, BCG, COVID-19 first dose vaccination, and COVID-19 s dose vaccinationModel 2: Includes 12 variables as follows: Duration from symptoms to admission, severe dehydration, fever, cough or sore throat, shortness of breath, abdominal pain, vomiting, runny nose, temperature, heart rate, respiratory rate, and oxygen saturationModel 3: Includes 11 variables as follows: WBC, ANC, ALC, Sodium, Creatinine, Albumin, Bilirubin, ALT/SGPT, AST/SGOT, Procalcitonin, and CRPModel 4: Includes 35 variables as follows: gender, marital status, age, income, BMI, area of residence, crowding, smoking status, hypertension, diabetes, BCG, COVID-19 first dose vaccination, COVID-19 s dose vaccination, severe dehydration, fever, cough or sore throat, shortness of breath, abdominal pain, vomiting, runny nose, temperature, heart rate, respiratory rate, oxygen saturation, WBC, ANC, ALC, Sodium, Creatinine, Albumin, Bilirubin, ALT/SGPT, AST/SGOT, Procalcitonin, and CR
In Model 1, predictors of worse COVID-19 severity were overweight (aOR 1.371; 95% CI: 0.778, 2.416), obesity (aOR 2.383; 95% CI 1.332, 4.263), area of residence (aOR 2.120; 95% CI 1.332, 4.263), and crowding (aOR 1.919; 95% CI 1.144, 3.221). However, protective factors of worse COVID-19 were smoking status (aOR 0.367; 95% CI 0.182, 0.740) and receiving the first dose of COVID-19 vaccination (aOR 0.595; 95%CI 0.377, 0.939).
Model 2 showed that severe dehydration (aOR 3.219; 95%CI 2.161, 4.795), cough or sore throat (aOR 1.607; 95%CI 1.032, 2.502), shortness of breath (aOR 1.921; 95%CI 1.294, 2.853) and the number of days from symptom onset to admission were associated with increased likelihood of worse COVID-19 (aOR 1.055; 95%CI 1.006, 1.105). On the other hand, for every one unit increase in oxygen saturation, the risk of worse COVID-19 severity decreased by 14.7% (aOR 0.853; 95%CI 0.801, 0.907).
In model 3, ANC and bilirubin levels were positively associated with COVID-19 severity. For every one-unit increase in ANC and bilirubin, the likelihood of worse COVID-19 severity increased by 26.3% (aOR 1.263; 95%CI 1.121, 1.424) and 3.6% (aOR 1.036; 95%CI 1.004, 1.069), respectively. On the other hand, for every one-unit increase in ALC, the odds of worse COVID-19 severity decreased by 46.0% (aOR 0.540; 95%CI 0.323, 0.905).
Model 4 revealed that diabetic patients were approximately 11 times more likely to have severe COVID-19 on admission (aOR 11.14; 95% CI 2.653–46, 797). Additionally, an increase in AST/SGOT was associated with a higher likelihood of severe COVID-19 (aOR 1.055, 95% CI 1.016, 1.095).
Discussion
While the WHO declares the end of the COVID pandemic, there remains a critical need to augment the body of evidence for future pandemic management strategies and emphasize the significance of ongoing comprehensive studies. This study provides insights into epidemiological characteristics, clinical aspects, laboratory features, and risk factors of COVID-19 patients hospitalized in the UAE.
Most patients in our study were classified as moderate to severe COVID-19 cases, with only about a third experiencing mild symptoms. This is consistent with a previous study in Abu Dhabi, UAE [17]. The lower percentage of mild hospitalized patients suggests that those with mild symptoms tend to manage their illness through self-care while hospitalization becomes necessary when symptoms worsen. Additionally, the relatively low occurrence of critical cases suggests it would be appropriate to group moderate, severe, and critical cases together as a single category, distinguishing them from patients’ mild symptoms.
Interestingly, our findings revealed that overcrowding was a risk factor for COVID-19 severity. This observation is consistent with a previous study from Canada that linked both the spread and severity of COVID-19 to crowded conditions [18]. Despite the UAE’s reputation as a financial centre with modern infrastructure, the country faces unique challenges due to its substantial population of migrants, including construction laborers, and domestic workers living in shared accommodations. Such living arrangements create an environment conducive to the rapid transmission of infectious diseases [7]. Implementing regulations that specify minimum space per person and ensure adequate ventilation in shared accommodations can play a crucial role in preventing infectious disease transmission and safeguarding the well-being of individuals.
Another interesting finding in our study was the potential protective effect of smoking against severe COVID-19. Traditionally, tobacco products have been associated with negative effects on lung function in individuals with infectious diseases [9]. However, in the case of COVID-19, studies have reported a lower risk of severe COVID-19 outcomes among smokers [10]. One possible mechanism proposed to explain this effect involves nicotine’s potential to reduce the release of pro-inflammatory cytokine [19]. Another probable explanation for the protective effect of smoking against severe COVID-19 in our study population could be related to selection factors. It is possible that smokers in our study were more hospitalized than non-smokers, even in cases when their symptoms were mild, creating an impression that smoking was protective. Nevertheless, the association with COVID-19 is intricate and warrants further investigation.
Consistent with previous findings, our study demonstrated that receiving the first dose of a COVID-19 vaccine provided protection against severe COVID-19. The initial vaccine dose triggers the immune system to produce antibodies and memory cells capable of combating the virus. [20]. While the development of the immune response may vary among individuals and takes time, most COVID-19 vaccines have proven highly effective in reducing hospitalization rates, disease severity, and mortality with just a single dose [21]. Even though our study included participants before the availability of COVID-19 vaccination, the protective impact of the UAE’s nationwide vaccination program was evident. The UAE achieved nationwide immunity by providing free COVID-19 vaccines to all residents and citizens, becoming the first nation to successfully vaccinate 100% of eligible population groups [22].
Our study also found that diabetes and obesity were associated with worse COVID-19 outcomes consistent with previous research [8]. Given the high prevalence of diabetes and obesity in the UAE, understanding the complicated and multidirectional relationship between these conditions and COVID-19 is crucial [23]. Both conditions are recognized as part of the same interconnected pathophysiological mechanism that influences COVID-19 outcomes. Obesity and diabetes can lead to chronic inflammation, compromised immune responses, and alterations in pulmonary function, all contributing to more severe disease outcomes [8, 24].
Regarding symptoms, our results revealed a significant association between COVID-19 severity and the duration of symptoms from onset to hospital admission, aligning with a European study [25]. This alignment suggests that the longer the duration of symptoms before hospitalization, the higher the likelihood of experiencing severe COVID-19 outcomes. Among our severe patients, the most common symptoms included fever, cough, shortness of breath, severe dehydration, and low oxygen saturation levels, indicating an association with acute respiratory distress syndrome (ARDS). ARDS is characterized by rapid breathing, shortness of breath, and reduced oxygen saturation. Dehydration in severe COVID-19 patients can result from viral infection of the gastrointestinal tract or reduced fluid intake due to loss of appetite, nausea, vomiting, or difficulty swallowing [26].
Severe COVID-19 patients in our study had elevated ANC levels and decreased ALC levels. These findings align with a previous meta-analysis, which demonstrated that elevated neutrophil count and decreased lymphocyte count at admission can predict COVID-19 severity [27]. It’s important to note that hospitalized patients may display abnormal laboratory results due to various factors such as systemic inflammation response syndrome, drug-induced liver injury, or multiorgan failure. Therefore, relying solely on these markers as a single biomarker predictor should be approached with caution [6]. One plausible explanation for these findings is that lymphocytes play a key role in regulation of the inflammatory response, and their loss due to persistent infection may lead to immune system suppression and the nonresolution of inflammation. Consequently, the medulla in the brain may produce more neutrophils to combat the invading pathogen [28].
The present study also revealed elevated levels of AST and total bilirubin in severe COVID-19 patients, indicating altercations in liver biochemistry. This association between severe COVID-19 infection and liver involvement has been reported in a systematic literature review conducted by Afra et al. [29]. AST levels typically indicate hepatocyte (liver cell) injury, while elevated bilirubin levels suggest bile duct damage. These markers serve as indicators for assessing the severity of liver involvement in COVID-19 patients and guiding appropriate management strategies. Several factors contribute to the progression of liver injury in COVID-19, including direct viral invasion of liver cells, cytokine storms that trigger liver inflammation and damage, and ischemia resulting from impaired blood flow to the liver [29, 30].
Strengths and Limitations
To the best of our knowledge, this study represents the first comprehensive examination of clinical and epidemiological characteristics of COVID-19 hospitalized patients in the UAE, encompassing multiple centres and spanning various phases of the pandemic. The study provides insights on potential risk factors associated with the severity of COVID-19, which can aid decision makers and inform population level public health strategies. Although prior infections and vaccinations have significantly reduced the overall risk of severe outcomes compared to the early stages of the pandemic, the risk factors identified in this study are likely to continue influencing relative risks in the future.
However, our study does have limitations. The clinical homogeneity of our study participants was compromised due to the 21-month period during which the clinical landscape of COVID-19 naturally evolved. The emergence of different variants of the virus across waves of the pandemic may have contributed to evolving clinical presentations of the disease over time. We were unable to consider the strains in our analysis since the data in the medical records of the four participating hospitals lacked this information. Furthermore, our study had low response rate, which was mostly attributed to the fact that many of the participants were non reachable expatriates who had left the country or changed their phone numbers. In addition, incomplete laboratory results exist as not all patients underwent the same battery of tests across participating hospitals. The absence of uniform data across all cases may affect the comprehensiveness of our analysis, potentially missing critical information that could further elucidate COVID-19 characteristics and risk factors. Moreover, our study may be susceptible to survival bias as it excluded individuals who passed away during the follow-up period. This exclusion may skew our findings towards less severe cases and fail to capture valuable insights into the full spectrum of COVID-19 severity.
However, while we acknowledge the constraints and potential biases inherent in our research, these limitations do not diminish the importance and knowledge gained from this study. Our findings offer insights that can significantly benefit our understanding and management of COVID-19.
Conclusion
Our findings highlight the association between crowding, obesity, diabetes, severe dehydration, cough or sore throat, shortness of breath, increased days from symptoms onset to admission, elevated ANC levels, and elevated AST/SGOT levels with an increased risk of severe COVID-19 symptoms. This underscores the importance of rigorous screening protocols in healthcare facilities, enabling early identification and intervention for individuals with these risk factors. Incorporating risk factors into surveillance protocols will help healthcare systems identify high risk individuals, allocate resources efficiently and respond rapidly to outbreaks ultimately improving public health outcomes.
Supplementary Information
Below is the link to the electronic supplementary material.Supplementary file1 (DOCX 88 KB)Supplementary file2 (DOCX 87 KB)
The reference list from the paper itself. Each links out to its DOI / PubMed record.
- 1WHO_a. World Health Organization (WHO). Statement on the fifteenth meeting of the IHR Emergency Committee on the COVID-19 pandemic. 2023 Accessed on 31/03/2023]; Available from: https://www.who.int/news/item/05-05-2023-statement-on-the-fifteenth-meeting-of-the-international-health-regulations- (2005)-emergency-committee-regarding-the-coronavirus-disease- (covid-19)-pandemic.
- 2Wordlometers. COVID-19 Coronavirus Pandemic. Reported Cases and Deaths by Country or Territory. 2023 Accessed on 20–06–2023]; Available from: https://www.worldometers.info/coronavirus/
- 3Docherty AB Features of 20 133 UK patients in hospital with covid-19 using the ISARIC WHO Clinical Characterisation Protocol: prospective observational cohort study BMJ 2020369 m 198510.1136/bmj.m 198532444460 PMC 7243036 · doi ↗ · pubmed ↗
- 4Huang C Clinical features of patients infected with 2019 novel coronavirus in Wuhan China Lancet 20203951022349750610.1016/S 0140-6736(20)30183-531986264 PMC 7159299 · doi ↗ · pubmed ↗
- 5Livingston E Bucher K Coronavirus disease 2019 (COVID-19) in Italy JAMA 2020323141335133510.1001/jama.2020.434432181795 · doi ↗ · pubmed ↗
- 6Tan JYA comparative study on the clinical features of COVID-19 with non-SARS-Co V-2 respiratory viral infections J Med Virol 20219331548155510.1002/jmv.2648632881022 · doi ↗ · pubmed ↗
- 7GMI. United Arab Emirates Ppopulation Statistics. 2023 Accessed on 20–06–2023]; Available from: https://www.globalmediainsight.com/blog/uae-population-statistics/#:~:text=Majority%20of%20the%20UAE%20population,for%20Dubai%20is%2033.5%20years.
- 8Al Bastaki NA An evaluation of non-communicable diseases and risk factors associated with COVID-19 disease severity in Dubai, United Arab Emirates: an observational retrospective study Int J Environ Res Public Health 202219211438110.3390/ijerph 19211438136361255 PMC 9659060 · doi ↗ · pubmed ↗