Correction to: Disruption of MAM integrity in mutant FUS oligodendroglial progenitors from hiPSCs
Yingli Zhu, Thibaut Burg, Katrien Neyrinck, Tim Vervliet, Fatemeharefeh Nami, Ellen Vervoort, Karan Ahuja, Maria Livia Sassano, Yoke Chin Chai, Arun Kumar Tharkeshwar, Jonathan De Smedt, Haibo Hu, Geert Bultynck, Patrizia Agostinis, Johannes V. Swinnen, Ludo Van Den Bosch

Abstract
Genes, proteins, chemicals, diseases, species, mutations and cell lines named across the full text — each resolved to its canonical identifier and authoritative record.
Click any figure to enlarge with its caption.
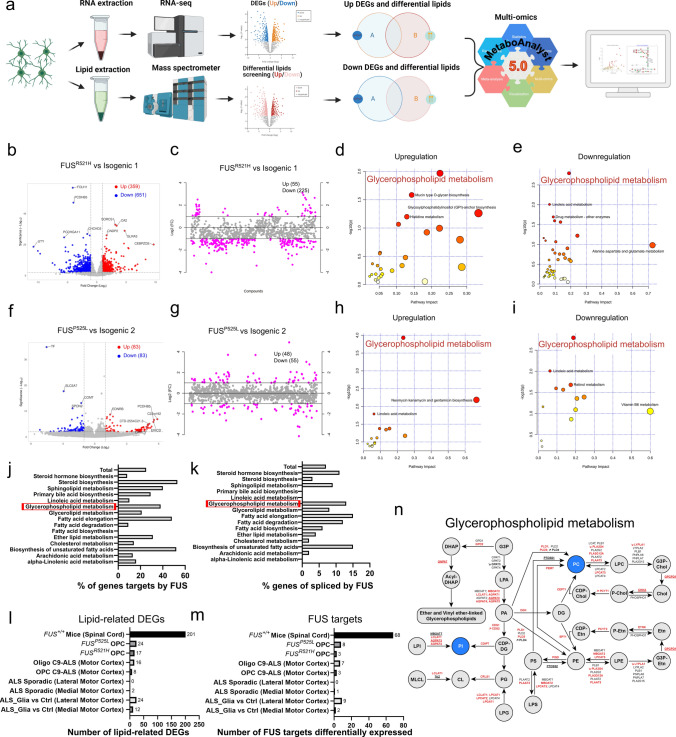 Figure 5
Peer Reviews
No public reviews on file for this paper yet. If you reviewed it on a platform where reviews are public (OpenReview, ICLR, NeurIPS, ICML), you can paste yours below so the community can read it here.
Videos
No videos yet. Explain this paper in a talk, walkthrough, or lecture? Add one.
Taxonomy
TopicsBrain Tumor Detection and Classification · S100 Proteins and Annexins · Cell Image Analysis Techniques
Correction to: Acta Neuropathologica (2024) 147:6 10.1007/s00401-023-02666-x
In Figure 5 of this article, the incorrect dataset has been used to compare FUS^R521H^ and Isogenic 1 OPCs. Hence, the data related to FUS^R521H^ OPC presented in Figure 5, panels l, m, and n are incorrect. The Fig. 5 (panels I, m and n) should have appeared as shown below.Fig. 5. Dysregulated glycerophospholipid metabolism in mutant FUS iPSC-derived OPCs. a Scheme of joint-pathway analysis. b, f Volcano plots of upregulated (red) and downregulated (blue) genes in FUS-mutant OPCs, compared to isogenic controls. Genes with log_2_FC < − 1.0 and − log_10_(p) > 2.0 were considered downregulated and log_2_FC > 1.0 with − log_10_(p) > 2.0 were considered upregulated. c,** g** Important dysregulated lipid species (red circles) selected by fold-change analysis. Both upregulated (log_2_FC > 1.0) and downregulated (log_2_FC < − 1.0) features are plotted in a symmetrical way. d, h,** e**,** i** Joint-pathway analysis (MetaboAnalyst v.5.0) shows upregulated and downregulated metabolic pathways in FUS-mutant OPCs, compared to isogenic controls. Each circle signifies a distinct pathway, with its size and shade reflecting the pathway’s impact and statistical significance (red denotes the highest significance). j, k Bar graphs displaying the percentage of known genes targeted by FUS (j) or spliced by FUS (k) within the different lipid-metabolism-related KEGG pathways (based on studies [12, 33, 37, 45, 64, 83]. l, m Bar graphs indicating the number of lipid-metabolism-related dysregulated genes (DEGs) (l) and the number of lipid-metabolism-related dysregulated genes that can be regulated by FUS (m) across previously published datasets compared to FUS-mutant OPCs. These datasets include bulk RNAseq data of the spinal cord from symptomatic FUS^+/+^ mice overexpressing wild-type human FUS compared to wild-type mice [79], single nuclei RNAseq data of primary human motor cortex OPCs/oligodendroglia of C9orf72-ALS patients compared with control human brain [50] and bulk RNAseq data of sporadic ALS patient motor cortex compared to control non-ALS control individuals [91], as well as between the so-called motor cortex of a ‘ALS_glia’ subtype group (identified by enriched astroglia, microglia and oligodendroglia dysregulated genes, and this even if—according to the authors—there was no selective neuronal loss) versus motor cortex all other sporadic ALS patients. n Scheme of glycerophospholipid metabolism, in which circles indicate metabolites and arrows indicate the enzymatic reaction with the gene name encoding the enzyme. Altered lipid classes in FUS-mutant OPCs are highlighted in blue, and arrows indicate whether the gene is upregulated or downregulated based on RNAseq data. Genes targeted by FUS are highlighted in red, while genes spliced by FUS are underlined
In the sentence beginning “Furthermore, we found 89 and 24 lipid-related” in this article, the text “Furthermore, we found 89 and 24 lipid-related genes aberrantly expressed in FUS^R521H^ and FUS^P525L^ OPCs, respectively (Figure 5l). Importantly, 30 lipid metabolism genes that can be regulated by FUS were found aberrantly expressed in the mutant FUS^R521H^ OPCs and 8 in the mutant FUS^P525L^ OPCs (Figure 5m)” should have read “Furthermore, we found 17 and 24 lipid-related genes aberrantly expressed in FUS^R521H^ and FUS^P525L^ OPCs, respectively (Fig. 5l). Notably, 3 lipid metabolism genes that can be regulated by FUS were found aberrantly expressed in the mutant FUS^R521H^ OPCs and 8 in the mutant FUS^P525L^ OPCs (Fig. 5m)."