Addendum: Big data driven perovskite solar cell stability analysis
Zhuang Zhang, Huanhuan Wang, T. Jesper Jacobsson, Jingshan Luo

Abstract
Click any figure to enlarge with its caption.
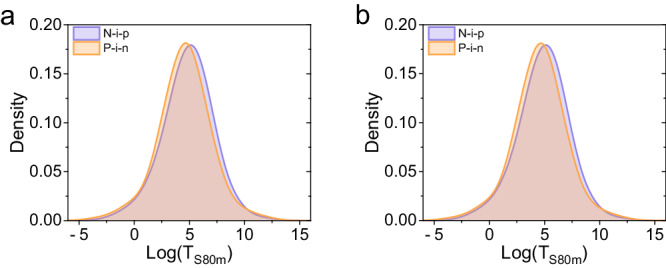 Figure 1
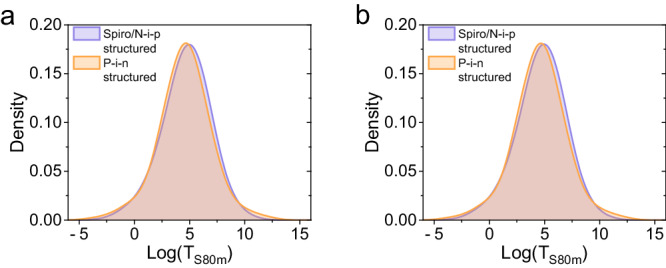 Figure 2
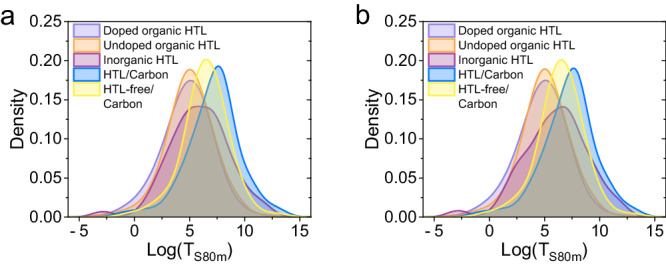 Figure 3
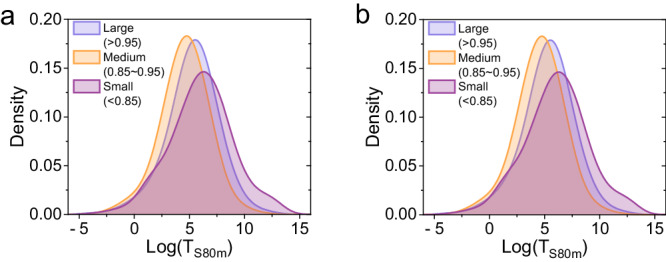 Figure 4
Peer Reviews
No public reviews on file for this paper yet. If you reviewed it on a platform where reviews are public (OpenReview, ICLR, NeurIPS, ICML), you can paste yours below so the community can read it here.
Videos
No videos yet. Explain this paper in a talk, walkthrough, or lecture? Add one.
Taxonomy
TopicsPerovskite Materials and Applications
Addendum to: Nature Communications 10.1038/s41467-022-35400-4, published online 10 December 2022
In the original version of the article, we developed a set of heuristics for comparing stability data, which was used to analyze the dataset from the Perovskite Database Project. After the initial publication, we received feedback from a reader and identified some errors in the original dataset. To ensure that those errors had no major influence on the conclusion, we checked the data carefully and rerun the analysis with the corrected data. The detailed results are listed below.
- The errors in the data we used to draw our conclusions come from the errors in the original database. Those existed when we downloaded the data from the Perovskite Database, and none of our operations (stability data extraction, statistical analysis, “data.m” file generation) changed the original data. After a careful check, we found 95 errors in the 7419 data points we used. Those are listed in the attached file, “data correction.xlsx”, and are primarily concerned with the “Cell_architecture” parameter, i.e. mostly either nip or pin.
- After correcting the errors, we rerun the analysis. The new results show negligible changes. This is what to be expected as only a small fraction of the dataset had the wrong cell_architecture label.
For the results related to the device architecture, the data correction resulted in small shifts in the average and variances and a slightly larger shift in the T_A_/T_B_ ratios. The analysis of the categories with more data, i.e. nip and pin (Tables 1 and 2) were less affected by the data correction, than those with fewer samples, e.g., inorganic HTL and doped organic HTL (Tables 3 and 4), which illustrates the importance of large dataset. There were no changes in the results for analyses not based on a separation of devices based on cell architecture, such as the analysis of the importance of the tolerance factor (Tables 5 and 6). To summarize, the data correction did not result in any changes in the conclusions.Table 1. Statistical results of n-i-p, spiro-based n-i-p, and p-i-n structured devices. (Before data correction)GroupSampleAverageVarianceSizeH0 acceptedμ**TA/TB ratio1N-i-p structuredw/o encapsulation4.8794.9213808Yes0.2111.235P-i-n structuredw/o encapsulation4.5575.39015962Spiro-basedN-i-p structuredw/o encapsulation4.6924.5762887Yes0.0211.022P-i-n structuredw/o encapsulation4.5575.3901596Table 2Statistical results of n-i-p, spiro-based n-i-p, and p-i-n structured devices. (After data correction)GroupSampleAverageVarianceSizeH0 acceptedμ**TA/TB ratio1N-i-p structuredw/o encapsulation4.8754.9333819Yes0.2051.227P-i-n structuredw/o encapsulation4.5605.38615772Spiro-basedN-i-p structuredw/o encapsulation4.6894.5782910Yes0.0161.016P-i-n structuredw/o encapsulation4.5605.3861577Table 3Statistical results of devices with different HTLs and electrodes. (Before data correction)GroupSampleAverageVarianceSizeH0 acceptedμ**TA/TB ratio1Undoped organic HTL5.0284.668341Yes0.0431.044Doped organic HTL4.7755.03630742Inorganic HTL5.8547.21957Yes0.5831.791Doped organic HTL4.7755.03630743HTL/Carbon7.1325.74594Yes1.9697.163Doped organic HTL4.7755.03630744HTL-free/Carbon6.4584.261257Yes1.4444.240Doped organic HTL4.7755.0363074Table 4Statistical results of devices with different HTLs and electrodes. (After data correction)GroupSampleAverageVarianceSizeH0 acceptedμ**TA/TB ratio1Undoped organic HTL5.0344.698337Yes0.0481.049Doped organic HTL4.7745.03831042Inorganic HTL5.9958.10549Yes0.6871.988Doped organic HTL4.7745.03831043HTL/Carbon7.1925.81396Yes2.0347.645Doped organic HTL4.7745.03831044HTL-free/Carbon6.4674.203258Yes1.4554.283Doped organic HTL4.7745.0383104Table 5Statistical results of devices with different tolerance factor regions. (Before data correction)GroupSampleAverageVarianceSizeH0 acceptedμ**TA/TB ratio1Large (>0.95)5.3005.3621691Yes0.6191.858Medium (0.85–0.95)4.5744.60936082Small (<0.85)6.0498.097402Yes1.2823.605Medium (0.85–0.95)4.5744.6093608Table 6Statistical results of devices with different tolerance factor regions. (After data correction)GroupSampleAverageVarianceSizeH0 acceptedμ**TA/TB ratio1Large (>0.95)5.3005.3621691Yes0.6191.858Medium (0.85–0.95)4.5744.60936082Small (<0.85)6.0498.097402Yes1.2823.605Medium (0.85–0.95)4.5744.6093608
Fig. 1. The kernel density estimation of the log(T_S80m_) values for n-i-p and p-i-n structured devices. a Before data correction. b After data correction.
Fig. 2. The kernel density estimation of the log(T_S80m_) values for spiro-based n-i-p structured devices and p-i-n structured devices. a Before data correction. b After data correction.
Fig. 3. The kernel density estimation of the log(T_S80m_) values for devices with different HTLs and electrodes. a Before data correction. b After data correction.
Fig. 4. The kernel density estimation of the log(T_S80m_) values for devices with different tolerance regions. a Before data correction. b After data correction.
- 3.A small number of errors in a large dataset is to be expected, especially for datasets based on manual human data extraction which is the case in the Perovskite Database. Moreover, a small amount of errors in a dataset usually does not change the validity of a statistical analysis more than somewhat widening the error bars. That is one of the advantages of big data. Errors are not limited to databases of device metrics, as also all experimental data have noise. Noise in a large heterogeneous dataset does usually not have a significant influence on the results as the errors average out each other and are dwarfed by the rest of the data.
To sum up, our work focuses on the development of a set of heuristics that can be used for a rough comparison of stability data. A small number of errors in the dataset used for the analysis does not negate the meaning and the value of this work. When a few errors were found in the original dataset, the question was raised whether or not this had affected the conclusions drawn from our analysis. We then checked and corrected the data and found that this did not influence the reliability of our analysis or the conclusions that were drawn from it. If something, this extra check supports the robustness of the analysis.