Correction to: Phytochemical library screening reveals betulinic acid as a novel Skp2‐SCF E3 ligase inhibitor in non–small cell lung cancer

Abstract
Genes, proteins, chemicals, diseases, species, mutations and cell lines named across the full text — each resolved to its canonical identifier and authoritative record.
Click any figure to enlarge with its caption.
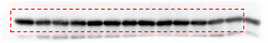 Figure 1
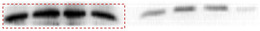 Figure 2
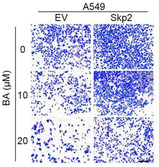 Figure 3
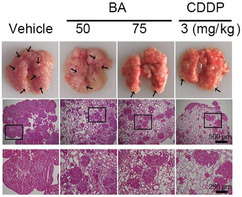 Figure 4
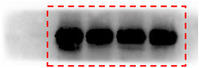 Figure 5
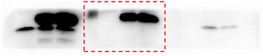 Figure 6
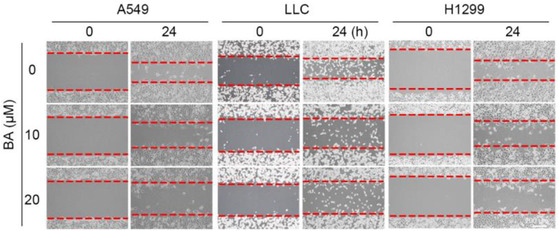 Figure 7
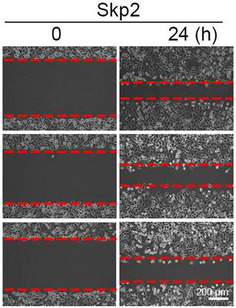 Figure 8
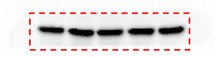 Figure 9
 Figure 10
Peer Reviews
No public reviews on file for this paper yet. If you reviewed it on a platform where reviews are public (OpenReview, ICLR, NeurIPS, ICML), you can paste yours below so the community can read it here.
Videos
No videos yet. Explain this paper in a talk, walkthrough, or lecture? Add one.
Taxonomy
TopicsNatural product bioactivities and synthesis · Tannin, Tannase and Anticancer Activities · Nitrogen and Sulfur Effects on Brassica
He D‐H, Chen Y‐F, Zhou Y‐L, et al. Phytochemical library screening reveals betulinic acid as a novel Skp2‐SCF E3 ligase inhibitor in non–small cell lung cancer. Cancer Sci. 2021;112: 3218–3232. https://doi.org/10.1111/cas.15005
In Figure 2, there were errors in the images (the boundaries of the bands are not smooth). The correct images (unmodified original blots) are shown below:
Figure 2C. Skp1 blot.
Figure 2C. Skp2 blot.
Figure 2D. Skp1 blot.
In Figure 3, there were errors in the images (the boundaries of the bands are not smooth). The correct images (unmodified original blots) are shown below:
Figure 3C. Flag blot.
Figure 3C. HA blot.
In Figure 5A, the middle panel was a duplicate of the left panel, and “LLC” and “H1299” were labeled wrongly. The correct images are shown below.
In Figure 6C, the images in the H1299‐Skp2‐24 h panel were wrong. The correct images are shown below.
In Figure 6E, the image of BA (μM)‐0 in the A549‐Skp2 panel was wrong. The correct images are shown below.
In Figure 7E, there was an error in the image (the boundaries of the bands are not smooth). The correct image (unmodified original blots) is shown below:
Figure 7E. GAPDH blot.
In Figure 7L, the H&E staining images in the BA‐50 group were wrong. The correct images are shown below.
The authors apologize for the errors.