Application of fused graphical lasso to statistical inference for multiple sparse precision matrices
Qiuyan Zhang, Lingrui Li, Hu Yang, Debo Cheng, Debo Cheng, Debo Cheng

TL;DR
This paper introduces a statistical method to estimate and test relationships in data from multiple groups, using a technique called fused graphical lasso.
Contribution
The novel contribution is extending fused graphical lasso for statistical inference across multiple sparse precision matrices with a de-biasing technique.
Findings
The fused graphical lasso estimator satisfies an oracle inequality in high-dimensional settings.
A de-biasing method enables hypothesis testing for linear combinations of precision matrix entries across groups.
Simulation and real data applications show the method performs well in high-dimensional scenarios.
Abstract
In this paper, the fused graphical lasso (FGL) method is used to estimate multiple precision matrices from multiple populations simultaneously. The lasso penalty in the FGL model is a restraint on sparsity of precision matrices, and a moderate penalty on the two precision matrices from distinct groups restrains the similar structure across multiple groups. In high-dimensional settings, an oracle inequality is provided for FGL estimators, which is necessary to establish the central limit law. We not only focus on point estimation of a precision matrix, but also work on hypothesis testing for a linear combination of the entries of multiple precision matrices. We apply a de-biasing technology, which is used to obtain a new consistent estimator with known distribution for implementing the statistical inference, and extend the statistical inference problem to multiple populations. The…
Genes, proteins, chemicals, diseases, species, mutations and cell lines named across the full text — each resolved to its canonical identifier and authoritative record.
Click any figure to enlarge with its caption.
 Figure 1
 Figure 2
 Figure 3
 Figure 4
 Figure 5
 Figure 6
 Figure 7
 Figure 8
 Figure 9
 Figure 10
 Figure 11
 Figure 12
 Figure 13
 Figure 14
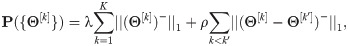 Figure 15
 Figure 16
 Figure 17
 Figure 18
 Figure 19
 Figure 20
 Figure 21
 Figure 22
 Figure 23
 Figure 24
 Figure 25
 Figure 26
 Figure 27
 Figure 28
 Figure 29
 Figure 30
 Figure 31
 Figure 32
 Figure 33
 Figure 34
 Figure 35
 Figure 36
 Figure 37
 Figure 38
 Figure 39
 Figure 40
 Figure 41
 Figure 42
 Figure 43
 Figure 44
 Figure 45
 Figure 46
 Figure 47
 Figure 48
 Figure 49
 Figure 50
Peer Reviews
No public reviews on file for this paper yet. If you reviewed it on a platform where reviews are public (OpenReview, ICLR, NeurIPS, ICML), you can paste yours below so the community can read it here.
Videos
No videos yet. Explain this paper in a talk, walkthrough, or lecture? Add one.
Taxonomy
TopicsStatistical Methods and Inference · Statistical Methods and Bayesian Inference · Bayesian Methods and Mixture Models