Data center TCP dataset
Jan Fesl, Tereza Čapková, Michal Konopa, Ladislav Beránek, Jan Fiala, Michal Houda, Petr Chládek, Jana Klicnarová, Radim Remeš, Marek Šulista, Klára Vocetková, Marie Feslová

TL;DR
This paper introduces a comprehensive dataset of TCP network flows in data centers, useful for comparing TCP versions and developing machine learning models.
Contribution
The paper presents a unique dataset comparing 17 TCP versions with different congestion control algorithms.
Findings
The dataset includes 50 measurements per TCP flow to ensure stability.
18 quantitative attributes are used to compare TCP versions.
The dataset supports testing, optimization, and machine learning model development for TCP.
Abstract
In this paper, we would like to introduce a unique dataset that covers thousands of network flow measurements realized through TCP in a data center environment. The TCP protocol is widely used for reliable data transfers and has many different versions. The various versions of TCP are specific in how they deal with link congestion through the congestion control algorithm (CCA). Our dataset represents a unique, comprehensive comparison of the 17 currently used versions of TCP with different CCAs. Each TCP flow was measured precisely 50 times to eliminate the measurement instability. The comparison of the various TCP versions is based on the knowledge of 18 quantitative attributes representing the parameters of a TCP transmission. Our dataset is suitable for testing and comparing different versions of TCP, creating new CCAs based on machine learning models, or creating and testing machine…
Genes, proteins, chemicals, diseases, species, mutations and cell lines named across the full text — each resolved to its canonical identifier and authoritative record.
Click any figure to enlarge with its caption.
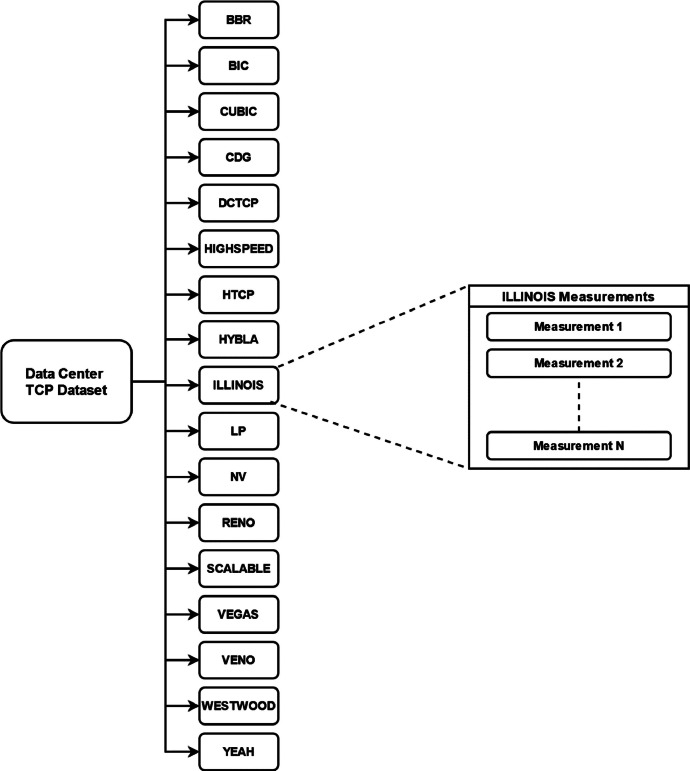 Figure 1
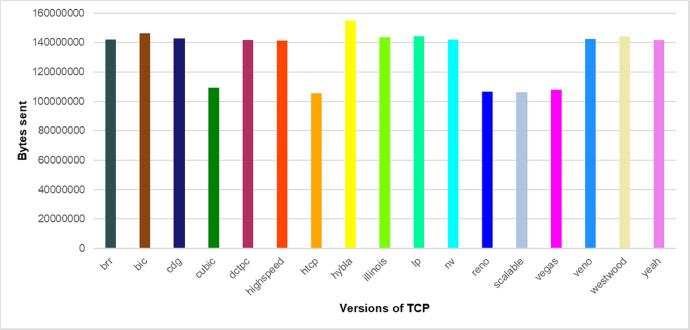 Figure 2
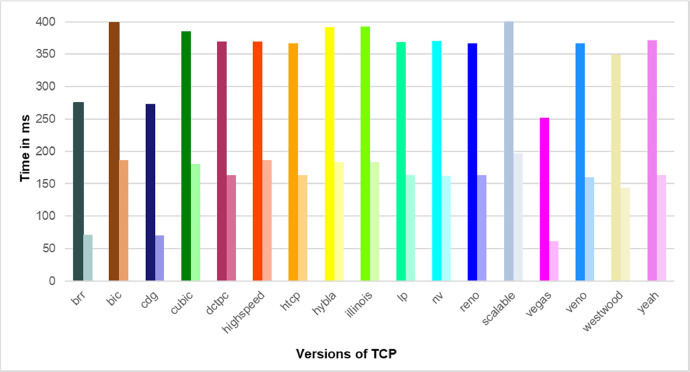 Figure 3
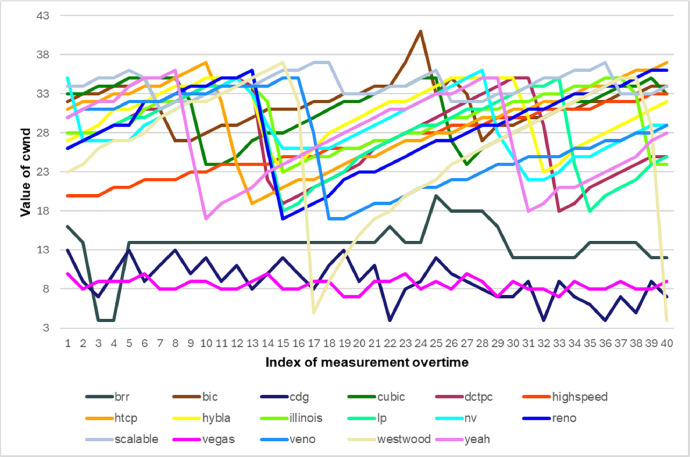 Figure 4
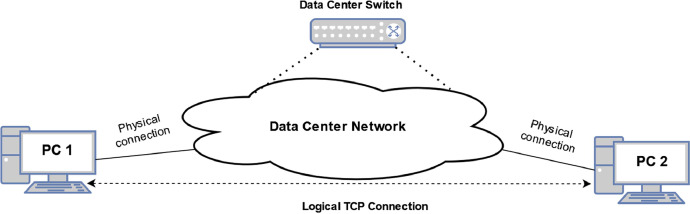 Figure 5
Peer Reviews
No public reviews on file for this paper yet. If you reviewed it on a platform where reviews are public (OpenReview, ICLR, NeurIPS, ICML), you can paste yours below so the community can read it here.
Videos
No videos yet. Explain this paper in a talk, walkthrough, or lecture? Add one.
Taxonomy
TopicsNetwork Traffic and Congestion Control · Software-Defined Networks and 5G · Advanced Optical Network Technologies
Specifications TableSubjectComputer Networks and CommunicationsComputer ScienceMachine LearningSpecific subject areaData from a real network traffic based on 17 different versions of TCP measured as a consequence of a 20-dimensional vector.Type of dataTextual (Compressed CSV files)How the data were acquiredThe data was acquired from real network BSD Sockets, which provided two-sided TCP communication. The data was parsed and retransformed in easily-readable CSV files.Data formatRAWDescription of data collectionThe data was measured for approximately three months within the real computer network consisting of active network devices, i.e., routers and switches connected to the optic communication lines. The average achieved network throughput was in units of megabytes per second.Data source locationUniversity of South BohemiaFaculty of Economics, Department of Applied Mathematics and InformaticsStudentská 13, České BudějoviceCzech RepublicGPS: 48.978843867004386, 14.451743105975511Data accessibilityRepository name: ZenodoData identification number: 10.5281/zenodo.10894768Direct URL to data: https://zenodo.org/records/10894768The dataset is freely available for usage without limitation.
Value of the Data
1
- •TCP version comparison and suitability for data center (DC) networks.
- •The dataset [1] contains sufficient samples to train machine learning models designed to identify the used CAA.
- •Data analysts or network engineer experts can use the dataset.
- •The dataset can be a benchmark for comparing the quality of different CAA algorithms.
- •The use of the dataset lies in the possibility of speeding up the research, as it took three months to acquire and many people to gather resources for the dataset assembly and verification.
- •The dataset is free of malicious content and is freely distributable*.*
Background
2
The main reason and motivation for creating this dataset was the possibility of comparing different versions of TCP in the sense of considering their usability in the environment of real data centers (DCs).
Currently, there exist many versions of TCP based on various principles.
Examples of traditional round trip time (RTT) based TCPs are NewReno [2], Cubic [3], BBR [4], Vegas [5], Low-Priority [6], and New Vegas [7]).
Data Center TCP (DTCP) [8] and SDTCP [9] are the first examples of TCP variants proposed especially for data centers (DCs). Another example of a TCP research initiative is the OpenTCP variant [10] proposed explicitly for SDN-based DC networks.
TCP versions (such as Hybla [11], Illinois [12], BIC [13], NewReno [14], Westwood+ [15], Veno [16], HighSpeed [17], Scalable [18], YeAH [19], and HTCP [20]) use various criteria (achievable throughput, RTT, fairness, friendliness, or compatibility with other protocols).
Based on our best knowledge, no similar data set exists that provides similar information freely available for download.
Data Description
3
The basic structure of our dataset is shown in Fig. 1. The dataset is divided into a total of 17 different subdirectories that represent measurements of one TCP protocol variant. All measurements were performed under the same conditions, with line capacity reserved only for that measurement. The link capacity was deliberately limited to 16 Mbps to make it easy to achieve link congestion or to skew the corresponding CAA. All measurements were repeated 50 times to eliminate measurement errors. Each measurement is stored in a single CSV file.Fig. 1. Data Center TCP Dataset structure. The dataset contains data of measurements from 17 different versions of TCP.Fig. 1
Each CSV file contains a specific TCP flow measurement with a duration of approx. 15 min of data records. A vector of 18 parameters represents each record of measurement. The meaning and explanation of all parameters are presented in Table 1.Table 1. The vector of classification parameters is preprocessed for each TCP stream in the dataset.Table 1. NumNameMeaning1wscaleThe TCP window scale option is an option to increase the receive window size allowed in TCPl above its former maximum value of 65,535 bytes.2rtoRetransmission time out (rto) is the time set for acknowledgment of a particular packet to be received; after this time, the packet is declared lost and retransmitted. This value is in milliseconds.3rttRound-trip time (rtt), also known as the round-trip delay time, is defined as a metric that measures the amount of time it takes for a data packet to be sent plus the amount of time it takes for an acknowledgment of that packet to be received. The value represents the average rtt in milliseconds.4pmtuPath maximum transfer unit (pmtu) is the maximum transmission unit (mtu) size on the network path between two Internet Protocol (IP) hosts, usually with the goal of avoiding IP fragmentation.5rmssThe receiver maximum segment size (rmss) is the size of the largest segment the receiver is willing to accept. This is the value specified in the MSS option sent by the receiver during connection startup.6advmssThe number of bytes advertised in the MSS option to the receiver during connection establishment and, therefore, the maximum segment size that will be sent from the sender.7cwndCongestion Window (cwnd) is the amount of data the TCP can send before receiving an acknowledgment packet (ACK).8ssthreshThe slow start threshold (ssthresh) value determines the (de)activation of TCP slow start.9bytes_sentThe number of bytes sent from the sender to the receiver. Starts from 0. This value is cumulative.10bytes_retransThe number of resent bytes from the sender to the receiver. This value is cumulative.11bytes_ackedThe number of received bytes confirmed by the receiver to the server. This value is cumulative.12segs_outThe number of TCP segments sent from the sender to the receiver. This value is cumulative.13segs_inThe number of TCP segments received by the sender from the receiver. This value is cumulative.14data_segs_outThe number of sent segments from the sender to the receiver containing a positive length data segment. This value is cumulative.15lastrcvHow much time since the TCP flow start has elapsed in milliseconds.16deliveredThe count of TCP segments sent and confirmed by the receiver. This value is cumulative.17rcv_spaceValue in bytes used in TCPʼs internal auto-tuning to grow socket buffers based on how much data the kernel estimates the sender can send.18rcv_ssthreshThe size of sshthresh at the receiver side.
In total, the data set contains 8350 different measurements for 17 different TCP versions. The total time of pure measurement was approximately more than 5 days.
The graphs below show a partial information overview that can be retrieved from our dataset. In Fig. 2, there is an overall comparison of sent bytes by various versions of TCP. Our measurements show TCP Hybla can send the maximum amount of data. Fig. 3 shows the different combinations of values for rtt and rto during the measurement runtime. Rtt resp. rto values are important for setting the cwnd value computed by a specific CAA. Finally, Fig. 4 depicts a comparison of different cwnd value changes for different TCP versions during the measurement. The correct cwnd value is important for communication line congestion avoidance.Fig. 2. The comparison of the total amount of sent bytes by various versions of TCP during 15 min (each column represents a specific TCP version). Some TCP versions substantially exceed the others.Fig. 2. Fig. 3The comparison of rto/rtt values. Each couple of columns represents the rto/rtt values achieved for a specific TCP version. Rto/rtt values fundamentally impact the correct settings of the cwnd value.Fig. 3. Fig. 4The comparison of cwnd values for various versions of TCP. Cwnd value directly affects the communication line congestion.Fig. 4
Experimental Design, Materials, and Methods
4
This section describes how we gathered the data and used the environment. The DC environment topology is depicted in Fig. 5. A physical connection between two desktops and the DC network was established. The line capacity between PC1 and PC2 was limited to 16 Mbps at Data Center Switch due to the easy establishment of the line congestion. The line capacity between PC1 and PC2 was isolated and guaranteed for the entire measurement time.Fig. 5TCP flow measurement scheme. The line capacity limitation achieved the line congestion.Fig. 5
The measurements were technically performed in the following scenario. PC1 and PC2 contained the installed operating system Debian 11 with an installed package of the Iperf 3 tool and socket statistics (ss) tool. The Iperf 3 tool is currently considered a standard tool for network throughput measurement. The tool allows us to set many parameters, like the transport protocol (TCP or UDP), the number of parallel connections, maximum measurement time, etc. The ss tool was used during the measurement time to get values for parameters related to the specific TCP connection. The data retrieved by ss was periodically stored in a log file. The meaning of all TCP connection parameters it is possible to find in Table 1.
All measurements were performed separately in batches for each TCP version. Before the measurement started, the required TCP version was specified as the Linux kernel parameter in the /proc/sys/net/ipv4/tcp_congestion_control file. In this case, the kernel version 5.10.1 was used.
Each TCP batch measurement was performed in this way:
- 1.Immediately before the execution of the Iperf 3 tool, an executed ss tool started storing the TCP connection statistics into a textual log file. The Iperf 3 tool always created just only one logical TCP connection.
- 2.The step 1 was repeated 50 times.
- 3.CSV files suitable for the subsequent processing were generated from all log files. All CSV files were inserted into the data set.
Limitations
None.
Ethics Statement
Our work does not involve studies with animals and humans.
CRediT authorship contribution statement
Jan Fesl: Data curation, Conceptualization, Methodology, Writing – original draft, Supervision. Tereza Čapková: Visualization. Michal Konopa: Software. Ladislav Beránek: Methodology. Jan Fiala: Data curation. Michal Houda: Data curation. Petr Chládek: Data curation. Jana Klicnarová: Methodology, Supervision. Radim Remeš: Software. Marek Šulista: Data curation. Klára Vocetková: Data curation. Marie Feslová: Visualization, Data curation.
The reference list from the paper itself. Each links out to its DOI / PubMed record.
- 1Department of Applied Mathematics and Informatics; Faculty of Economics; University of South Bohemia, Data center TCP Dataset, Available on-line, https://zenodo.org/records/10894768.
- 2Stevens M.first ed.TCP/IP Illustrated 11994 Addison Wesley
- 3Ha S.Rhee I.Xu L.CUBIC: a new TCP-friendly high-speed TCP variant SIGOPS Oper. Syst. Rev.42520086474
- 4Cardwell N.Cheng Y.Gunn C.S.Yeganeh S.H.Jacobson V.BBR: congestion-based congestion control Queue 145201650:20–50:53
- 5Brakmo L.S.O'Malley S.W.Peterson L.L.Vegas T.C.P.New Techniques for Congestion Detection and Avoidance 1994 SIGCOMM
- 6Kuzmanovic A.Knightly E.W.TCP-LP: a distributed algorithm for low priority data transfer IEEE INFOCOM 2003. Twenty-second Annual Joint Conference of the IEEE Computer and Communications Societies (IEEE Cat. No.03CH 37428)San Francisco, CA, USA 320031691170110.1109/INFCOM.2003.1209192 · doi ↗
- 7Sing J.Soh B.TCP New Vegas: performance evaluation and validation 11th IEEE Symposium on Computers and Communications (ISCC'06)Cagliari, Italy 200654154610.1109/ISCC.2006.159 · doi ↗
- 8Alizadeh M.Greenberg A.Maltz D.A.Padhye J.Patel P.Prabhakar B.Sengupta S.Sridharan M.DCTCP: Efficient Packet Transport for the Commoditized Data Center 2010 Microsoft Research publications