Soleus Muscle H-reflex: Reference Data of Adult Population From a Tertiary Care Center in India
Binay K Pandey, Ashok Kumar, Abhay Ranjan, Josni Pandey

TL;DR
This study provides reference data for the H reflex in the soleus muscle of adults from a tertiary care center in India.
Contribution
The study establishes reference ranges for H-reflex latency in a large Indian adult population.
Findings
The average H-reflex latency was 28.18 ms on the right and 28.14 ms on the left.
Reference ranges were established for different age, height, and BMI groups.
The study included a large sample size with balanced gender representation.
Abstract
Introduction The Hoffmann reflex (H reflex) is one of the most studied reflexes in human neurophysiological literature. Detection of the H reflex is useful in the diagnosis of early polyneuropathy, S1 radiculopathy, early GBS, tibial neuropathy and sciatica, and sacral plexopathy. The H reflex is also used as a tool to measure the excitability of the nervous components of the arc, regardless of the sensitivity of the sensory organs. The monosynaptic nature of reflex circuits makes H-reflex an attractive tool for clinical neurophysiology and research. Objective The objective is to create reference data of soleus H-reflex latency in an adult population from a tertiary care center in India. Materials and methods Seven hundred eighty-four healthy volunteers underwent a physical examination and brief electrophysiological examination before elicitation of the soleus H reflex of both…
Genes, proteins, chemicals, diseases, species, mutations and cell lines named across the full text — each resolved to its canonical identifier and authoritative record.
Click any figure to enlarge with its caption.
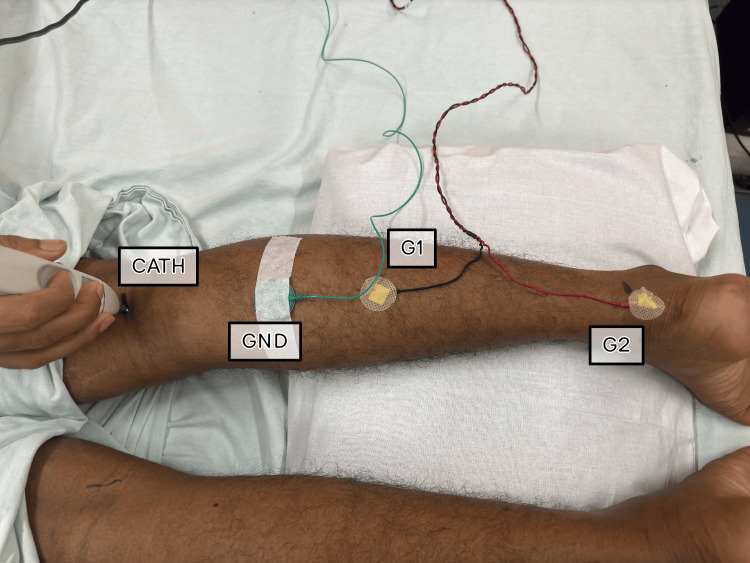 Figure 1
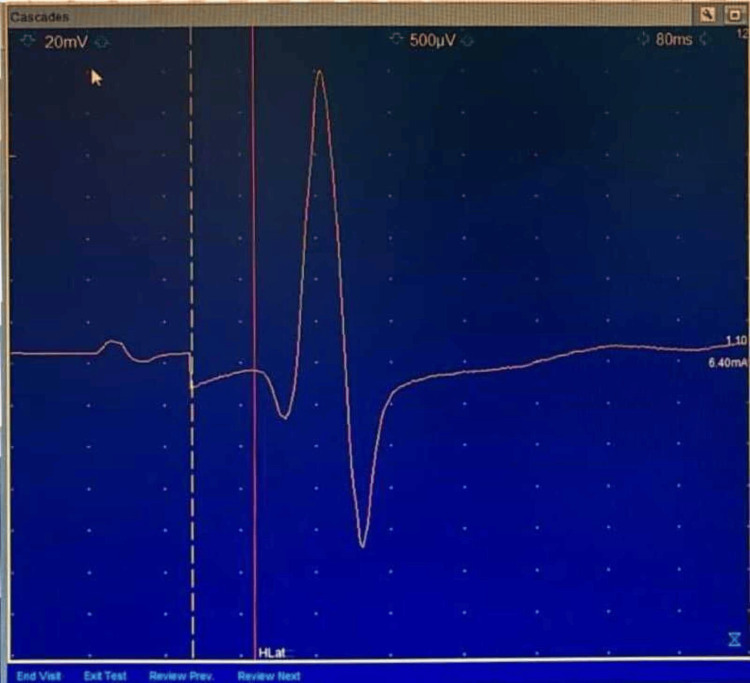 Figure 2
| Basic Data | Male (N=438) | Female (N=346) | Total (N= 784) |
| Mean ± SD | Mean ± SD | Mean ± SD | |
| Age (years) | 40.46 ± 14.76 | 41.63 ± 13.49 | 40.97 ± 14.22 |
| Height (cm) | 172.06 ± 4.22 | 159.12 ± 2.42 | 166.35 ± 7.34 |
| Body Weight (kg) | 73.32 ± 10.28 | 62.91 ± 7.46 | 68.73 ± 10.50 |
| BMI (kg/m2) | 24.74 ± 3.21 | 24.84 ± 2.85 | 24.78 ± 3.06 |
| Characteristics | Group | Parameters |
| Age (years) | Group 1. Young Adults | 18 to 35 |
| Group 2. Middle Aged | 36 to 55 | |
| Group 3. Older Adults | 56 and above | |
| Gender | Group 0 | Male |
| Group 1 | Female | |
| BMI (kg/m2) | Group 1. Underweight | Less than 18.5 |
| Group 2. Healthy weight | 18.5 to 24.9 | |
| Group 3. Overweight | 25 to 29.9 | |
| Group 4. Obese | More than 30 | |
| Height (cm) | Group 1 | Less than 160 |
| Group 2 | 160 to 169 | |
| Group 3 | 170 to 179 | |
| Group 4 | Equal to and more than 180 |
| Age Groups | N | Mean ± SD | Percentiles (3rd – 97th) | ||
| Right | Left | Right | Left | ||
| Group 1. Young Adults | 305 | 27.46 ± 2.19 | 27.36 ± 2.42 | 22.86-30.80 | 22.86-31.88 |
| Group 2. Middle Aged | 327 | 28.38 ± 2.75 | 28.29 ± 2.84 | 23.39-35.10 | 23.54-35.39 |
| Group 3. Older Adults | 152 | 29.23 ± 2.45 | 29.36 ± 2.41 | 24.79-34.22 | 25.35-33.59 |
| Total | 784 | 28.16 ± 2.61 | 28.14 ± 2.70 | NA | NA |
| Height Groups (cm) | N | Mean ± SD | Percentiles (3rd – 97th) | ||
| Right | Left | Right | Left | ||
| Group 1. < 160 | 339 | 27.81 ± 2.60 | 27.73 ± 2.83 | 23.33-32.55 | 22.60-32.86 |
| Group 2. 160-169 | 64 | 28.23 ± 2.39 | 28.46 ± 2.44 | 24.27-33.44 | 23.80-33.39 |
| Group 3. 170-179 | 373 | 28.44 ± 2.61 | 28.42 ± 2.56 | 24.79-35.00 | 24.53-34.79 |
| Group 4. ≥ 180 | 8 | 29.51 ± 2.60 | 29.49 ± 3.46 | 25.47-33.44 | 23.85-34.79 |
| Total | 784 | 28.16 ± 2.60 | 28.13 ± 2.70 | NA | NA |
| BMI Groups (kg/m2) | N | Mean ± SD | Percentiles (3rd – 97th) | ||
| Right | Left | Right | Left | ||
| Group 1. Underweight | 36 | 26.92 ± 2.33 | 26.98 ± 2.23 | 20.89-29.84 | 23.28-30.10 |
| Group 2. Healthy | 331 | 27.87 ± 2.47 | 27.87 ± 2.58 | 23.44-33.44 | 23.49-34.79 |
| Group 3. Overweight | 390 | 28.47 ± 2.68 | 28.42 ± 2.79 | 23.39-34.48 | 22.86-34.79 |
| Group 4. Obese | 27 | 28.78 ± 2.50 | 28.83 ± 2.67 | 23.39-34.58 | 23.85-37.10 |
| Total | 784 | 28.16 ± 2.60 | 28.14 ± 2.71 | NA | NA |
| Gender | N | Mean ± SD | Percentiles (3rd – 97th) | ||
| Right | Left | Right | Left | ||
| Female | 346 | 27.88 ± 2.45 | 27.83 ± 2.69 | 23.39-32.50 | 22.86-32.86 |
| Male | 438 | 28.38 ± 2.70 | 28.38 ± 2.70 | 23.75-34.22 | 23.54-34.79 |
| Total | 784 | 28.16 ± 2.60 | 28.14 ± 2.71 | NA | NA |
| Study | N | Soleus H-reflex latency |
| Present Study | 784 | 28.2 ± 2.6 |
| Khosrawi et al. [ | 75 | 27.94 ± 1.6 |
| Palve et al. [ | 150 | 24.3‑32.0 |
| Huang et al. [ | 101 | 28.4 ± 1.6 |
| Kimura [ | NA | 29.5 ± 2.4 |
| Buschbacher [ | 251 | 30.3 ± 2.4 |
Peer Reviews
No public reviews on file for this paper yet. If you reviewed it on a platform where reviews are public (OpenReview, ICLR, NeurIPS, ICML), you can paste yours below so the community can read it here.
Videos
No videos yet. Explain this paper in a talk, walkthrough, or lecture? Add one.
Taxonomy
TopicsHeart Rate Variability and Autonomic Control · Cardiovascular Syncope and Autonomic Disorders · Transcranial Magnetic Stimulation Studies
Introduction
The Hoffmann reflex (H reflex) is an electrically induced reflex that corresponds to the mechanically induced spinal stretch reflex, first described by Paul Hoffmann in 1910. The main difference between the H-reflex and the spinal stretch reflex is that the H-reflex bypasses muscle spindles. It is a valuable tool for assessing the regulation of monosynaptic reflex activity in the spinal cord. The H-reflex is an estimate of alpha motor neuron (αMN) excitability when alpha motor neuron (αMN) presynaptic inhibition and intrinsic excitability remain constant [1,2]. This measurement can be used to assess the response of the nervous system to various neurological diseases, musculoskeletal injuries, treatment use, pain, physical training, and performance of motor tasks [2].
Indira Gandhi Institute of Medical Sciences (IGIMS), Patna, is an autonomous tertiary care institute. Due to the lack of population-specific reference values, the institute relies on data from textbooks or the literature. So, there was a need to generate its' own reference data.
Many of the previous studies have methodological limitations like inadequate sample size, biased sampling, and used conventional statistical analysis, etc. Normative Data Task Force (NDTF) formed by the American Association of Neuromuscular & Electrodiagnostic Medicine (AANEM) developed a set of quality criteria to define the important methodological issues required of studies that investigate nerve conduction normative values [3]. These criteria can serve as benchmarks for future normative studies. The present study has taken into consideration these criteria to generate reference data.
Materials and methods
After obtaining approval from the Institutional Ethics Committee (1614/IEC/IGIMS/2020), healthy volunteers, who gave their written consent, were evaluated and included in the study if they met the pertinent inclusion criteria. The study was conducted between June 2020 and February 2023. Participants were recruited from the inhabitants of the IGIMS residential complex as well as the community dwellers apart from the persons accompanying the patients.
All the participants underwent a detailed comprehensive neurological examination [4]. A brief electrophysiological evaluation was also done for each participant using the standard techniques to rule out asymptomatic polyneuropathy [5].
The Neurological examination included manual muscle testing, deep tendon reflexes, sensation for vibration, pinprick, temperature, light touch and proprioception, gait, and tandem gait. Physical examination result was considered abnormal if there was any degree of weakness, decreased or absent reflexes, decreased or absent sensation for any sensory modality, and any gait abnormality. For individuals with no symptoms of peripheral neuropathy, a normal clinical neurological examination, and normal electrophysiological evaluation were included.
Individuals with a history of lumbosacral radiculopathy, diabetes mellitus, hypothyroid, any neurological or neuromuscular transmission disorder, history of alcoholism, smoking, or taking any drug known to cause neuropathy were excluded.
Height and weight were measured using a stadiometer and digital weighing machine respectively. Body Mass Index (BMI) was calculated by dividing weight in kilograms by height in meter square. Age to the nearest year was recorded. Skin temperature was recorded bilaterally at the mid-popliteal crease using a digital dual-input K-type thermometer. The limb temperature was kept at 33 to 34 degrees Celsius throughout the evaluation [6].
Recording technique
Preparation of the skin was done to reduce the skin impedance and if required, the skin was shaved before fixing the electrodes.
Position of the subjects
Soleus H-reflex latency was recorded with participants in a prone lying position in a quiet room on a comfortable examination table. The head was maintained in mid position to control the possible effect of asymmetrical tonic reflex. The knee was slightly flexed to about 20 degrees by placing a pillow under the leg, and the ankle was freely positioned in the plantarflexed position to relax the gastrocnemius to help reduce any depressive influence on H-reflex.
Position of the electrodes
For eliciting Soleus H-reflex, a Nicolet Viking Quest machine was used. While eliciting Soleus H- reflex subjects were placed prone. The knee was passively flexed to locate and mark the popliteal crease. The lower leg was then lowered onto a pillow with the foot hanging over the edge of the table for optimal relaxation. A second mark was placed on the posterior calcaneus. The distance between these points was measured, and the active electrode (G1) was placed midway between the marks. The reference electrode (G2) was placed over the posterior calcaneus. The ground electrode (GND) was placed proximally to the active electrode (Figure 1).
Position of the Subject, and Position of the electrodesG1: Active Electrode, G2: Reference Electrode, GND: Ground Electrode, CATH: Cathode
Stimulation
Submaximal stimuli were applied at the mid-popliteal crease at a stimulus duration of 1 ms, with the cathode proximal to avoid the anodal block. Stimuli were applied at approximately five-second intervals at random to avoid habituation errors. Sensitivity was kept at 500 microvolt/division, low-frequency filter at 2-3 Hz, High-frequency filter at 10 kHz, and sweep at 10 millisecond/division. Stimulus intensity was adjusted to obtain the maximal amplitude, and the latency to the first deflection from the baseline. Soleus H-reflex latency was measured from the beginning of the 1 ms stimulus to the take-off of the H wave from baseline (Figure 2).
A typical H-Reflex
Statistical analysis
Statistical analysis was done using IBM SPSS Statistics for Windows, Version 26.0 (IBM Corp., Armonk, NY). Continuous variables were reported as mean and standard deviation as well as in different quantiles.
Results
The study participants included 346 (44.1%) women and 438 (55.9%) men between the age group of 18 to 65 years. The mean age of men was 40.46 ± 14.76 years, and that of women was 41.63 ± 13.49 years. The average weight of the men was 73.32 ± 10.28 kg, and the women were 62.91 ± 7.46 kg. The average height of the men was 172.06 ± 4.22 cm, and the women were 159.12 ± 2.42 cm (Table 1). Participants were divided into various groups as per their age, height, body mass index, and gender (Table 2).
The average right Soleus H-reflex latency and left Soleus H-reflex latency were 28.18 ± 2.59 ms and 28.14 ± 2.70 ms, respectively. The third and 97th percentiles for Soleus H- reflex latency on the right side was 22.86 ms to 34.22 ms and on the left side was 22.86 ms to 35.39 ms. Detailed reference data for various age, height, and BMI groups are presented in Tables 3-6.
Table 3 summarizes the soleus H-reflex latency measures for three age groups: young adults (Group 1), middle-aged (Group 2), and older adults (Group 3). The mean H-reflex latency values varied from 27.46 ms to 29.23 ms across age groups, with standard deviations ranging from 2.19 ms to 2.75 ms.
In terms of percentiles, the third to 97th percentile ranges varied by age group on both the right and left sides. For example, in Group 1 (Young Adults), the third to 97th percentile range for the right side was 22.86 ms to 30.80 ms, whereas the left side ranged from 22.86 to 31.88 ms. Similarly, in Group 3 (Older Adults), the comparable ranges were 24.79 ms to 34.22 ms on the right side and 25.35 ms to 33.59 ms on the left.
Overall, the study shows that soleus H-reflex latency increases with age, with older persons having higher latency than young and middle-aged adults. However, there is variation within each age group, as evidenced by the standard deviation and percentile distributions.
Each group represents a variety of heights, allowing for comparisons between height groups. N (Number of Participants) refers to the sample size for each height category. The Mean ± SD (Standard Deviation) represents the average soleus H-reflex latency for both the right and left sides, as well as the standard deviation for each height group. Percentiles (third - 97th) shows the range in which a specific percentage of the data falls for each height group.
The mean soleus H-reflex latency tends to rise significantly with increasing height groups, as seen by the trend from Group 1 to Group 4. Standard deviations within each height group provide information on the variability of H-reflex latency data. The standard deviations are generally constant across height categories, indicating similar degrees of variability within each group.
Group 4 (≥ 180 cm) has the greatest mean H-reflex latency values, indicating that taller persons may have slightly longer latencies than shorter individuals. Group 4 (≥ 180 cm) has a limited sample size (N = 8), potentially affecting the credibility of the standard deviation estimate.
Overall, the data show that as height increases, the mean soleus H-reflex latency values tend to increase significantly. For example, the average H-reflex latency rises from 27.81 ms in the “< 160 cm” group to 29.51 ms in the “≥ 180 cm” group. The “≥ 180 cm” group has a small sample size (N = 8), which may limit the findings' generalizability.
These data imply a possible link between height and soleus H-reflex latency, with taller people having slightly longer H-reflex latencies. The data show that as BMI increases from underweight to obese, the mean soleus H-reflex latency values rise. For example, the average H-reflex latency rises from 26.92 ms in the underweight group to 28.78 ms in the obese group. However, it is worth noting that the sample size for the obese group is quite small (N = 27), which may limit the generalizability of the findings.
The standard deviations within each BMI category indicate variation in H-reflex latency measures. The percentile ranges show the distribution of H-reflex latency measurements within each BMI group.
These data point to a possible link between BMI and soleus H-reflex latency, with those with higher BMIs having slightly longer H-reflex latencies. However, additional study with bigger sample sizes in each BMI group is needed to corroborate these findings.
Table 6 shows N (Number of Participants), which indicates the sample size for each gender category. The study included 346 female and 438 male participants.
Mean ± SD (Standard Deviation): Indicates the average soleus H-reflex latency for both the right and left sides, including the standard deviation for each gender group. Percentiles (third to 97th) indicates the range within which a specific percentage of the data falls for each gender group.
According to the data, males have a somewhat larger mean soleus H-reflex latency than females. Standard deviations within each gender group provide information on the variability of H-reflex latency measures. The variability appears to be slightly higher in males than females, particularly on the left side.
Percentile ranges depict the distribution of H-reflex latency values within each gender group. Both genders had similar percentile ranges, implying that the distribution of soleus H-reflex latency values is similar between males and females. Furthermore, percentile ranges show the distribution of H-reflex latency data among each gender group. For example, for females, the third to 97th percentile range on the right side is 23.39 ms to 32.50 ms, whereas for men it is 23.75 ms to 34.22 ms.
These data point to potential gender differences in soleus H-reflex latency, with males having somewhat longer latencies than females. In summary, this perspective sheds light on how soleus H-reflex latency varies across genders.
Overall, the study looked at soleus H-reflex latency (ms) in different demographic categories, including age, height, BMI, and gender. The data highlight a number of notable patterns given as follows.
Age groups
As people get older, their soleus H-reflex latency tends to increase. Older persons had longer H-reflex latencies than young and middle-aged adults. However, heterogeneity within each age group indicates that neuromuscular function varies by individual.
Height groups
Taller individuals have slightly greater mean soleus H-reflex latency values than shorter individuals. However, the sample size for the tallest height group is small, necessitating caution in interpretation.
BMI groups
As BMI grows from underweight to obese, so does soleus H-reflex latency. This shows a possible link between higher BMI and longer H-reflex latencies, but more study with bigger sample numbers is required to corroborate these findings.
Gender
Males often have slightly greater mean soleus H-reflex latency values than females. The gender difference in H-reflex latency may represent physiological differences between males and females, but more research is needed to investigate other contributing causes.
Discussion
Many authors have studied the normal ranges of Soleus H-reflex as presented in Table 7, but there are methodological limitations such as insufficient sample size, sampling bias, and use of conventional statistical analysis, etc. [7-11].
Large sample size increases the power and precision of reference data studies as well as reduces the mean square errors (MSEs) [3]. It has been found out that with a sample size of 100, the MSEs decrease by 80% [12]. Some authors have suggested that a sample size of around 300 is optimal [13]. This study has presented reference data using a very large subject population (n=784).
As per the NDTF criteria, apart from recruiting community-dwelling healthy subjects, a detailed comprehensive neurological examination and a brief electrophysiological evaluation of the participants were also done as a criterion for the normalcy of participants [3].
Age, Height, and BMI are those variables that may influence nerve conduction parameters [14]. The NDTF suggests a wide distribution of participants’ age and subset of age to be adequately represented. In this study, we could create separate reference ranges for various age, height, and BMI groups due to the large sample size and near-adequate representation of various age groups. This study has presented reference data using a very large subject population (n=784).
The mean Soleus H-reflex latency revealed in the current study (28.2 ms) is somewhat compatible with the findings of other investigations, such as Khosrawi et al. (27.94 ms), Huang et al. (28.4 ms), and Kimura (29.5 ms). This shows that these investigations agree on the average latency of the Soleus H-reflex.
However, mean latency values vary between investigations, with Palve et al. finding a larger range (24.3 to 32.0 ms) and Buschbacher reporting a somewhat greater mean latency (30.3 ms). This variation could be attributed to differences in sample characteristics, measuring methodology, or other variables.
The current study has a significantly bigger sample size (N=784) than several of the other studies cited. A greater sample size typically improves the reliability and generalizability of findings, implying that the reported mean values as well as the percentile values in the current study may be more representative of the community.
The limitation of this study is the issue of limited sample size in some subgroups. In the BMI group, the obese subgroup has a relatively small sample size (N = 27) which may affect the generality of the findings. Similarly, height subgroup 4 (≥ 180 cm) has a limited sample size (N=8) potentially affecting the credibility of the standard deviation estimate. Further research with larger sample sizes in each BMI and height categories is warranted to further confirm these observations.
Conclusions
In summary, this study followed the NDTF criteria and used a sizable healthy subject population to provide reference data for Soleus H-reflex latency. Because of the huge sample size and nearly appropriate coverage of different age groups, reference ranges have been established for various age, height, and BMI groups.
This study of soleus H-reflex latency across diverse demographic groups sheds light on the factors that influence the reference data for soleus H-reflex latencies. The observed trends indicate that age, height, BMI, and gender may all influence H-reflex latency.
The outcome of the study showed that increasing age is associated with longer soleus H-reflex latencies, with older adults transmitting neural information at a slower rate than younger people. This age-related variance emphasizes the necessity of taking into account age-related variations when measuring and interpreting H-reflex measures.
BMI appears as a potential predictor of soleus H-reflex latency, with larger BMI categories corresponding to longer latency values. More research is needed to validate the relationship and investigate the underlying mechanisms. Furthermore, gender differences in soleus H-reflex latency are noted, with males typically having somewhat longer latencies than females.
The reference list from the paper itself. Each links out to its DOI / PubMed record.
- 1The Hoffmann reflex: methodologic considerations and applications for use in sports medicine and athletic training research J Athl Train Palmieri RM Ingersoll CD Hoffman MA 268277392004 https://www.ncbi.nlm.nih.gov/pmc/articles/PMC 522151/pdf/attr_39_03_0268.pdf 16558683 PMC 522151 · pubmed ↗
- 2Clinical uses of H reflexes of upper and lower limb muscles Clin Neurophysiol Pract Burke D 917120163021495410.1016/j.cnp.2016.02.003PMC 6123946 · doi ↗ · pubmed ↗
- 3Establishing high-quality reference values for nerve conduction studies: a report from the normative data task force of the American Association of Neuromuscular & Electrodiagnostic Medicine Muscle Nerve Dillingham T Chen S Andary M 3663705420162723885810.1002/mus.25204 · doi ↗ · pubmed ↗
- 4The sensitivity and specificity of the neurological examination in polyneuropathy patients with clinical and electrophysiological correlations P Lo S One Abraham A Alabdali M Alsulaiman A 1715971715101201710.1371/journal.pone.0171597 PMC 533203228249029 · doi ↗ · pubmed ↗
- 5Basic Nerve Conduction Study. Electromyography and Neuromuscular Disorders: Clinical Electrophysiologic Correlations Preston DC Shapiro BE 2545 Philadelphia, PA Elsevier 2005
- 6Technical tips: methods of warming and maintaining limb temperature during nerve conduction studies Neurodiagn J Morris J 2412515320132404697210.1080/21646821.2013.11079910 · doi ↗ · pubmed ↗
- 7Evaluation of the relation between triceps surae H-reflex, M-response latencies and thigh length in normal population J Res Med Sci Khosrawi S Fallah S 188192182013 https://www.ncbi.nlm.nih.gov/pmc/articles/PMC 3732897/pdf/JRMS-18-188.pdf 23930113 PMC 3732897 · pubmed ↗
- 8Impact of aging on nerve conduction velocities and late responses in healthy individuals J Neurosci Rural Pract Palve SS Palve SB 112116920182945635410.4103/jnrp.jnrp_323_17PMC 5812134 · doi ↗ · pubmed ↗