Clinical and Immunologic Characteristics of Colorectal Cancer Tumors Expressing LY6G6D
Adrián Sanvicente García, Manuel Pedregal, Lucía Paniagua-Herranz, Cristina Díaz-Tejeiro, Cristina Nieto-Jiménez, Pedro Pérez Segura, Gyöngyi Munkácsy, Balázs Győrffy, Emiliano Calvo, Víctor Moreno, Alberto Ocaña

TL;DR
This study explores the clinical and immune features of colorectal cancer tumors with high LY6G6D protein expression to guide future therapies.
Contribution
The study identifies LY6G6D as a CRC-specific target associated with specific genomic and immune profiles.
Findings
LY6G6D is expressed in microsatellite stable colorectal cancer tumors and is linked to left-side tumors and canonical genomic subgroups.
Tumors with APC and p53 mutations show elevated LY6G6D levels and lack immune cell infiltration.
LY6G6D is associated with an inert immune microenvironment, suggesting potential for T cell engager therapies.
Abstract
The identification of targets that are expressed on the cell membrane is a main goal in cancer research. The Lymphocyte Antigen 6 Family Member G6D (LY6G6D) gene codes for a protein that is mainly present on the surface of colorectal cancer (CRC) cells. Therapeutic strategies against this protein like the development of T cell engagers (TCE) are currently in the early clinical stage. In the present work, we interrogated public genomic datasets including TCGA to evaluate the genomic and immunologic cell profile present in tumors with high expression of LY6G6D. We used data from TCGA, among others, and the Tumor Immune Estimation Resource (TIMER2.0) platform for immune cell estimations and Spearman correlation tests. LY6G6D expression was exclusively present in CRC, particularly in the microsatellite stable (MSS) subtype, and was associated with left-side tumors and the canonical genomic…
Genes, proteins, chemicals, diseases, species, mutations and cell lines named across the full text — each resolved to its canonical identifier and authoritative record.
Click any figure to enlarge with its caption.
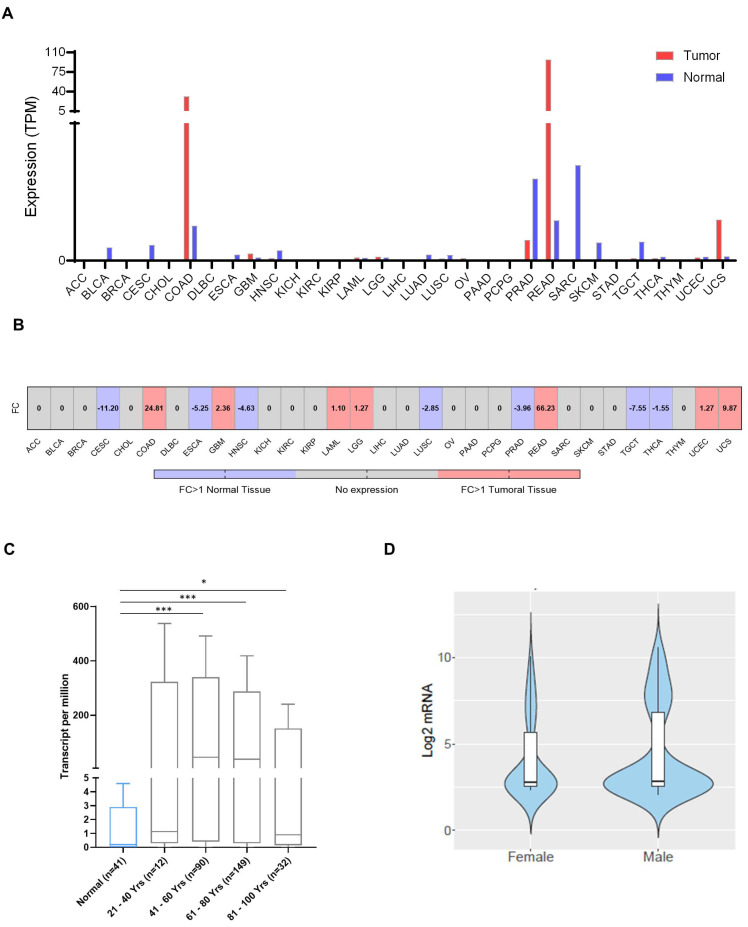 Figure 1
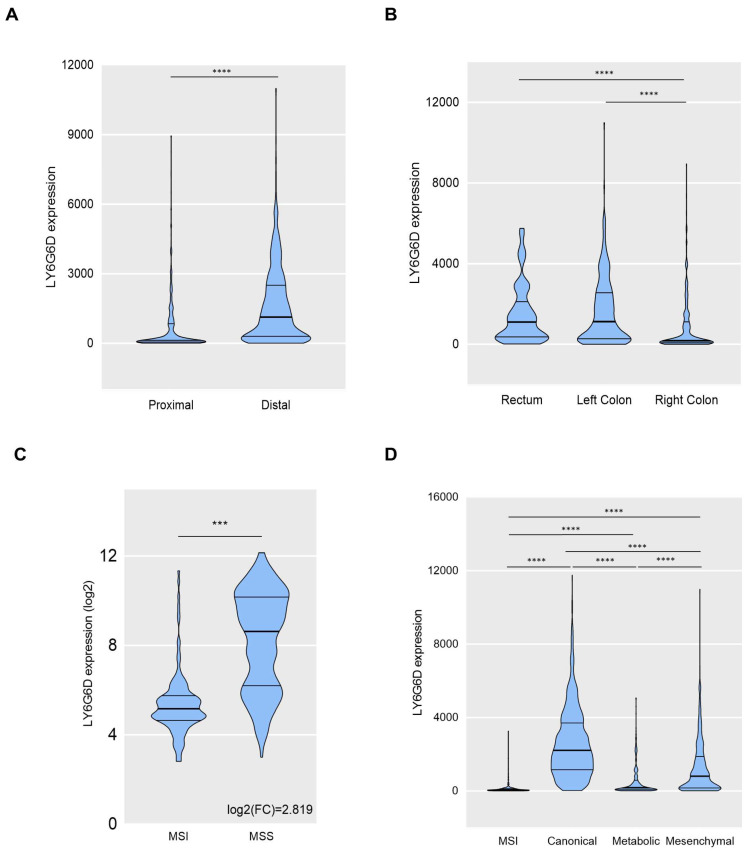 Figure 2
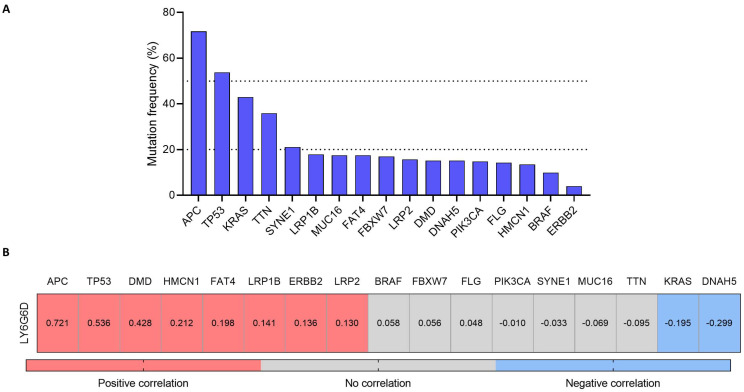 Figure 3
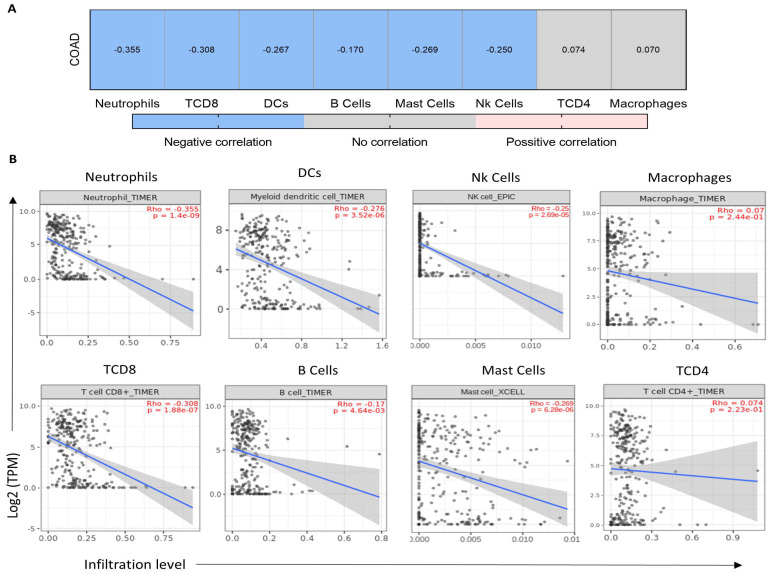 Figure 4
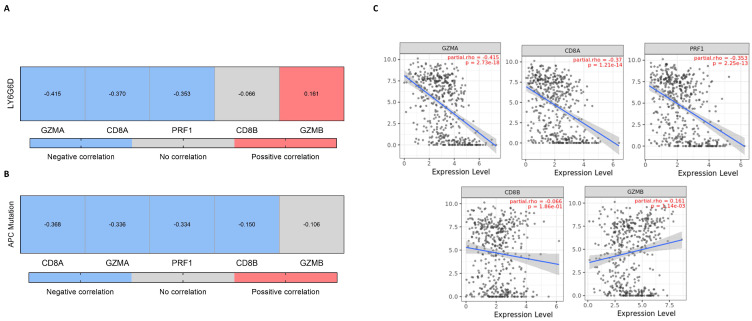 Figure 5
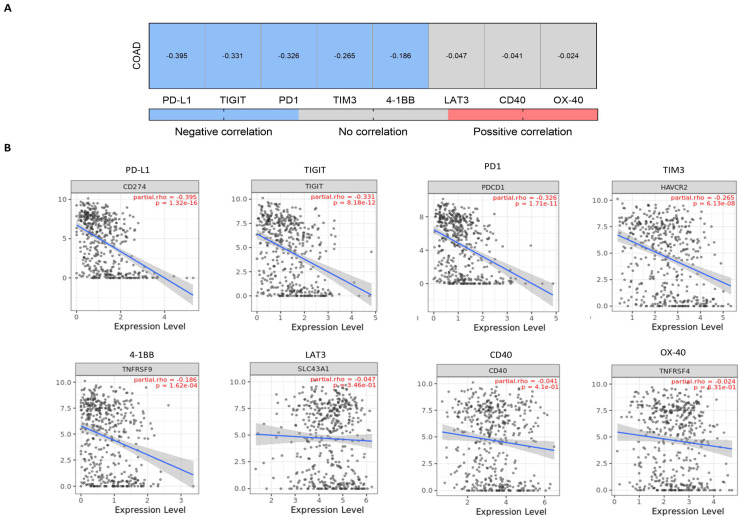 Figure 6
- —Instituto de Salud Carlos III
- —ACEPAIN
- —Diputación de Albacete
- —CIBERONC
- —CRIS Cancer Foundation
- —European Community
Peer Reviews
No public reviews on file for this paper yet. If you reviewed it on a platform where reviews are public (OpenReview, ICLR, NeurIPS, ICML), you can paste yours below so the community can read it here.
Videos
No videos yet. Explain this paper in a talk, walkthrough, or lecture? Add one.
Taxonomy
TopicsGalectins and Cancer Biology · Glycosylation and Glycoproteins Research · Monoclonal and Polyclonal Antibodies Research
1. Introduction
The identification of targets expressed on the surface of the cell membrane is a main goal in cancer research to develop novel therapeutic strategies [1]. The selection of tumor-associated antigens (TAAs) specifically expressed in tumoral cells can permit selective targeting avoiding on-target off-tumor toxicities [2]. TAAs can be used for the development of different antibody-based modalities like antibody-drug conjugates (ADCs), bi-specific antibodies, or T cell engagers (TCE) [2,3,4].
All these strategies have demonstrated clinical efficacy in solid and hematological malignancies. At this moment, there are eleven ADCs, one bi-specific and two TCEs approved by the US Food and Drug Administration (FDA) [5]. It is envisioned that several other compounds will reach the clinic in the following years. Considering the high grade of toxicity observed with some of these agents, particularly TCE, it would be desirable to find cancer types and indications where TAAs are exclusively expressed in tumors [4]. Compared with hematological malignancies where monoclonal expansions of tumor cells are the standard, in solid tumors the identification of specific TAAs is exceptional due to the high grade of tumor heterogenicity [6].
The implementation of genomic techniques complemented with proteomic studies has permitted the identification of novel targets that could be considered optimal TAAs for antibody development [7]. Our group, based on these approaches, has recently described some novel membrane proteins for the development of ADCs [8,9]. Additional examples have reached early clinical development like those acting on the Lymphocyte Antigen 6 Family Member G6D (LY6G6D) gene.
LY6G6D belongs to a cluster of leukocyte antigens located in the major histocompatibility complex (MHC) class III region on chromosome 6 [10]. LY6G6D, like most members of the family, is attached to the cell membrane by a glycosylphosphatidylinositol (GPI) anchor [10,11].
LY6G6D was found to be expressed in colorectal cancer (CRC), a disease whose incidence has dramatically increased over the last years, particularly early-onset colon and rectal cancer where rates are expected to increase by more than 25% and 45%, respectively, by 2030 [12]. Therefore, the identification of novel targets in this disease and the optimization of therapies designed against them is key to better selecting the right patient population [13,14]. A very recent article describes the presence of LY6G6D by immunohistochemistry (IHC) in MSS CRC with a total of 107 primary samples the overall prevalence of LY6G6D expression was 74% (IHC 1þ/2þ/3þ), with moderate to strong LY6G6D expression (IHC 2þ/3þ) in 25% of the cases [14].
In the present work, we aimed to evaluate the genomic profile present in tumors with high expression of LY6G6D at a transcriptomic level. We observed how LY6G6D expression was exclusively present in CRC, particularly in the microsatellite stable (MSS) subtype, and associated with left-side tumors and the canonical subgroup. In addition, tumors with mutations of APC and p53 expressed elevated levels of LY6G6D. Finally, LY6G6D was expressed in tumors with an inert immune microenvironment with an absence of immune cells and co-inhibitory molecules.
2. Results
2.1. LY6G6D Is Highly and Exclusively Expressed in Colorectal Cancer Tumors
We first aimed to evaluate the transcriptomic presence of LY6G6D in all solid tumors by mapping their expression using publicly available datasets. LY6G6D was highly and exclusively expressed in rectal and colon adenocarcinoma as shown in Figure 1 with an expression of more than 32 transcripts per million (TPM). Of note, the highest expression was observed in rectum adenocarcinoma with more than 100 TPM. Expression in normal tissue was extremely low in all solid tumors with less than 5 TPM (Figure 1A). The fold change of the expression of LY6G6D for each cancer type can be visualized in Figure 1B.
In addition, as age and sex are considered important factors to take into consideration in this disease, especially for early-onset tumors, we decided to test whether there was an association between LY6G6D expression and these factors. As can be seen in Figure 1C, no correlation was observed between gene expression and patient age. Similarly, there were also no significant differences between sexes in relation to LY6G6D expression (Figure 1D).
In line with the previous data [14], LY6G6D was highly present in the distal colon when compared with the proximal (Figure 2A), and in the left side and rectum compared with the right side (Figure 2B).
2.2. LY6G6D Is More Expressed in the Microsatellite Stable and the Canonical Colon Cancer Subtype
Immune checkpoint inhibitors in colon cancer have only demonstrated activity in microsatellite unstable high (MSI-H) tumors, and few signs of clinical activity have been observed in microsatellite stable (MSS) cancers. Therefore, we explored the association of LY6G6D with these tumor subtypes. As can be seen in Figure 2C, LY6G6D was highly present in MSS tumors compared with MSI-H ones. Next, we evaluated the presence of LY6G6D with the different described genomic colon cancer subtypes [15]. The canonical subtype was the one with the highest presence of LY6G6D followed by the mesenchymal subgroup (Figure 2D).
2.3. Transcriptomic Profiling of Colon Adenocarcinomas (CRC) with High Expression of LY6G6D and Association with Immune Infiltrates
To better characterize the genomic profile of tumors with a high expression of LY6G6D, we evaluated at a transcriptomic level those genes that were upregulated when LY6G6D was highly expressed. Using a cut-off level of FC ≥ 2 and a p-value < 0.05, we identified 201 genes that were upregulated in MSI-H and 275 upregulated genes in MSI-L/MSS. Nineteen of these genes were shared between MSI-H and MSI-L/MSS patients (Supplementary Figure S1A).
Using an exclusion criteria with a Spearman correlation cut-off ≥0.4 we found only five genes were shared between subtypes that correlated with LY6G6D.
Then we aimed to evaluate the presence of immune populations when these transcripts were highly present. CD8+, CD4+ T cells and neutrophils correlated negatively with the majority of the selected genes and none of them correlated positively with any immune population (Supplementary Figure S1B). Although these correlations were not strong, these data suggest the presence of an immunosuppressive microenvironment when these genes are upregulated.
2.4. Mutational Profile of Tumors with High Expression of LY6G6D
Considering those genes with higher mutational rates in CRC (Figure 3A) we evaluated the correlation of these mutations with LY6G6D expression. A positive and strong association was observed between high LY6G6D and: APC, tp53 and DMD mutations (0.721; 0.536 and 0.428, respectively) (Figure 3B). Contrary, a negative association was identified for KRAS and DNAH5 (−0.195 and −0.299, respectively) (Figure 3B). A weak but positive correlation was observed for HMCN1, FAT4, LRP1B, ERBB2, and LRP2. For the other mutations analyzed no association was observed (Figure 3B).
2.5. LY6G6D Is Present in an Inert Immune Microenvironment
Given the role of LY6G6D as a TAA, we studied the type of immune cells that were present in the tumor microenvironment when tumors displayed high expression of LY6G6D. As can be seen in Figure 4A, LY6G6D correlated negatively with some adaptive cell types, including T Cell CD8+ and B cells (Rho = −0.308, p-value = 1.88 × 10^−7^ and Rho = −0.170, p-value = 4.64 × 10^−3^, respectively) and with selected innate cell types: neutrophils, dendritic cells and Nk cells (Rho = −0.355, p-value = 1.4 × 10^−9^; Rho = −0.267, p-value = 3.51 × 10^−6^; Rho = −0.250, p-value = 2.69 × 10^−5^, respectively). Mast cells, which are important for both innate and adaptative response also correlated negatively (Rho = −0.269, p-value = 6.28 × 10^−6^).
For other immune populations such as CD4+ T cells and macrophages, no association was found. In line with this, we explored the association of LY6G6D with T cell activating genes including perforin, granzyme A and B, CD8a, CD8b and PRF1. Similarly, a negative association was observed for CD8A, PRF1 and GZMA (Rho = −0.370, p-value = 1.21 × 10^−14^; Rho = −0.353, p-value = 2.25 × 10^−13^ and Rho = −0.415, p-value = 2.73 × 10^−18^, respectively) (Figure 5A). Similarly, the relationship between APC mutation and the expression of these genes again showed a negative correlation for all but GZMB which did not correlate (Figure 5B).
Finally, we evaluated the presence of LY6G6D with different inhibitory molecules. As displayed in Figure 6A, the expression of LY6G6D correlated negatively with PD1, PD-L1, TIM3, TIGIT and 4-1BB (Rho = −0.326, p-value = 1.71 × 10^−11^; Rho = −0.395, p-value = 1.32 × 10^−16^; Rho = −0.265, p-value = 6.13 × 10^−8^; Rho = −0.331, p-value = 8.12 × 10^−12^ and Rho = −0.186, p-value = 1.62 × 10^−4^ respectively). Detailed dot plots of all these data are provided in the last section of Figure 4, Figure 5 and Figure 6, respectively.
3. Discussion
In our study, we describe the exclusive presence of LY6G6D in CRC particularly in the MSS subtype. These data confirm the published information using transcriptomic and immunohistochemistry (IHC) data [13,14,16] and extend this information to additional biological parameters that could help to define the best target population and combinational strategies for the correct clinical development of agents against this target. In this context, we also observed a clear association with the canonical subtype and an increased expression of LY6G6D in left-sided/rectum tumors, and those harboring APC/P53 mutations.
It is well known that the canonical subtype is more present in left-sided tumors and those with APC/P53 mutations. Both mutations, P53 and APC are implicated, as tumor suppressor genes, in numerous crucial signaling pathways and biological processes associated with chromosomal instability (CIN) and CRC carcinogenesis [17]. As P53 restoration drives tumor regression, some therapeutic strategies have been developed to reactivate its function. For instance, PC14586, a first-in-class p53 reactivator, elicited a response in about a fourth of patients with advanced solid tumors carrying p53 Y220C mutations and demonstrated acceptable tolerability [18]. APC also forms part of the WNT signaling pathway, and its inactivation results in an increase in nuclear CTNNB1 expression and cell proliferation, also playing a gatekeeper role in CIN CRCs [17].
As seen, a clear association was observed for APC and P53, but not KRAS. Indeed, APC mutations correlate with a low presence of immune checkpoint targets and low tumor mutational burden (TMB) [19]. This is also in line with previously described data that suggest that the canonical subtype presents poor infiltration of immune cells [20]. Very weak associations were identified for some of them, for example, mutations at LRP1B/FAT4 were described as potential biomarkers for favorable immunotherapy response independently of the high presence of TMB and MSI-H status [21,22].
Only five transcripts strongly correlated with LY6G6D and were shared between subtypes. These genes did not correlate with any immune population. In line with this, when we explored the tumor microenvironment, we observed a negative correlation between LY6G6D with adaptative immune cells including effector CD8+ T cells. Indeed, markers associated with T cell effector functions were down-regulated. Similarly, innate cells also showed a reduced expression. In this context, the killing of LY6G6D-positive tumoral cells with TCE must take advantage of a limited number of CD8+ T cells. It is unknown if this low level of CD8+ T cells is sufficient for clinical activity, or if additional cells need to be recruited outside the tumoral areas to reach a clinical response.
At this moment there are TCE against LY6G6D in clinical development [13,14]. To our knowledge, no clinical efficacy data have been reported yet. Similarly, no combinatorial strategies are under evaluation with an intent to modify the immunosuppressive microenvironment associated with the presence of LY6G6D.
We acknowledge that this study has limitations. This is a bioinformatic evaluation that uses publicly available genomic data for their analysis. We recognize that studies evaluating the protein content and spatial organization within the tumor microenvironment in the different CRC subtypes should be performed to better characterize the responsive population.
In conclusion, we describe the clinical, genomic, and immune-pathologic characteristics that can be used to optimize the clinical development of agents against this target. The initial findings provided in the present study justify the need for further investigation of LY6G6D in human samples and patient-oriented preclinical models to validate the observed information and identify potential therapeutic combinations.
4. Materials and Methods
4.1. LY6G6D Expression Studies
Data from TCGA (The Cancer Genome Atlas; https://www.cancer.gov/ccg/research/genome-sequencing/tcga; accessed on 15 December 2022) [23] Pancancer was obtained for this study to achieve information about patient’s gene expression in normal and tumoral tissue in different cancers. This dataset contains whole exome sequencing information from patients’ tumors and their respective healthy tissues. This was assessed using several web tools containing these data as GEPIA2 (http://gepia2.cancer-pku.cn/#index; accessed on 15 December 2022) [24], Gent2 (http://gent2.appex.kr/gent2/; accessed on 15 December 2022) [25] and UALCAN (https://ualcan.path.uab.edu/; accessed on 15 December 2022) [26,27].
We also used Cbioportal to acquire mutational information about several cancers (Colorectal Adenocarcinoma (TCGA, Firehose Legacy)) (https://www.cbioportal.org/; accessed on 16 December 2022) [28].
4.2. Transcriptomic Studies
GEO was searched to identify datasets with colon cancer studies with transcriptome-wide gene expression data derived by using Affymetrix gene arrays. Together 2110 samples were identified which stemmed from 16 independent datasets. The average follow-up of these patients was 52.6 months and 47.2% were female. The gene expression data were mas5 normalized and then a second normalization was applied to set the mean expression across all genes to 1000 to reduce batch effects due to different mean expressions in the mas5 normalization.
4.3. Identification of Mutated Genes in Tumors with High Expression of LY6G6D
TCGA data were used to investigate gene alterations when LY6G6D was highly expressed in patients with colorectal cancer in MSI-H and MSI-L/MSS independent subsets. Data from these subsets were compared and in order to filter our genes, we set an exclusion criterion based on a Fold Change ≥ 2 and a Spearman correlation ≥ 0.4 between LY6G6D expression and gene mutation. Identified shared genes between subsets were further analyzed to elucidate potential immunogenic roles.
4.4. Immune Cell Infiltration and Gene Expression Correlation
To investigate the association between gene expression/mutation and immune infiltration (tumor purity), we used the Tumor Immune Estimation Resource (TIMER2.0) platform [29] (http:/timer.cistrome.org/, accessed on 18 December 2022). TIMER2.0 uses Spearman correlation to associatSe these parameters with immune populations, including T Cell CD4+, T Cell CD8+, B cells, macrophages, dendritic cells and neutrophils. It contains 10,897 samples from diverse cancer types from the TCGA.
4.5. Gene Correlations
The Spearman correlation coefficient was used for correlation analysis between gene expression and mutations or immune infiltrates. Statistically significant results (p-value < 0.05) were displayed in red or blue, for positive or negative correlations, respectively, using heatmaps. Those with no statistical association were represented in grey. Data from TCGA [23] were used in the analysis.
4.6. Graphical Design
Histograms, bar charts, heatmaps, etc., were plotted using GraphPad Prism 10.0.1 software (GraphPad Software, San Diego, CA, USA).
The reference list from the paper itself. Each links out to its DOI / PubMed record.
- 1Ocaña A. García-Alonso S. Amir E. Pandiella A. Refining Early Antitumoral Drug Development Trends Pharmacol. Sci.20183992292510.1016/J.TIPS.2018.09.00330279003 · doi ↗ · pubmed ↗
- 2Kaplon H. Crescioli S. Chenoweth A. Visweswaraiah J. Reichert J.M. Antibodies to watch in 2023 m Abs 202315215341010.1080/19420862.2022.215341036472472 PMC 9728470 · doi ↗ · pubmed ↗
- 3García-Alonso S. Ocaña A. Pandiella A. Trastuzumab Emtansine: Mechanisms of Action and Resistance, Clinical Progress, and Beyond Trends Cancer 2020613014610.1016/J.TRECAN.2019.12.01032061303 · doi ↗ · pubmed ↗
- 4Ball K. Dovedi S.J. Vajjah P. Phipps A. Strategies for clinical dose optimization of T cell-engaging therapies in oncologym Abs 202315218101610.1080/19420862.2023.218101636823042 PMC 9980545 · doi ↗ · pubmed ↗
- 5Esapa B. Jiang J. Cheung A. Chenoweth A. Thurston D.E. Karagiannis S.N. Target Antigen Attributes and Their Contributions to Clinically Approved Antibody-Drug Conjugates (AD Cs) in Haematopoietic and Solid Cancers Cancers 202315184510.3390/CANCERS 1506184536980732 PMC 10046624 · doi ↗ · pubmed ↗
- 6Baliu-PiquéM. Pandiella A. Ocana A. Breast Cancer Heterogeneity and Response to Novel Therapeutics Cancers 202012327110.3390/CANCERS 1211327133167363 PMC 7694303 · doi ↗ · pubmed ↗
- 7Zinn S. Vazquez-Lombardi R. Zimmermann C. Sapra P. Jermutus L. Christ D. Advances in antibody-based therapy in oncology Nat. Cancer 2023416518010.1038/S 43018-023-00516-Z 36806801 · doi ↗ · pubmed ↗
- 8Alcaraz-Sanabria A. Cabañas Morafraile E. Fernández-Hinojal G. Velasco G. Pérez-Segura P. Pandiella A. Győrffy B. Ocaña A. Transcriptomic Mapping of Non-Small Cell Lung Cancer K-RAS p.G 12C Mutated Tumors: Identification of Surfaceome Targets and Immunologic Correlates Front. Immunol.20221278606910.3389/FIMMU.2021.78606935178045 PMC 8843839 · doi ↗ · pubmed ↗