greenPipes: an integrated data analysis pipeline for greenCUT&RUN and CUT&RUN genome-localization datasets
Sheikh Nizamuddin, H T Marc Timmers

TL;DR
greenPipes is a new pipeline for analyzing CUT&RUN and greenCUT&RUN data, offering integrated tools for genome-localization studies.
Contribution
greenPipes introduces a comprehensive, fine-tuned pipeline for CUT&RUN data analysis with integrated multi-omics capabilities.
Findings
greenPipes provides optimized parameters for CUT&RUN and greenCUT&RUN data analysis.
The pipeline supports data integration with other -omics technologies.
Test datasets and annotations are publicly available for use.
Abstract
To study gene regulation through transcription factors and chromatin modifiers, a variety of genome-wide techniques are used. Recently, CUT&RUN-based technologies have become popular, but a pipeline for the comprehensive analysis of CUT&RUN datasets is currently lacking. Here, we present the “greenPipes” package, which includes fine-tuned parameters specifically for bioinformatic analyses of greenCUT&RUN and CUT&RUN datasets. greenPipes provides additional functionalities for data analysis and data integration with other -omics technologies, which are either not available in other pipelines developed for CUT&RUN datasets or scattered in the literature as individual packages. Source code and a manual of the greenPipes are freely available on GitHub website (https://github.com/snizam001/greenPipes). The test datasets, comprehensive annotation files, and other datasets are available at…
Genes, proteins, chemicals, diseases, species, mutations and cell lines named across the full text — each resolved to its canonical identifier and authoritative record.
Click any figure to enlarge with its caption.
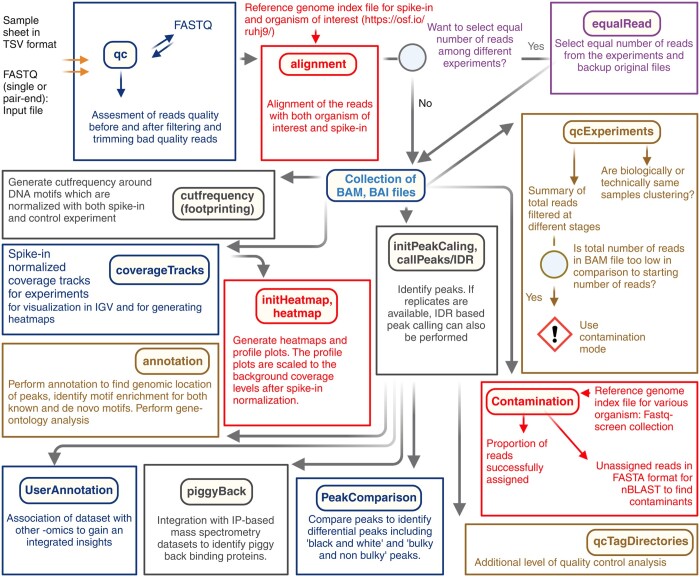 Figure 1
- —Deutsche Forschungsgemeinschaft10.13039/501100001659
Peer Reviews
No public reviews on file for this paper yet. If you reviewed it on a platform where reviews are public (OpenReview, ICLR, NeurIPS, ICML), you can paste yours below so the community can read it here.
Videos
No videos yet. Explain this paper in a talk, walkthrough, or lecture? Add one.
Taxonomy
TopicsBusiness, Innovation, and Economy · Business, Education, Mathematics Research
1 Introduction
Studying gene regulation in diverse species or model systems involves a primary focus on comprehending the mechanisms by which transcription factors and chromatin regulatory proteins operate. To understand these complex processes, a variety of in vitro and in vivo DNA-binding assays are used including genome-wide localization methods like ChIPseq, CUT&RUN, and CUT&Tag. These methods generate large datasets, which need to be compared with datasets originating from a variety of omics-technologies to obtain a better understanding of gene regulation at a global scale.
The CUT&RUN (cleavage under target and release using nuclease) technique is relatively new and was developed to profile genome-wide binding events of transcription factors, chromatin regulators, and histone modifications using low numbers of cells or nuclei under native conditions (Skene and Henikoff 2017). As far as we know, there are currently two primary pipelines for analyzing CUT&RUN data: CUT&RUNTools (versions 1 and 2) and the cutandrun tool of nf-core (Zhu et al. 2019, Ewels et al. 2020, Yu et al. 2021). However, these tools lack a comprehensive analysis beyond read alignment and peak calling, and they do not facilitate the comparison of CUT&RUN datasets with other -omics datasets.
To address these limitations, we have developed the “greenPipes” pipeline. Specifically tailored for the datasets generated by greenCUT&RUN and CUT&RUN, it incorporates spike-in normalization methods at different stage of analysis. With greenPipes, users can perform all analyses in a single run, and it offers additional features for data analysis along with seamless integration with other -omics technologies, such as targeted quantitative mass spectrometry. Many of the features found in greenPipes are absent in existing tools or are scattered across the literature as separate packages rendering greenPipes a valuable and user-friendly tool for researchers in this field. The distinctions of greenPipes compared to currently available pipelines are succinctly outlined in Supplementary Table 1.
2 Implementation
The greenPipes pipeline is built on the Python, R, and Perl languages. Besides its own functions written in R and Python, the pipeline depends on other tools including Bowtie2, HOMER, and deepTools. The greenPipes uses mamba for creating a conda environment for hassle-free and faster installation of greenPipes. Installation of Perl modules is facilitated through cpanm, while R packages are obtained from CRAN and the Bioconductor repository. greenPipes is designed to take advantage of multicore processors and supports multi-threading for faster data processing. It also provides the convenience of downloading a basic database for the species of interest of the user directly within the pipeline. This feature streamlines the setup process and ensures that users have the essential reference data for analyses. The other datasets, e.g. reference genome index files and additional annotation datasets, can be downloaded from https://osf.io/ruhj9/.
A comprehensive manual outlining the workflow and various parameters is available on the GitHub page and as a Supplementary file, and summarized in Fig. 1. The greenPipes pipeline offers extensive customization through numerous parameter settings. All these options are explained in the integrated help section. The program is designed to operate through the command line interface, featuring a user-friendly design that facilitates quick familiarity for users, including those who may not be experts in the field. In the event of a failure, the greenPipes pipeline allows users to re-enter and resume the process, promoting efficient and time-saving data processing.
Visual representation of the workflow of the greenPipes pipeline. This pipeline only needs two experiment-specific input files and it run most of the analyses in a single command as shown in the workflow.
The pipeline incorporates optimized parameters, coupled with insightful suggestions to guide users toward an optimal data analysis. For a detailed understanding of parameter choices and recommendations, users are encouraged to refer to the manual accompanying the greenPipes pipeline. The developers of techniques like CUT&RUN and similar methods endorse the use of spike-in normalization to mitigate technical variations in datasets (Skene and Henikoff 2017, Nizamuddin et al. 2021). The spike-in refers to heterologous DNA, either synthetic or derived from MNase-digested Saccharomyces cerevisiae or Drosophila melanogaster chromatin, or from carry-over Escherichia coli DNA. The greenPipes pipeline incorporates spike-in normalization in various modes when comparing different samples, such as (i) peak calling, (ii) differential peak calling, (iii) read coverage calculation, and (iv) heatmap generation. This allows users to initiate the analysis from any step, even if they did not normalize the dataset with spike-in DNA earlier. In cases where users intend to use carry-over E. coli DNA as a spike-in (Meers et al. 2019), we recommend assessing the correlation of carry-over E. coli DNA with add-on spike-in controls. Correlations may vary across laboratory setups, especially when employing highly purified preparations of MNase fusion proteins. Notably, controls typically exhibit a higher spike-in proportion compared to experiments due to the low background of CUT&RUN technologies. greenPipes issues a warning if spike-in levels in controls surpass those in experiments and provides recommended parameters for data analysis. We suggest employing control read depth coverage at a ratio of one-third or one-fourth compared to the experiment in the greenCUT&RUN technique. To address lower control sequencing depth, the normalization formula now includes the total number of reads. The formula has been modified so that if the coverage depth is identical in both control and experimental samples, it will be transformed into the spike-in normalization formula used by Nizamuddin et al. (2021).
Unlike conventional pipelines, greenPipes also identifies those peaks that exhibit variations not based on reads coverage, but are influenced by the length of the reads. These peaks are categorized as “Bulky” and “NonBulky” to capture this additional dimension. From a biological perspective, these peaks could be significant owing to distinct complex formations occurring at these loci. Additionally, the pipeline detects unique peaks within an experiment. To achieve this, it conducts simulations to determine the maximum background coverage achievable in a given experiment. Subsequently, when a genomic location exhibits four times or more reads coverage in another experiment, it is classified as a unique or “black and white” peak. To the best of our knowledge, this classification of peaks does not currently exist in any other pipeline. In addition to peak calling algorithms applicable to the individual experiments, Irreproducibility Discovery Rate (IDR)-based peak calling has also been implemented in greenPipes. This facilitates the utilization of IDR when users have experimental replicates, offering independence from varying significance peak calling criteria across labs and experiments. This implemented functionality is also not present in other pipelines.
It is a common practice to compare genome-wide binding profile datasets with other types of data, such as proteomics, transcriptomics, and various genomic techniques, to achieve a comprehensive understanding of the underlying molecular mechanisms. In contrast to other pipelines, greenPipes uniquely allows the comparison of these diverse datasets. By integrating affinity-based mass spectrometry with greenCUT&RUN and CUT&RUN datasets, greenPipes identifies piggy-back binding proteins. However, it is essential to acknowledge a limitation in this aspect. Identification of piggy-back-binding proteins is limited to those with known DNA motifs. greenPipes comes with comprehensive datasets designed for peak annotation. This includes enhancer–gene interaction datasets spanning 110 tissues/cell-lines, developed by Gao and Qian (2020). Additionally, it offers 8165 annotations covering enhancers and super-enhancers, genomic locations, DNase-I hypersensitive sites, predicted and measured histone modifications, transcription factor binding sites, and other protein-binding locations (Kichaev et al. 2017). greenPipes is designed to generate a unified integrated output, accommodating datasets from diverse sources, including user-provided annotation datasets as well.
3 Conclusion
Our work introduces the greenPipes pipeline as a powerful and user-friendly tool tailored for the analysis of greenCUT&RUN and CUT&RUN datasets and addressing limitations in currently available pipelines. The greenPipes pipeline stands out by offering comprehensive features, including multi-threading support, optimized parameter settings, and integration with other omics technologies, such as targeted quantitative mass spectrometry. Unlike current pipelines, greenPipes goes beyond conventional read coverage-based analysis, providing a unique classification of peaks influenced by read length. This classification, along with the detection of piggy-back-binding proteins and the comparison of diverse datasets, sets greenPipes apart as a versatile and inclusive analytical tool. In summary, greenPipes is a valuable addition to the repertoire of bioinformatic tools available for the analysis of gene regulation datasets, providing a holistic approach to understanding the complex mechanisms underlying transcription factors, chromatin regulators, and histone modifications.
Supplementary Material
btae307_Supplementary_Data
The reference list from the paper itself. Each links out to its DOI / PubMed record.
- 1Ewels PA , Peltzer A, Fillinger S et al The nf-core framework for community-curated bioinformatics pipelines. Nat Biotechnol 2020;38:276–8.32055031 10.1038/s 41587-020-0439-x · doi ↗ · pubmed ↗
- 2Gao T , Qian J. Enhancer Atlas 2.0: an updated resource with enhancer annotation in 586 tissue/cell types across nine species. Nucleic Acids Res 2020;48:D 58–64.31740966 10.1093/nar/gkz 980PMC 7145677 · doi ↗ · pubmed ↗
- 3Kichaev G , Roytman M, Johnson R et al Improved methods for multi-trait fine mapping of pleiotropic risk loci. Bioinformatics 2017;33:248–55.27663501 10.1093/bioinformatics/btw 615PMC 5254076 · doi ↗ · pubmed ↗
- 4Meers MP , Bryson TD, Henikoff JG et al Improved CUT&RUN chromatin profiling tools. Elife 2019;8:e 46314.31232687 10.7554/e Life.46314 PMC 6598765 · doi ↗ · pubmed ↗
- 5Nizamuddin S , Koidl S, Bhuiyan T et al Integrating quantitative proteomics with accurate genome profiling of transcription factors by green CUT&RUN. Nucleic Acids Res 2021;49:e 49.33524153 10.1093/nar/gkab 038PMC 8136828 · doi ↗ · pubmed ↗
- 6Skene PJ , Henikoff S. An efficient targeted nuclease strategy for high-resolution mapping of DNA binding sites. Elife 2017;6:e 21856.28079019 10.7554/e Life.21856 PMC 5310842 · doi ↗ · pubmed ↗
- 7Yu F , Sankaran VG, Yuan GC. CUT&RUN Tools 2.0: a pipeline for single-cell and bulk-level CUT&RUN and CUT&Tag data analysis. Bioinformatics 2021;38:252–4.34244724 10.1093/bioinformatics/btab 507PMC 8696090 · doi ↗ · pubmed ↗
- 8Zhu Q , Liu N, Orkin SH et al CUT&RUN Tools: a flexible pipeline for CUT&RUN processing and footprint analysis. Genome Biol 2019;20:192.31500663 10.1186/s 13059-019-1802-4PMC 6734249 · doi ↗ · pubmed ↗