Characterisation of the surface growth of Mucor circinelloides in cheese agar media using predictive mathematical models
Martina Koňuchová, Agáta Boháčiková, Ľubomír Valík

TL;DR
This study models the growth of Mucor circinelloides on cheese agar to predict how temperature and salt affect fungal contamination in cheese production.
Contribution
The paper introduces predictive models for Mucor circinelloides growth on cheese agar under varying temperature and salt conditions.
Findings
Baranyi model predicted longer lag phases and higher growth rates than the Huang model.
Optimal growth rates decreased by 46% with 1% NaCl addition.
Temperature maxima for growth were around 37°C but reduced with salt.
Abstract
The main objective of this work was to characterise the mycelial growth of Mucor circinelloides, one of the fungal contaminants that appear frequently in the artisan cheese production environment. The study uses primary Baranyi and Huang models to compare their parameters and predict M. circinelloides on cheese-based medium (CBA) under diverse environmental conditions (temperature range from 6 to 37 °C and 0 and 1 % NaCl concentration). However, the Baranyi model consistently estimated longer lag phases and higher surface growth rates (sgr) than the Huang model; both models showed adequate best-fit performance (exactly with the mean coefficient of determination R2 = (0.993 ± 0.020 × 10⁻¹). The groups of primary growth parameters were analysed against temperature using the cardinal model (CM) with the following main outputs. The optimal surface growth rates (sgropt) on CBA were 6.8 and…
Genes, proteins, chemicals, diseases, species, mutations and cell lines named across the full text — each resolved to its canonical identifier and authoritative record.
Click any figure to enlarge with its caption.
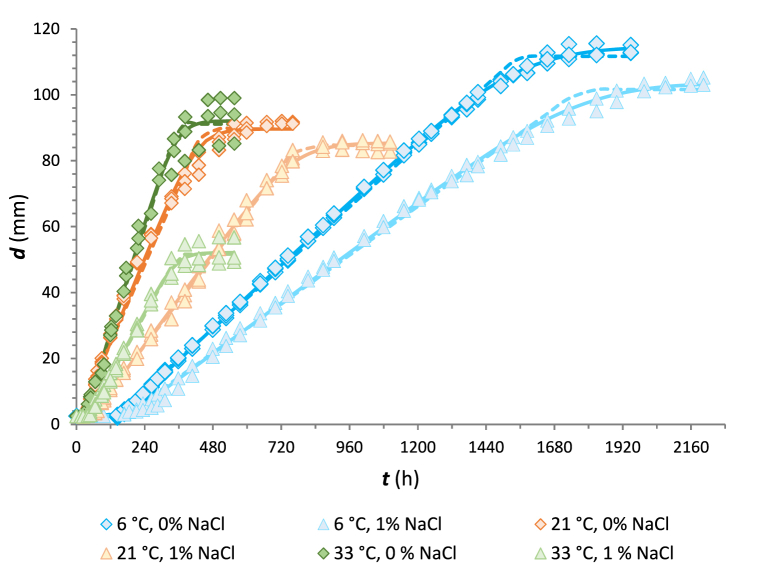 Figure 1
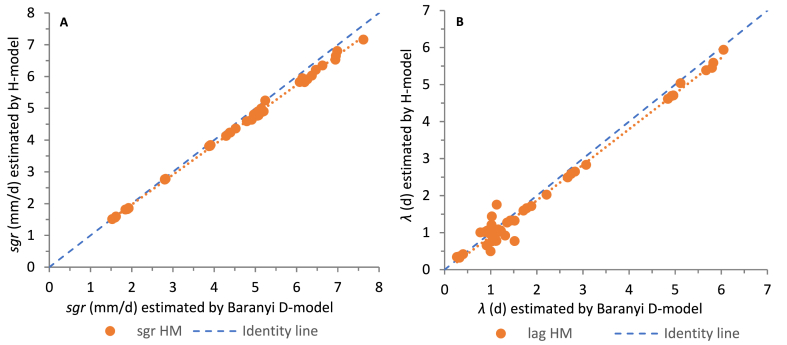 Figure 2
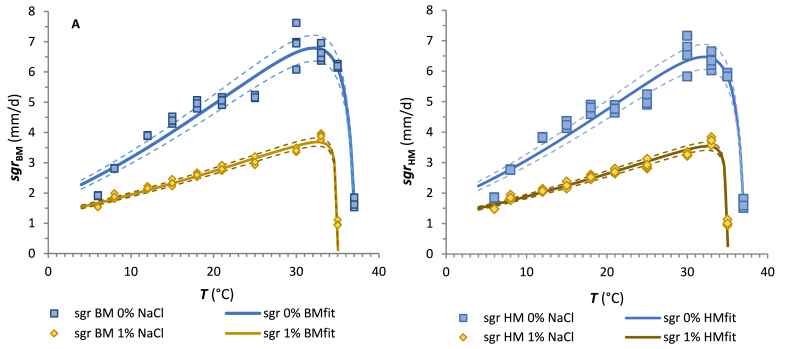 Figure 3
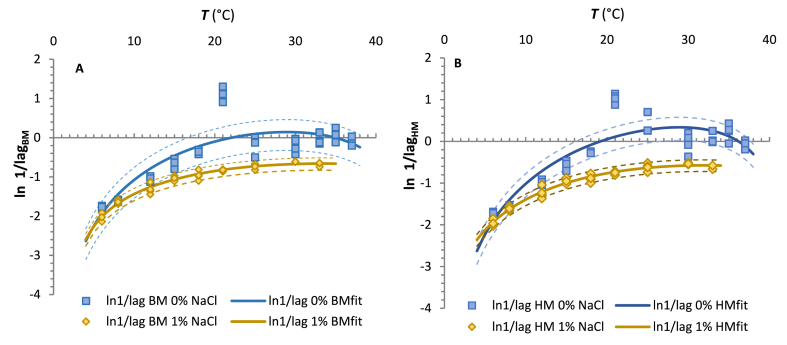 Figure 4
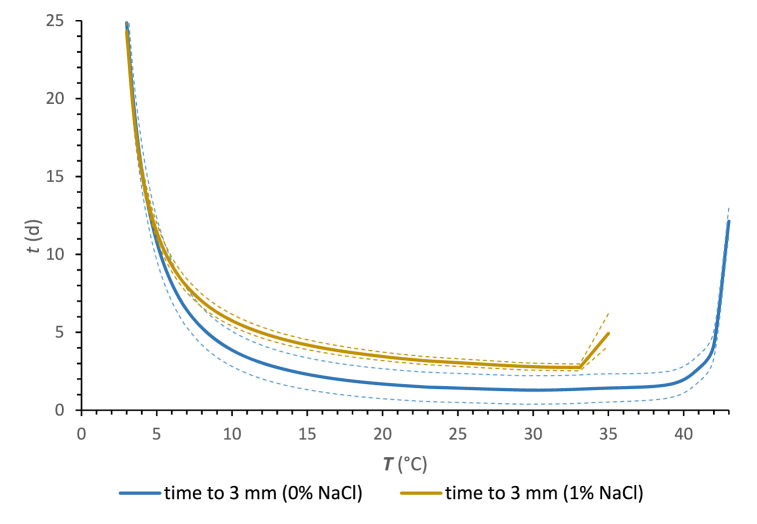 Figure 5
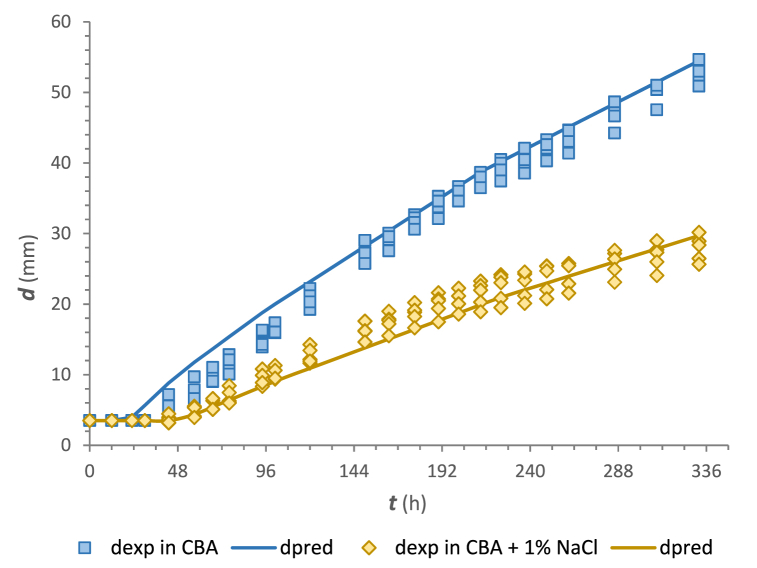 Figure 6
Peer Reviews
No public reviews on file for this paper yet. If you reviewed it on a platform where reviews are public (OpenReview, ICLR, NeurIPS, ICML), you can paste yours below so the community can read it here.
Videos
No videos yet. Explain this paper in a talk, walkthrough, or lecture? Add one.
Taxonomy
TopicsListeria monocytogenes in Food Safety · Microbial Inactivation Methods · Essential Oils and Antimicrobial Activity
Introduction
1
The growth of fungi in cheese represents quality and safety issues and leads to food loss and waste with significant economic impacts. Physiological characteristics contribute to the ability of fungi to grow at low refrigeration temperatures, higher salt concentration (low water activity (aw) values), lower pH, lower oxygen tension atmospheres, and nutrient limitations [[1], [2], [3], [4]]. The frequently reported dairy-relevant spoilage fungi are species belonging to the phylum Ascomycota and Zygomycota (Mucoromycota). Mucor spp. are significant spoilage agents of concern in fresh or short-ripening cheese matrices [2,3,[5], [6], [7], [8], [9]]. Some of the Mucor species can grow under anaerobic conditions but this hardly is the case with cheese packed in a vacuum or modified atmosphere. Furthermore, they are well adapted to the dairy environment, lower temperatures and pH [[10], [11], [12], [13], [14], [15]]. In the context of cheese making, Mucor circinelloides van Tieghem is recognised as a source of spoilage of produce. This fungus is a dimorphic organism that can switch between the yeast-like and hyphal phase, depending on the environmental conditions [14,[16], [17], [18], [19]]. Several species of Mucor are known to cause diseases. M. circinelloides was recorded as an etiologic agent of mucormycosis in immunosuppressed patients after ingestion of contaminated yoghurt [[20], [21], [22]].
Predictive microbiology is considered a highly relevant concept for the quantitative description and prediction of microbial behaviour in foods. It also belongs to the most important decisive tools used in microbiological food safety and quality assurance. Among several approaches such as measurements of hyphal length, colony diameter, heat production rate, colony biomass, and amount of chitin or ergosterol that have been developed to quantify the growth of filamentous fungi on solid substrates, the most common and simplest is the direct measurement of colony diameter over time [23,24].
The main objective of this work was to characterise the mycelial growth of M. circinelloides, one of the fungal contaminants that frequently appear in the artisan cheese production environment and the surface of the cheese. In the context of predictive mycology, the model proposed by Baranyi et al. [25] has originally been developed to describe bacterial growth; however, many authors confirmed its accurate prediction capability for fungal growth [[26], [27], [28], [29], [30], [31], [32], [33], [34], [35], [36], [37], [38]]. Following a detailed mechanistic approach, Huang developed another primary growth model [39,40], which is grounded in the fundamental growth phenomenon of microorganisms and clearly defines the duration of the lag phase and the exponential growth rate [41]. Despite being an alternative to the model proposed by Baranyi and Roberts [42,43], Huang's model has been less implemented in fungal growth quantification. To the best of the authors' knowledge, only a few comparisons between the Baranyi and Huang models have been made when modelling fungal growth [44]. Therefore, in addition to providing data on the mycelial growth of M. circinelloides, this study aims to apply the Huang and Baranyi models to estimate the kinetic response of M. circinelloides in CBA under different environmental conditions (temperature and salt content). The other objectives were to compare the performance of the primary models and also to estimate how it will be reflected in secondary modelling. Moreover, within validation, the present study quantifies the growth of M. circinelloides with dynamic changes in storage temperature.
Material and methods
2
Fungal isolate and culture conditions
2.1
The fungal isolate M. circinelloides 1L was selected for its significance in fresh or short-ripened cheese products and the dairy environment. This isolate was obtained from the culture collection of the Institute of Food Science and Nutrition (Slovak University of Technology in Bratislava, Slovakia) and was originally isolated from the traditional Slovak cheese "Bryndza" [45]. The confirmation of strain 1L is based on the morphological and physiological characteristics following Pitt and Hocking [6], Botha and Botes [46], and Samson et al. [47]. The molecular identification was performed at the Institute of Molecular Biology of the Slovak Academy of Sciences and was carried out according to Pangallo et al. [48].
The stock culture was regularly propagated and maintained refrigerated (5 ± 0.5 °C) on SAB slants (Sabouraud Dextrose agar, Biolife Italiana Srl, Milan, Italy) slants. For long-term storage, the culture was kept frozen at −70 °C in tubes containing yeast malt broth (Sigma-Aldrich, St. Louis, MO, USA) supplemented with 20 % glycerol.
Inoculum preparation
2.2
The inoculum was prepared from a 5-day culture grown on the top layer of a perpendicular SAB agar tube at 25 ± 0.5 °C to obtain a heavily sporulating culture. A suspension was then prepared by washing the culture with sterile saline solution (8.5 g L^−1^ NaCl, 0.1 g L^−1^ of peptone) containing 0.01 % (v/v) of the Tween® 80 wetting agent (Merck KGaA, Darmstadt, Germany). Immediately after preparation, the suspension of the fungal strain was adjusted to 10^3^ spores/mL and used for inoculation.
Experimental design and growth studies
2.3
All experiments were performed on plates with cheese-based agar (CBA) [49,50]; with the following composition: casamino acids (15 gL^−1^) (Merck KgaG, Darmstadt, Germany), sodium lactate (38 mL L^−1^) (Merck KgaG, Darmstadt, Germany), yeast extract (1 g L^−1^) (Biolife Italiana, Milano, Italy), CaCl_2_ (0.1 g L^−1^) (Centralchem, Bratislava, Slovakia), MgSO_4_ (0.5 g L^−1^) (Centralchem, Bratislava, Slovakia), KH_2_PO_4_ (6.8 g L^−1^) (Centralchem, Bratislava, Slovakia), NaCl (Centralchem, Bratislava, Slovakia), lactose (28 g L^−1^) (Merck KgaG, Darmstadt, Germany) and l-methionine (6 g L^−1^) (Merck KgaG, Darmstadt, Germany) and agar-agar (Merck KgaG, Darmstadt, Germany). After sterilisation, 50 mL of medium was poured into sterile Petri dishes (diameter 130 mm). Then 2 μL of M. circinelloides spore suspensions were used to inoculate the centre of each CBA plate. In this study, the initial diameter (d0) of the inoculated spore suspension was established at 2.5 mm. For all experiments, time zero was defined as the time the suspension was applied to the surface of the agar plate. After inoculation, three parallel plates were sealed in polyethylene bags to prevent water loss.
The diameters of developing colonies were measured at appropriate time intervals, using a Vernier calliper (150 mm × 0.02 mm; Sinochem Jiangsu, Nanjing, China) in two directions at right angles to each other, without opening the dishes. The final diameter of the colonies (expressed in mm) was calculated as an arithmetic mean. Measurements were taken from the early stages of growth to capture the lag phase.
Two sets of experimental conditions were implemented, one under constant temperatures and the other non-isothermal, both in two different aw scenarios: 0.974 ± 0.002 (unmodified growth medium) and 0.963 ± 0.003 (1 % NaCl, w/v). The aw measurements were performed with LabMaster-aw (Novasina, Lachen, Switzerland).
For isothermal incubation, plates were stored at temperatures of 6, 8, 12, 15, 18, 21, 25, 30, 33, 35, and 37 ± 0.5 °C in incubators (Pol-Eko Aparatura, Wodzisław Śląski, Poland) under static aerobic conditions. The following temperature levels were selected to cover the growth region of the species to the maximum extent possible.
The validation study was carried out under dynamic temperature regimes (25 °C/48 h, 18 °C/48 h, 15 °C/120 h, 10 °C/120 h), which simulates the time and temperature conditions during the ripening of lump cheese, a raw material for Bryndza cheese [51]. The non-isothermal temperature profile may also cover the fluctuating conditions that may occur during other cheese manufacturing at their early ripening phase. The high-precision programmable incubator (model ES-20/80C; Biosan SIA, Riga, Latvia) was used to ensure the above time/temperature conditions.
Growth data modelling
2.4
Primary modelling
2.4.1
Two primary models, Baranyi and Roberts [42,43] and Huang [39,40] were used to fit the experimental data from each growth curve. The sigmoidal Baranyi function was analysed using the Excel-based tool (Microsoft Excel, Redmond, WD, USA) ‘DMFit’ version 3.5 (ComBase managed by the United States Department of Agriculture-Agricultural Research Service, Washington, USA; and the University of Tasmania Food Safety Centre, Hobart, Australia). The reparametrized Baranyi model for fungal growth is described by the following equation.
where is the colony diameter (mm) in actual time, is the maximum surface growth rate (mm.h^−1^), (h) is the lag phase duration, is the final colony diameter and is the diameter in time zero. This model can describe growth curves either with or without the lag phase and with or without the stationary phase. This curvature is controlled by two parameters, namely, upper asymptote (n) and lower asymptote (m). The m curvature and n curvature parameters were set to 10, by default. The equation in identical form was applied also by Zardetto et al. [52].
Huang's model was solved numerically as a differential equation using the analysis tool Solver incorporated into Microsoft Excel 365. The following reparametrized equation was used for fungal growth:
where is the transition function, is time, and is the lag phase transition coefficient. The parameter α was set at 4 as suggested by the authors [40].
Secondary modelling
2.4.2
The estimates of sgrmax and λ were modelled with the secondary cardinal model (CM; Eqs. (5), (6)), respectively) by Rosso et al. [53] to describe the effects of temperature on fungal growth at the aw values of 0.974 and 0.963 representing the aw value of CBA and the medium with 1 % addition of NaCl (w/v), respectively.
where
This secondary model includes four parameters with direct biological meaning, such as direct sgrmax, λ, Tmin (theoretical minimum temperature), Topt (optimal temperature) and Tmax (maximum temperature above which fungal growth is not likely). The parameters of the model, including their errors, were estimated with non-linear regression tools incorporated in Statistica vs. 10 (Tibco, Santa Clara, USA).
Statistical analysis and model validation
2.4.3
Triplicated data obtained from primary modelling were treated with analysis of variance (ANOVA) to compare whether the prediction capability of the Baranyi and Huang models for the growth of M. circinelloides was significant. A statistical analysis with the least significant difference of 95 % was performed using Microsoft Excel 365.
To evaluate the accuracy of the response model fitting and predictions, the evaluation criteria of the coefficient of determination (R^2^) and the root mean square error (RMSE) evaluation criteria were used:
where , and are the experimental (observed), calculated (predicted) and average sgr or λ data, respectively; n is the number of experimental observations; and p is the number of model parameters [54,55].
The bias and accuracy factors were calculated using the following equations [56]:
Independent growth experiments were carried out in the following dynamic combinations of t/T: 2 d/25 °C, 2 d/18 °C, 5 d/15 °C and 5 d/10 °C) to validate the secondary CM estimated for sgr and λ. The predicted diameters of M. circinelloides colonies for validation experiments were calculated as the sum of the diameters calculated in each t/T combination in which the general primary growth model with only lag and exponential phase was used: . Eqs. (5), (6)) were used to calculate sgrcal and lag(CM)cal, respectively.
Results and discussion
3
Primary modelling of M. circinelloides mycelial growth
3.1
The traditional approach in predictive mycology research is to observe fungal growth on a solid agar surface under different selected constant environmental conditions, such as isothermal conditions, to determine the kinetic parameters of a suitable primary model after observations are made. This study aimed to evaluate the growth response of M. circinelloides on a cheese-based medium (CBA) at temperatures ranging from 6 to 37 °C, to compare the performance of the Baranyi model (BM) and the Huang model (HM). Representative fits of these primary models to experimental data at 6, 21 and 33 °C are presented in Fig. 1. Similar behaviour was observed for the other conditions tested. The estimated averages of the main parameters (sgr and λ) from the primary modelling are summarised in Table 1.Fig. 1. Growth curves of M. circinelloides 1L on CBA at 6, 21 and 33 °C according to the Baranyi (solid lines) and Huang prediction model (dashed lines). The points ◊ represent the observed values of colony diameter of M. circinelloides on CBA without NaCl and points Δ represent the observed values of colony diameter of M. circinelloides on CBA agar with 1 % NaCl.Fig. 1. Table 1Average surface growth parameters of M. circinelloides 1L on CBA.Table 1T (°C)NaClsgr (mm.h^−1^)λ (h)dmax (mm)R^2^RMSE (mm)BMHMBMHMBMHMBMHM600.080* ±<0.0010.077 ±<0.001139.9 ± 3.7134.1 ± 5.9113.6 ± 2.09.995 × 10^−1^9.998 × 10^−1^0.8631.66610.064* ±<0.0010.062 ±<0.001182.2 ± 13.6171.5 ± 14.3104.2 ± 1.39.984 × 10^−1^9.965 × 10^−1^1.4692.461800.117* ±<0.0010.115 ±<0.001119.1 ± 2.7113.0 ± 4.5122.0 ± 1.89.998 × 10^−1^9.995 × 10^−1^0.6190.89410.078 ± 0.0030.077 ± 0.003123.4 ± 5.2120.0 ± 5.293.1 ± 3.29.948 × 10^−1^9.941 × 10^−1^2.4222.6271200.162* ±<0.0010.159 ± 0.00167.9 ± 4.263.5 ± 3.5121.1 ± 1.69.996 × 10^−1^9.995 × 10^−1^0.7440.86010.090 ± 0.0020.086 ± 0.00289.4 ± 11.382.6 ± 11.069.4 ± 2.29.946 × 10^−1^9.938 × 10^−1^1.8892.0421500.183 ± 0.0040.176 ± 0.00445.2 ± 2.141.2 ± 4.6113.9 ± 3.69.971 × 10^−1^9.963 × 10^−1^2.2282.57710.097 ± 0.0040.094 ± 0.00467.1 ± 4.062.2 ± 3.781.3 ± 1.69.970 × 10^−1^9.969 × 10^−1^1.5861.6341800.207 ± 0.0050.200 ± 0.00634.2* ± 1.631. 8 ± 0.6111.6 ± 1.79.984 × 10^−1^9.970 × 10^−1^1.5592.20010.108 ± 0.0030.105 ± 0.00362.7 ± 7.258.0 ± 5.490.6 ± 1.39.962 × 10^−1^9.963 × 10^−1^2.1512.1432100.211* ± 0.0040.198 ± 0.0047.9 ± 1.38. 6 ± 1.091.5 ± 0.99.933 × 10^−1^9.903 × 10^−1^2.8503.51410.116 ± 0.0040.112 ± 0.00354.5* ± 1.550.7 ± 2.084.6 ± 1.29.979 × 10^−1^9.981 × 10^−1^1.5061.4632500.215 ± 0.0020.206 ± 0.00627.3 ± 1.718.5 ± 3.895.2 ± 1.59.931 × 10^−1^9.879 × 10^−1^2.9023.87610.126 ± 0.0060.122 ± 0.00649.9 ± 3.344. 7 ± 4.181.6 ± 4.09.907 × 10^−1^9.999 × 10^−1^2.9903.1913000.289 ± 0.0260.272 ± 0.02431.6 ± 3.726.0 ± 3.2103.4 ± 4.09.769 × 10^−1^9.766 × 10^−1^6.4066.66310.142* ± 0.0030.136 ± 0.00244.2* ± 0.241.0 ± 0.756.0 ± 1.99.976 × 10^−1^9.969 × 10^−1^1.0581.2133300.276 ± 0.0110.264 ± 0.01127.0 ± 3.124.1 ± 2.792.7 ± 3.39.891 × 10^−1^9.876 × 10^−1^3.8414.23310.162 ± 0.0040.155 ± 0.00545.8 ± 4.542.8 ± 4.552.2 ± 3.29.915 × 10^−1^9.915 × 10^−1^1.8221.8743500.258* ± 0.0020.243 ± 0.00322.4 ± 2.018.2 ± 1.793.8 ± 3.29.972 × 10^−1^9.955 × 10^−1^1.9612.59510.048 ± 0.0030.049 ± 0.003nlnl11.2 ± 0.69.158 × 10^−1^9.247 × 10^−1^0.5750.5673700.067 ± 0.0060.066 ±<0.00124.5 ± 0.724.5 ± 0.918.4 ± 2.59.365 × 10^−1^9.380 × 10^−1^1.5481.570T – incubation temperature; sgr – surface growth rate; λ – lag phase duration; nl – no lag; dmax – maximum diameter of colonies in stationary phase*;* BM – parameters calculated using Baranyi model; HM – parameters calculated using Huang model. Superscript * indicates a statistically significant difference between the parameter fitted with BM and the relevant parameter fitted with HM (α = 0.05).
The experimental data on M. circinelloides growth showed a typical fungal growth curve, as has been reported by various authors [35,36,[57], [58], [59]]. A lag phase was observed before the formation of a visible colony and was followed by linear growth in all cases. Subsequently, a noticeable deceleration of growth was observed in the stationary phase. However, the stationary phase was not achieved at 8 and 12 °C in a medium without salt addition due to the limited growth surface on Petri dishes of diameter 130 mm used in these trials.
Approximately after 7 days, this dairy isolate of M. circinelloides can grow at a rate of 1.8–1.5 mm d^−1^ even at the lowest temperature of 6 °C, which is consistent with Gougouli et al. [58] and Snyder et al. [16], who reported that the growth response of M. circinelloides is restricted at temperatures below 6 °C. On the other hand, the result showed that an increase in temperature to 30 °C or 33 °C leads to the fastest growth of the organism at levels of 6.9 mm d^−1^ to 6.3 mm d^−1^. However, a subsequent increase in temperature to 35 °C resulted in a decrease in growth rate. According to the experiments, no growth was observed even after 1 month of incubation at 37 °C on CBA with 1 % NaCl. A similar pattern was reported by Gougouli et al. [58], who did not observe any growth of M. circinelloides in yoghurt with a 10 % fat content at 37 °C.
Through the statistical parameters obtained by fitting both models to growth curves, it can be noticed that both models fit well to the experimental data, with R^2^ values higher than 9.158 × 10^−1^ for Baranyi curves and R^2^ higher than 9.247 × 10^−1^ for those of the Huang model. The resulting Baranyi curves were almost similar to those of the Huang model with a mean RMSE of 1.281 mm (n = 83), which was slightly lower than the mean RMSE value (1.758 mm; n = 83) of the Huang model. However, at some temperatures (at 18, 21 and 35 °C in a CBA with 1 % NaCl), the RMSE values of the Baranyi model resulted in relatively higher RMSE values compared to those of the Huang model. Several studies have reported similar values of R^2^ and RMSE values for fungal growth and have concluded that the fit quality is appropriate and acceptable [30,44,57,[60], [61], [62], [63]].
In general, the results of this study indicate that slightly higher surface growth rates and lag phases were obtained when the Baranyi model was compared to the Huang model. These findings are in agreement with previous studies [44,[64], [65], [66]]. The statistical analysis of growth kinetics performed using ANOVA revealed that there were no significant differences in the effect of model selection on the mycelial growth rate and lag phase duration at an α level of 0.05 in most data sets, as has been reported by various authors [64,[66], [67], [68]]. Overall, the values for surface growth rate and lag phase duration were more influenced by temperature than by model selection. These findings coincide with Juneja et al. [64], who reported that primary growth data were affected by temperature rather than model choice.
The slightly lower values of R^2^ from Table 1 for the Huang model can be attributed to the transition coefficient α that promotes a sharp but smooth, transition from the lag to the exponential phase. On the other hand, Huang's modelling approach has a more clearly identifiable lag phase, which is distinguishable from the exponential phase of growth. Other studies have also confirmed these findings [[67], [68], [69], [70], [71]]. On the other hand, the Baranyi model demonstrated slightly improved performance on the transition between the exponential phase and stationary growth phase. Hong et al. [72] demonstrated a similar pattern of transition from exponential to stationary phase of growth curves for Clostridium sporogenes analysed with the Baranyi model and Huang model.
The comparison between estimated sgr and λ using the Baranyi and Huang model is shown in Fig. 2A and B, respectively. It seems that both growth parameters estimated using HM are negligibly underestimated as compared with the BM parameters. The coefficients of determination, as well as the standard errors of their linear relations, are close to 1 (R^2^ = 9.984 × 10^−1^ and 9.823 × 10^−1^; SE = 0,07 mm d^−1^ and 5.4 d) for sgr and λ, respectively.Fig. 2. Comparison of the growth parameters as estimated with the Baranyi and Huang primary models.Fig. 2
Secondary modelling of M. circinelloides growth
3.2
Experimental observations indicate that the incubation temperature influenced M. circinelloides growth parameters. In this study, the surface growth rate (sgr) and the natural logarithm of the reciprocal lag values (ln 1/λ) estimated from the Baranyi and Huang models were fitted using the secondary cardinal model equation (CM; Eqs. (5), (6))).
The output of surface growth rate and lag phase modelling of M. circinelloides growth on CBA for both modelling approaches is presented in Fig. 3, Fig. 4, respectively. As expected, the sgr increased with an increase in temperature up to optimum and then decreased beyond the physiological limits of the isolate. The duration of the lag phase showed a reverse pattern of response, the lag times decreased with increasing temperature and slightly increased in the area beyond the optima towards the maximum values of temperature. The values of the CM parameters are summarised in Table 2.Fig. 3. Plots of the surface growth rates of the M. circinelloides 1L versus temperature (6–37 °C) on CBA without the addition of NaCl (blue line) and with 1 % addition of NaCl (yellow line) obtained from the Baranyi model (A) and Huang model (B). The symbols ◊ and □ indicate the experimental sgr at each incubation temperature. Solid lines represent the fitted model estimates according to the CM. Dashed lines represent predicted sgr values with added or subtracted RMSE values. (For interpretation of the references to colour in this figure legend, the reader is referred to the Web version of this article.)Fig. 3. Fig. 4Plots of the natural logarithm of the reciprocal lag phase duration of the M. circinelloides 1L versus temperature (6–37 °C) on CBA without the addition of NaCl (blue line) and with 1 % addition of NaCl (yellow line) obtained from Baranyi model (A) and Huang model (B). The symbols ◊ and □ indicate the experimental values at each incubation temperature. Solid lines represent the fitted model estimates according to the CM. Dashed lines represent predicted sgr values with added or subtracted RMSE values. (For interpretation of the references to colour in this figure legend, the reader is referred to the Web version of this article.)Fig. 4. Table 2Mathematical indices and validation factors of the cardinal model (CM) which describe the effects of temperature and NaCl addition on M. circinelloides 1L mycelial growth on CBA.Table 2. Baranyi modelHuang modelParameter0 % NaCl1 % NaCl0 % NaCl1 % NaClCM_sgrCMln(1/λ)CMsgrCMln(1/λ)CMsgrCMln(1/λ)CMsgrCMln(1/λ)sgropt_ (mm.d^−1^)6.789 ± 0.117–3.686 ± 0.053–6.469 ± 0.113–3.537 ± 0.050–1/λopt (1/d)–1.192 ± 0.148–0.518 ± 0,019–1.401 ± 0.149–0.564 ± 0.017Tmin (°C)−28.63 ± 1.24−0.30±0.01−43.85 ± 2.461.86±0.36−29.52±1.34−0.36±0.01−44.60 ± 2.64−2.17±0.06Topt (°C)32.15±0.1028.83 ± 0.3232.55 ± 0.1333.22 ± 0.8032.08±0.1028.90±0.2732.47±0.1331.70±0.72Tmax (°C)37.22±0.0243.47 ± 1.6135.06 ± 0.0164.79 ± 3.0937.23±0.0241.44±0.8735.06±0.0158.38±3.70R^2^9.391 × 10^−1^7.163 × 10^−1^9.734 × 10^−1^9.578 × 10^−1^9.365 × 10^−1^7.828 × 10^−1^9.714 × 10^−1^9.700 × 10^−1^RMSE0.4290.4260.1360.0810.4130.3790.1330.078CM_sgr_ – estimated CM parameters and statistical indices for surface growth rate (sgr) modelling of M. circinelloides against temperature; CM_ln(1/λ)_ - estimated CM parameters and statistical indices for lag time (λ) modelling; sgropt–surface growth rate at the temperature optimum; Tmin – minimum temperature (theoretical value); Topt – optimal temperature; Tmax – maximum temperature*; R*^2^ – coefficient of determination; RMSE – root mean square error.
Among them, the Tmin values estimated by the CM rate model appear unrealistically negative, as well as lower values at higher NaCl concentrations. However, it is generally known that the Tmin provided by the CM model is considered theoretical. For example, for pseudomonades, Tarlak [73] also estimated low Tmin values of −12.6 to −17.9 °C.
Time to create visible colonies
3.3
The cardinal parameters for the lag phase and surface growth rate were used to predict the times required for visible colonies that can be useful, e.g., in dairy practice. Generally, such predictions are important for fast-growing fungal species such as M. circinelloides representing lower fungi [6]. Referring to microscopic fungi, the 3 mm colony is considered visible (t3) under a set of specific environmental conditions [24,58,61]. For this purpose, the time predictions with temperature are shown in Fig. 5. Based on the estimated results, the t3 is minimized when M. circinelloides displays higher surface growth rates. Other studies have also confirmed these findings [58,61].Fig. 5. The prediction of the time required for M. circinelloides 1L to yield visible (3 mm) colonies on the CBA depending on temperature and NaCl addition. Solid lines represent the predicted t3 and dashed lines represent predicted t3 values with added or subtracted RMSE values.Fig. 5
The growth data presented in this work confirmed the rapid growth characteristic of M. circinelloides is characterised by a short time to yield a visible colony. M. circinelloides exhibits a faster growth rate compared to G. candidum, a mould commonly referred to as the "machinery mould" [74]. Koňuchová and Valík [59] reported that the calculated t3 values for two strains of G. candidum on skim milk agar at aw 0.97 at 10 °C were in the range of 8.6–12.1 d. In contrast, M. circinelloides needed only 4 d to create a visible colony in CBA at the same aw and temperature. Burgain et al. [75] reported calculated t3 values of 2.3 days for Penicillium chrysogenum 738 on potato dextrose agar at aw 0.970 at 25 °C. Conversely, M. circinelloides studied in the present study required only 1.3 d to create a visible colony in CBA under analogous aw and temperature conditions. These observations align with those of Gougouli et al. [58], underlining the classification of M. circinelloides among dairy spoilage fungi characterized by the shortest t3 values. From the practical point of view and taking the sensitivity of this mould to NaCl, e.g. almost 50 % reduction of sgropt caused by a concentration of 1 %, the above data support the decision on the frequency of washing the surface of cheese lumps with a salt solution.
Validation at the dynamic temperature change
3.4
For validation, additional experiments with programmed temperature changes were performed under conditions of 0 and 1 % NaCl on CBA. The combination of time and temperature (25 °C and 18 °C, each for 2 d; 15 °C and 10 °C, each for 5 d) reflected the fermentation and ripening conditions for the artisan production of ewe lump cheese, which is produced from raw and pasteurised milk in Slovakia. The results of validation using CMs with the parameters from Table 2, including lag models, are shown in Fig. 6 and the validation indices are summarised in Table 3.Fig. 6. Validation of the CTMI growth models for M. circinelloides on CBA at dynamic temperature changes (25 °C/48 h; 18 °C/48 h; 15/120 h; 10 °C/120 h).Fig. 6. Table 3Mathematical indices and validation factors of cardinal model (CM) which describe the effects of temperature and NaCl addition on M. circinelloides 1L mycelial growth on CBA at dynamic temperature changes.Table 30 % NaCl1 % NaClR^2^9.917 × 10^−1^9.660 × 10^−1^RMSE2.3491.772Bf1.1320.950Af1.2211.119***%D***f−22.058−11.947R^2^ – coefficient of determination; RMSE – root mean square error; Af – accuracy factor; Bf – bias factor; %Df – % discrepancy.
The RMSE values for growth on CBA without NaCl and with 1 % NaCl addition were 2.349 and 1.772 mm, respectively. Both the graphical evaluation and satisfactory Bf and Af limits demonstrated an acceptable model performance [76,77] in predicting the growth of M. circinelloides on CBA. Meanwhile, the calculated Bf value for the growth of M. circinelloides on CBA without NaCl addition was 1.132. Thus, the observed colony diameters are overestimated by less than 13.2 % and their calculation based on secondary CM models would lead to a “fail-safe” prediction. In the case of the nonisothermal growth on CBA with 1 % NaCl, the calculated Bf value indicated that the model slightly underestimates observed values and would provide a “fail-dangerous” prediction. In a modelling study carried out on apple puree agar medium, using the Ratkowsky model comparison of predicted and estimated growth rates of Penicillium expansum resulted in Bf between 0.91 and 1.14 [78]. The Bf values obtained in our study are of the same magnitude, if not closer to 1 as compared to the previously reported study. The Af factors of 1.221 and 1.119 showed that predicted values for the growth of M. circinelloides on CBA were a maximum of 22.1 % different (either smaller or larger) from observed values. These Af values are in close agreement with those obtained by Judet-Correia et al. [79], who reported Af of 1.11 and 1.29 for the growth rate estimates of Penicillium expansum and Botrytis cinerea.
Conclusions
4
Overall, the present study has successfully demonstrated the effective application of two primary models (Baranyi and Huang) to predict the growth of M. circinelloides on the surface of a cheese-based medium under isothermal conditions and two different levels of aw. The application of the Huang model to the mycelial growth of this cheese-associated fungus is an element of the originality of the present approach in the context of predictive mycology. In terms of prediction parameters, Baranyi and Huang models showed a similar degree of prediction capacity in predicting fungal growth. The maximum surface growth rate was then fitted to the secondary cardinal model to describe the colony growth rate as a function of temperature and aw. Based on modelling analysis, we concluded that the most suitable growing conditions were 0.974 aw (unmodified growth medium) and the temperature around 32 °C, resulting in the highest growth rate. The cardinal model was able to describe the impact of temperature and aw within the tested ranges on sgr with R^2^ values higher than or equal to 9.365 × 10^−1^ and RMSE lower than or equal to 0.429 mm d^−1^. Validation studies under dynamic temperature conditions indicated that the model used satisfactorily predicted the surface growth behaviour of M. circinelloides. The statistical indices obtained for the growth validation were within the range of 0.950 < Bf < 1.132 and 1.119 < Af < 1.221. The limitation of the study lies in the use of an artificial growth medium that has not included interactions with a background cheese microbiota. However, this fact can be considered a “fail-safe”, which is still a better case for predictions.
The predictive models used in this study have the potential to be used as a simulation tool for dairy processors, enabling them to monitor the microbiological quality of cheese before its distribution to consumers. The growth prediction data of the lower fungus studied, mainly the times required to create visible colonies, can also help cheese producers decide on the frequency of the washing step of cheese surfaces with salt solution, which is a normal part of the production process in the early stage of ripening. It is enabled because of the sensitivity of M. circinelloides and other frequent fresh cheese contaminants, e.g. G. candidum, to NaCl. The results of fast-growing microscopic moulds represented by M. circinelloides can be considered to support the development of cheese products, exposure assessment studies, or the formulation of modifications for high-quality cheese products. However, these ideas can become real if the fundamental role of prerequisites such as GMP and GHP is applied effectively.
Funding sources
The research was funded by the APVV-190031 and 10.13039/501100006109VEGA 1/0132/23.
Data availability
The data that support the findings of this study are available from the corresponding authors, [MK, ĽV], upon reasonable request.
CRediT authorship contribution statement
Martina Koňuchová: Writing – original draft, Supervision, Methodology, Investigation, Formal analysis, Conceptualization. Agáta Boháčiková: Investigation, Formal analysis, Data curation. Ľubomír Valík: Writing – review & editing, Visualization, Validation, Supervision, Software, Project administration, Methodology, Funding acquisition, Conceptualization.
Declaration of competing interest
The authors declare that they have no known competing financial interests or personal relationships that could have appeared to influence the work reported in this paper.
The reference list from the paper itself. Each links out to its DOI / PubMed record.
- 1Marín P.Palmero D.Jurado M.Effect of solute and matric potential on growth rate of fungal species isolated from cheese Int. Dairy J.362014899410.1016/j.idairyj.2014.01.012 · doi ↗
- 2Kure C.F.Skaar I.The fungal problem in cheese industry Curr. Opin. Food Sci.292019141910.1016/j.cofs.2019.07.003 · doi ↗
- 3Martin N.H.Torres-Frenzel P.Wiedmann M.Invited review: Controlling dairy product spoilage to reduce food loss and waste J. Dairy Sci.10420211251126110.3168/jds.2020-1913033309352 · doi ↗ · pubmed ↗
- 4Valle M.Van Long N.N.Jany J.-L.Bregier T.Pawtowski A.Barbier G.-Rigalma K.Vasseur V.Huchet V.Coroller L.Impact of water activity on the radial growth of fungi in a dairy environment Food Res. Int.157202210.1016/j.foodres.2022.111247 Article 11124735761558 · doi ↗ · pubmed ↗
- 5Montagna M.T.Santacroce M.P.Spilotros G.Napoli C.Minervini F.Papa A.Dragoni I.Investigation of fungal contamination in sheep and goat cheeses in southern Italy Mycopathol 158200424524910.1023/b:myco.0000041897.17673.2c 15518354 · doi ↗ · pubmed ↗
- 6Pitt J.I.Hocking A.D.Fungi and Food Spoilagefourth ed.2022 Springer(chapter 6)
- 7Morin-Sardin S.Rigalma K.Coroller L.Jany J.L.Coton E.Effect of temperature, p H, and water activity on Mucor spp. growth on synthetic medium, cheese analog and cheese Food Microbiol.562016697910.1016/j.fm.2015.11.01926919819 · doi ↗ · pubmed ↗
- 8Biango-Daniels M.Wolfe B.E.American artisan cheese quality and spoilage: a survey of cheesemakers' concerns and needs J. Dairy Sci.10420216283629410.3168/jds.2020-1934533888221 · doi ↗ · pubmed ↗