Higher N-terminal pro-brain natriuretic peptide level at onset of peritoneal dialysis-related peritonitis is a risk factor for technique failure
Niya Ma, Zhiyun Zang, Xia Liu, Yunyun Zhang, Xueli Zhou, Yi Tang, Zi Li

TL;DR
Higher levels of NT-proBNP at the start of peritoneal dialysis-related peritonitis are linked to a greater risk of treatment failure.
Contribution
This study is the first to show that NT-proBNP levels at PDAP onset independently predict technique failure.
Findings
Higher NT-proBNP levels were independently associated with technique failure in PDAP patients.
NT-proBNP outperformed other clinical variables in predicting technique failure.
The hazard ratio for technique failure was 3.020 for higher NT-proBNP levels.
Abstract
Recent studies have suggested that the N-terminal fragment of B-type natriuretic peptide (NT-proBNP) level serve as a significant risk factor for mortality in patients with end-stage renal disease. However, the relationship between NT-proBNP levels and technique failure in peritoneal dialysis-associated peritonitis (PDAP) remains unclear. This study investigated the relationship between NT-proBNP levels at the onset of PDAP and the risk of technique failure in patients with PDAP. A retrospective analysis was conducted on patients with PDAP from December 1, 2009, to December 31, 2021, at our peritoneal dialysis center. We recorded all demographic and baseline clinical data at the time of admission for each PDAP episode. Logistic and Cox regression analyses were performed to assess the association between NT-proBNP levels and technique failure. Of 485 PDAP episodes included in this…
Genes, proteins, chemicals, diseases, species, mutations and cell lines named across the full text — each resolved to its canonical identifier and authoritative record.
Click any figure to enlarge with its caption.
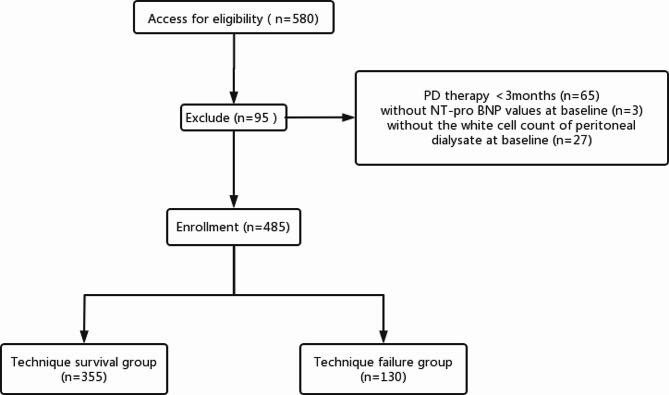 Figure 1
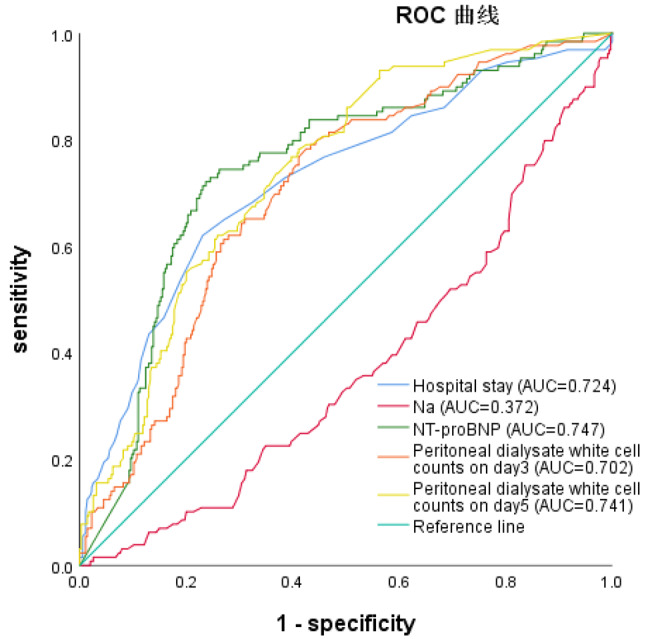 Figure 2
- —http://dx.doi.org/10.13039/100012542Sichuan Province Science and Technology Support Program
Peer Reviews
No public reviews on file for this paper yet. If you reviewed it on a platform where reviews are public (OpenReview, ICLR, NeurIPS, ICML), you can paste yours below so the community can read it here.
Videos
No videos yet. Explain this paper in a talk, walkthrough, or lecture? Add one.
Taxonomy
TopicsHeart Failure Treatment and Management · Dialysis and Renal Disease Management · Potassium and Related Disorders
Background
Peritoneal dialysis (PD) is a vital treatment for patients with end-stage renal disease (ESRD). However, peritonitis is a major complication of PD and the leading cause of technique failure. Peritoneal dialysis-associated peritonitis (PDAP) is a direct or major cause of death in 15% of patients undergoing PD [1, 2]. According to the Standardized Outcomes in Nephrology (SONG-PD) Initiative, PD-related infection has been identified as a core outcome of critical importance for patients and clinicians [3]. Therefore, it is important to accurately assess and identify the risk factors for peritonitis to prevent serious outcomes, including death.
Previous studies have focused on laboratory parameters to assess the risk of technique failure during PDAP, mainly focusing on coagulation and fibrin factors and serum albumin and C-reactive protein (CRP) levels [4–6]. The N-terminal fragment of B-type natriuretic peptide (NT-proBNP) is a biomarker of fluid volume overload and myocardial damage and has been used as a risk factor of mortality in patients with ESRD [7, 8]. Some studies have suggested that NT-proBNP may be a biomarker for estimating the risk of PD technique failure [9]. However, the association between NT-proBNP levels and technique failure in patients with PDAP is not yet understood.
The purpose of this study was to investigate whether the NT-proBNP level at admission for PDAP is associated with the incidence of technique failure in patients with PDAP. The findings of this study may provide new insights into the clinical management of patients with PDAP.
Methods
Study design and population
This single-center, retrospective study enrolled patients undergoing maintenance PD at the PD center of the West China Hospital, Sichuan University. Patients aged ≥ 18 years who were admitted due to PDAP between December 1, 2009, and December 31, 2021, were included in this study. PDAP was diagnosed in accordance with the criteria of the 2022 International Society for Peritoneal Dialysis (ISPD) guidelines. The exclusion criteria were as follows: (1) PD < 3 months, (2) missing data (absence of plasma NT-proBNP level, white cell count of peritoneal dialysate, or the results of pathogenic culture), and (3) loss to follow-up.
This study was approved by the Medical Ethics Committee of the West China Hospital of Sichuan University, Sichuan, China (2019-33) and was registered in the Thai Clinical Trials Registry (TCTR20180313004). This study adhered to the tenets of the Declaration of Helsinki, and written informed consent was obtained from all participants.
Data collection
Clinical and laboratory data were collected from electronic medical records and laboratory information systems. Clinical characteristics such as age, sex, place of residence, PD vintage, systolic blood pressure (SBP), and diastolic blood pressure (DBP) were recorded. Comorbidities, including diabetes mellitus (DM) and cardiovascular diseases (CVDs), were recorded. The Charlson Comorbidity Index (CCI) score was calculated based on the patient’s age and comorbidities. Baseline laboratory data, collected at the first examination after admission due to PDAP, included hemoglobin (HB), white blood cell count (WBC), neutrophil count, platelet count (PLT), direct bilirubin (DB), indirect bilirubin (IB), serum albumin (ALB), serum globulin (GLB), blood glucose (GLU), blood urea nitrogen (BUN), serum creatinine (Scr), uric acid (UA), triglycerides (TG), total cholesterol (CHOL), low-density lipoprotein cholesterol (LDL-C), serum sodium (Na), serum potassium (K), serum calcium (Ca), serum phosphorus (P), intact parathyroid hormone (iPTH), activated partial thromboplastin time (APTT), prothrombin time (PT), fibrinogen (FIB), NT-proBNP, and ferritin levels. The peritoneal dialysate white cell counts on days 1, 3, and 5, and the causative organisms according to culture results were also collected. The dialysate sample for pathogen culture was collected just after admission to the hospital, prior to the administration of empirical antibiotic therapy in our hospital.
Diagnostic criteria for PDAP and study outcomes
According to the Recommendations for the Prevention and Treatment of Peritonitis in ISPD: 2022 Update, PDAP was diagnosed when two or more of the following three factors were present: (1) abdominal pain and/or cloudy dialysis effluent; (2) dialysis effluent white cell count > 100/µL after a dwell time of at least 2 h, with > 50% polymorphonuclear leukocytes (PMN); and (3) positive dialysis effluent culture. According to the 2022 ISPD guidelines, patients with PDAP were allocated to one of two groups according to their clinical outcomes: (1) technique survival group: after 2–3 weeks of reasonable antibiotic treatment, the symptoms of peritonitis were completely relieved, the dialysate became clear, and the dialysate white blood cell count decreased to normal levels; (2) technique failure group: (a) peritonitis-related catheter removal; (b) temporary or permanent conversion to hemodialysis due to severe complications; and (c) death within 30 days of peritonitis onset or during hospitalization for peritonitis.
Statistical analysis
Continuous variables are expressed as mean ± standard deviation or median (interquartile range). The unpaired t-test was used for normally distributed data and the Mann–Whitney U test for non-normally distributed data. Categorical variables, expressed as frequencies (percentages), were compared using the chi-square test. Significant variables identified by univariate analysis were further analyzed using binary logistic regression to identify the independent prognostic power of the indices. Receiver operating characteristic (ROC) curves were used to analyze and summarize factors affecting the prognosis of patients with PDAP. Multivariate Cox regression models were used to analyze variables that were statistically significant in the univariate analysis as well as variables considered to be associated with technical failure. All statistical analyses were performed using SPSS 26.0 (IBM Corp., Armonk, NY, USA). A two-sided P value less than 0.05 was considered statistically significant.
Results
A total of 580 PDAP episodes were screened (Fig. 1). However, 95 episodes were excluded based on the following exclusion criteria: 3 episodes with missing data for the baseline NT-proBNP level, 27 episodes with missing data for the white cell count of the peritoneal dialysate, and 65 episodes with PD less than 3 months. The remaining 485 PDAP episodes were included in further analyses.
Fig. 1. Flow chart of the participants in the study. PD, peritoneal dialysis
Characteristics of the PDAP episodes
The baseline characteristics of the enrolled patients are presented in Tables 1 and 2. The average age was 50.5 years, and 259 (53.4%) of the patients were male. The median PD vintage was 25.7 months. There were 84 patients (17.3%) with DM and 114 patients (23.5%) with a history of CVD, and the average CCI score was 4.3. Regarding pathogenic organisms, 167 (34.4%) were gram-positive bacteria, 48 (9.9%) were gram-negative bacteria, 23 (4.7%) were fungi, 3 (0.6%) were mixed infections, and 244 (50.3%) were culture-negative. Most patients only had one episode of peritonitis, and the technique failure group had higher proportion of patients who experienced 2 or more episodes of peritonitis.
Table 1. Baseline demographic characteristicsvaiablesTotal (n = 485)Technique survival group(n = 355)Technique failure group(n = 130)P valueSex, male, n (%)259 (53.4)187 (52.7)72(55.4)0.596Age, year50.5 ± 14.050.3 ± 14.051.2 ± 14.00.529Residence, city, n (%)258 (53.2)192 (54.1)66 (50.1)0.517PD vintage, months25.7 (12.6, 54.1)25.2 (11.5, 48.8)36.8 (15.7, 69.9)0.002DM, n (%)84 (17.3)61 (17.2)23 (17.7)0.896CVD, n (%)114 (23.5)73 (20.6)41 (31.5)0.012CCI score, points4.3 ± 1.94.2 ± 1.94.6 ± 2.00.050SBP, mmHg135.5 ± 25.2135.3 ± 25.0136.0 ± 26.00.791DBP, mmHg84.2 ± 16.484.2 ± 16.384.2 ± 117.00.996Hospital stay, days15.0 (11.0, 21.0)14.0 (10.0, 18.0)21.0 (15.0, 29.3)< 0.001PDAP episodes0.1631 episode, n (%)426 (87.8%)317 (89.3%)109 (83.8%)2 episodes, n (%)51 (10.5%)34 (9.6%)17 (13.1%)≥ 3 episodes, n (%)8 (1.6%)4 (1.1%)4 (3.1%)Notes: Values are expressed as the mean ± SD, n (%), or median (Q1–Q3), Comparison between technique failure group and technique survival group
Comparison between technique failure group and technique survival group
There were 355 episodes with technique survival (73.2%) and 130 episodes with technique failure (26.8%). To explore the potential risk factors, we conducted a univariate analysis (Tables 1 and 2). The PD vintage and hospital stay in the technique failure group were significantly longer than those in the technique survival group (P = 0.002 and P < 0.001, respectively), and the incidence of CVDs was significantly higher in the technique failure group (P = 0.012).
As shown in Tables 2 and 3, ALB, BUN, and Na levels were significantly higher in the technique survival group than in the technique failure group (P < 0.05). The technique failure group had higher levels of WBC, PLT, neutrophils, CHOL, NT-proBNP, FIB, APTT, PT, and ferritin (P < 0.05). The peritoneal dialysate white cell counts in the technique failure group on days 3 and 5 were significantly higher than those in the technique survival group (P < 0.05). The proportions of fungal and multiple microbial infections were significantly higher in the technique failure group (P < 0.001 and P = 0.004, respectively). Compared to the technique survival group, the technique failure group displayed higher NT-proBNP levels for each category of infecting pathogen, including the culture-negative, gram-positive bacteria, and gram-negative bacteria groups, with statistically significant differences. However, within the technique survival and technique failure groups, we found no differences in NT-proBNP levels among the causative organisms.
Table 2. Baseline characteristics of laboratory variablesVariablesTotal (n = 485)Technique survival group (n = 355)Technique failure group (n = 130)p valueHB, g/L91.9 ± 20.793.0 ± 20.9288.9 ± 19.70.055PLT, 10^9^/L192.0 (144.0, 262.0)188.0 (138.0, 255.0)216.5 (163.0, 302.8)0.001WBC, 10^9^/L7.1 (5.7, 9.5)6.7 (5.3, 9.0)8.0 (6.2, 11.6)0.001Neutrophil, 10^9^/L5.5 (4.0, 7.7)5.0 (3.8, 7.2)6.27 (4.6, 9.3)< 0.001DB, µmol/L1.9 (1.3, 2.6)1.8 (1.3, 2.5)2 (1.2, 3.1)0.128IB, µmol/L2.9 (2, 4.25)3.0 (2.2, 4.3)2.4 (1.6, 3.6)< 0.001ALB, g/L29.2 ± 6.430.1 ± 6.426.8 ± 6.0< 0.001GLB, g/L27.90 (24.00, 32.00)27.10 (27.90, 32.30)29.1 (24.78, 34.2)0.009GLU, mmol/L5.5 (4.6, 7.0)5.4 (4.6, 7.2)5.8 (4.9, 7.5)0.267BUN, mmol/L17.2 (12.9, 21.4)17.2 (13.1, 21.6)16.4 (12.0, 20.8)0.049SCr, µmol/L880.6 ± 305.1883.0 ± 301.4874.0 ± 316.10.774eGFR, ml/(min1.73m^2^)5.1 (4.1, 6.6)5.1 (4.2, 6.6)4.9 (3.9, 6.5)0.280UA, µmol/L353.3 ± 87.4353.9 ± 79.5351.6 ± 106.40.795TG, mmol/L1.3 (0.9, 2.0)1.3 (0.9, 2.0)1.4(1.0, 2.1)0.091CHOL, mmol/L4.0 ± 1.14.1 ± 1.23.7 ± 1.0< 0.001LDL-C, mmol/L2.24 ± 0.952.34 ± 0.971.98 ± 0.88< 0.001Na, mmol/L138.1 ± 4.2138.6 ± 4.1136.7 ± 4.2< 0.001K, mmol/L3.78 ± 0.73.8 ± 0.73.7 ± 0.70.121Ca, mmol/L2.16 (2.01, 2.28)2.15 (2.01, 2.29)2.16 (1.99, 2.28)0.497P, mmol/L1.38 (1.09,1.74)1.36 (1.09,1.72)1.40 (1.76, 1.09)0.868Ferritin, ng/mL267.6 (176.7, 486.8)242.9 (156.3, 471.0)328.6 (190.6, 612.6)0.003iPTH, pmol/L21.3 (9.3, 37.1)20.4(8.0, 34.4)22.4 (11.5, 41.4)0.100PT, s12.20 (11.50, 13.10)12.00(11.50, 13.00)12.40 (11.88, 13.40)0.009APTT, s30.00 (26.80, 33.60)29.10(26.30, 32.88)31.30 (28.55, 36.88)< 0.001FIB, g/L5.08 (4.46, 6.19)4.83 (4.33, 6.04)5.56 (4.95, 6.59)< 0.001NT-proBNP, pg/mL9000.0 (4339.5, 17219.0)6872.0 (3495.0, 12379.0)17167.5 (10378.8, 23876.0)< 0.001Peritoneal dialysate white cell countsDay 1, 10^6^/L1240.0 (292.5, 3982.5)990.0 (285.0, 3600.0)1400.0 (290.0, 3790.0)0.775Day 3, 10^6^/L280.0 (70.0, 1034.0)140.0 (40, 661.8)799.5 (267.8, 2051.3)< 0.001Day 5, 10^6^/L70.0 (12.0, 360.0)30.0 (10.0, 225.0)340.0 (80.0, 715.0)< 0.001Causative organismsCulture negative244 (50.3%)183 (51.5%)61 (46.9%)0.367Gram-positive bacteria167 (34.4%)128 (36.1%)39 (30.0%)0.214Gram-negative bacteria48 (9.9%)34 (9.6%)14 (10.8%)0.697Fungal23 (4.7%)10 (2.8%)13 (10.0%)0.001Polymicrobial3 (0.6%)0 (0.0%)3 (2.3%)0.004Notes: Values are expressed as the mean ± SD, n (%), or median (Q1–Q3). *, Comparison between technique failure group and technique survival group
Table 3. Comparison of NT-proBNP levels based on causative organismNT-proBNP levelTotal (n = 485)Technique survival group(n = 355)Technique failure group(n = 130)P valueCausative organismsCulture negative (n = 244)8250 (4120, 15,910)6960 (3460, 10,550)17,570 (8630, 25,440)< 0.001Gram-positive bacteria (n = 167)8740 (4300, 18,250)6760 (3590, 12,770)18,470 (13,790, 31,740)< 0.001Gram-negative bacteria (n = 48)1030 (4690, 15,910)9570 (3830, 11,390)13,400 (6820, 20,420)0.045Fungal (n = 23)13,130 (8450, 29,790)9770 (4670, 23,070)14,420 (11,980, 31,690)0.192Polymicrobial (n = 3)17,370 (3970, 18,780)—17,370 (3970, 18,780)—P value0.1690.5440.438
Multivariate analyses indicated that hospital stay (OR, 1.056; 95% confidence interval [CI], 1.031-1.081; P < 0.001), Na (OR, 0.927; 95% CI, 0.865-0.994; p = 0.033), NT-proBNP (OR, 1.062; 95% CI, 1.035-1.090, P < 0.001), peritoneal dialysate white cell counts on day 3 (OR, 1.222; 95% CI, 1.030-1.449, P = 0.022) and on day 5 (OR, 2.367; 95% CI, 1.396-4.013, P = 0.001) were independently associated with treatment failure (Table 4).
Table 4. Multivariate analysis of risk factors of technique failureVariableOR (95% CI)P valueNa, mmol/L0.927 (0.865, 0.994)0.033Hospital stay, days1.056 (1.031, 1.081)< 0.001NT-proBNP, per 10^3^pg/mL increase1.062 (1.035, 1.090)< 0.001Peritoneal dialysate white cell counts on day3, per 10^3^/ul increase1.222 (1.030, 1.449)0.022Peritoneal dialysate white cell counts on day5, per 10^3^/ul increase2.367 (1.396, 4.013)0.001
ROC curves for NT-proBNP index and technique failure risk in PDAP
According to the ROC analysis, the NT-proBNP level was superior to hospital stay, Na, and peritoneal dialysate white cell counts on days 3 and 5 for indicating technique failure. The optimal cut-off value for NT-proBNP was 11,392 ng/L, with a Youden index of 0.486, sensitivity of 73.1%, and specificity of 75.5% (area under the curve [AUC], 0.747; 95% CI, 0.697, 0.797) (Fig. 2; Table 5).
Fig. 2. Receiver operating characteristic curves for the risk factors of treatment failure in peritoneal dialysis related peritonitis
Table 5ROC curve analysis. Notes: AUC area under the curve; CI confidence interval; ROC receiver operating characteristicVariableAUC95%CIP valueSensitivitySpecificityF1-scorecutoffNT-proBNP0.7470.697, 0.797< 0.00173.1%75.5%0.48611,392Na0.3720.316, 0.427< 0.00155.0%24.8%-0.202135.95Hospital stay0.7240.670, 0.777< 0.00162.3%76.9%0.39218.5Peritoneal dialysate white cell counts on day30.7020.652, 0.752< 0.00177.7%57.5%0.352255Peritoneal dialysate white cell counts on day50.7410.694, 0.788< 0.00178.5%58.9%0.37463Notes: AUC area under the curve; CI confidence interval; ROC receiver operating characteristic
NT-proBNP and technique failure risk in PDAP
Patients with PDAP episodes were allocated to one of two groups according to the median plasma BNP level: a low NT-proBNP group (plasma NT-proBNP < 9000 ng/L) and a high NT-proBNP group (plasma NT-proBNP ≥ 9000ng/L). The hazard ratios of NT-proBNP associated with PDAP from the adjusted Cox proportional hazard models are listed in Table 6. Cox regression analysis showed that the high NT-proBNP group had an increased risk of technique failure, with an HR of 3.020 (95% CI 1.771, 5.150, P < 0.001 compared with the low NT-proBNP group. Regardless of the adjustment model used, NT-proBNP (per-unit increase) and NT-proBNP ≥ 9000 (vs. NT-proBNP < 9000) independently increased the risk of technique failure in PDAP (Table 6).
Table 6. Adjusted and unadjusted Hazard Ratio for Cox proportional hazard modelsNT-proBNPNT-proBNP ≥ 9000ng/L (vs. NT-proBNP <9000ng/L)HR (95% CI)p valueHR (95% CI)p valueUnadjusted1.027 (1.011, 1.043)0.0012.658 (1.660, 4.255)< 0.001Model 11.027 (1.010, 1.043)0.0012.701 (1.684, 4.331)< 0.001Model 21.025 (1.008, 1.043)0.0042.765 (1.680, 4.549)< 0.001Model 31.030 (1.009, 1.051)0.0043.020 (1.771, 5.150)< 0.001Notes: model1: age, sexmodel2: model1 plus history of diabetes, history of CVD, the CCI score, PD duration, SBP, DBPmodel3: model2 plus HB, WBC, neutrophil, PLT, IB, ALB, GLB, CHOL, LDL-C, Na, iPTH, APTT, PT, FIB, ferritin, Peritoneal dialysate white cell counts on day 3 and 5
Discussion
An expanding body of research has focused on identifying the risk factors associated with adverse outcomes of PDAP. The early recognition of these factors can inform treatment strategies and improve patient prognosis. This study used a retrospective cohort design to investigate the relationship between NT-proBNP levels and technical failure in patients with PDAP. The findings revealed that higher serum NT-proBNP levels at the onset of PDAP were independently associated with technical failure within 30 days of peritonitis. After adjusting for confounding variables such as eGFR, sex, age, diabetes mellitus and cardiovascular disease, an elevated serum NT-proBNP level was still found to independently indicate serious outcomes, establishing the admission NT-proBNP level as an independent risk factor of technique failure in patients with PDAP.
NT-proBNP is an inactive amino-terminal fragment derived from the cleavage of pro-BNP and consists of 108 amino acids. The release of BNP counteracts the effects of the renin-angiotensin-aldosterone system [10–12]. The measurement of both BNP and NT-proBNP in plasma and serum serves as a valuable diagnostic and prognostic tool for management of congestive heart failure and other cardiovascular diseases [13, 14]. In general, BNP and NT-proBNP levels demonstrate a reasonable correlation, with NT-proBNP levels reflecting BNP levels. However, NT-proBNP has the advantages of a longer plasma half-life and lower biological variation than BNP [10, 15]. The half-life of BNP is approximately 20 min, whereas that of NT-proBNP extends to approximately 1–2 h, resulting in elevated circulating levels—the circulating NT-proBNP level is approximately six-fold higher than that of BNP—and slower fluctuations compared to BNP, despite their equal secretion ratios [10, 16]. As such, NT-proBNP might provide a superior index of dysfunction than BNP alone [17].
Wang et al. demonstrated the significant prognostic value of NT-proBNP in terms of cardiovascular congestion, mortality, and cardiovascular death in patients with chronic PD [18]. Furthermore, they suggested that the extent of NT-proBNP elevation in patients with chronic PD may, in part, reflect extracellular volume expansion rather than merely serve as a biomarker for left ventricular hypertrophy and systolic dysfunction [19]. Over half of patients with PD experience fluid overload [20, 21]. Previous studies have also established positive correlations among changes in NT-proBNP levels, extracellular fluid volume, total body water, and the ratio of extracellular fluid volume to total body water in dialysis patients [22]. Additional studies have demonstrated that increased NT-proBNP levels are associated with hypervolemia in patients on dialysis [11, 12].
Inflammation may contribute to the development of hypervolemia [12, 19, 23]. Consequently, patients with peritonitis are at higher risk of developing hypervolemia. Inflammation can increase peritoneal permeability, characterized by higher peritoneal transport, resulting in a gradual elevation in NT-proBNP levels, potentially attributable to heightened glucose reflux from the abdominal cavity into the bloodstream, augmented fluid reabsorption rates, diminished osmotic gradients, and reduced ultrafiltration volumes [24–27]. The urine volume may also decrease sharply during this course in the paitents with residual renal function. Consequently, this population is more susceptible to the perils of volume overload, such as heart failure, subsequent hemodialysis, and even mortality. Therefore, serial assessments of NT-proBNP levels may prove beneficial for evaluating the volume status in patients with PDAP, thereby assisting in clinical decision making to enhance technique outcomes.
In our study, we identified several factors independently associated with technique failure, including hospital stay, sodium levels, NT-proBNP levels, and peritoneal dialysate white cell counts on days 3 and 5. Among these factors, NT-proBNP showed the best sensitivity and accuracy as indicated by the largest area under the curve. We constructed three risk models, each with various confounding factors. The NT-proBNP level remained an independent indicator of technical failure in PDAP in all models. This finding highlights the importance of monitoring and managing fluid volume, including the NT-proBNP level and volumes of ultrafiltration and urine, in patients with PDAP. It is crucial not only to recognize and address volume overload but also to appropriately adjust peritoneal dialysis prescriptions to prevent persistent volume overload, which can lead to cardiac complications and increased mortality.
Our study had several limitations that should be acknowledged. First, it was a retrospective study conducted at a single center, which may have introduced bias into our findings. Therefore, it is necessary to conduct further large-scale cohort studies to better understand and validate these results. In addition, it is important to conduct further investigations to examine the pathogenesis of NT-proBNP levels in patients with PDAP. Second, certain variables such as IL-6, hs-CRP, and PCT were excluded because of high rates of missing data. Exploring the combination of these variables with NT-proBNP levels may provide more accurate prognostic values and should be considered in further studies. Third, although cardiovascular disease was included in risk model 2, we did not consider the presence of cardiac structural abnormalities, such as mitral insufficiency, which may influence NT-proBNP levels independently of fluid status. Furthermore, our data collection fell short in encompassing additional metrics for evaluating volumetric equilibrium, such as edema, weight fluctuations, detailed ultrafiltration, and extravascular lung water. This may potentially lead to inaccuracies in volume evaluation and volume control. Finally, the proportion of negative culture results was high. Notably, many of our patients live far from our hospital, and they have been prescribed antibiotics by local doctors before admission. The training of regional primary care physicians should therefore be strengthened, while simultaneously contemplating next-generation sequencing as a viable option for etiological diagnosis.
Conclusions
Our study identified a significant association between admission serum NT-proBNP levels and the risk of technique failure in patients with PDAP. Furthermore, the NT-proBNP level emerged as an independent risk factor for technique failure in these patients. These findings emphasize the importance of measuring NT-proBNP levels during PDAP and adjusting the volume status accordingly could potentially improve the prognosis of patients with PDAP.
The reference list from the paper itself. Each links out to its DOI / PubMed record.
- 1Cho Y Bello AK Levin A Peritoneal dialysis use and practice patterns: an international survey study[J]Am J Kidney Dis 20217733152510.1053/j.ajkd.2020.05.03232800844 · doi ↗ · pubmed ↗
- 2Mehrotra R, Devuyst O,Davies SJ et al. The current state of peritoneal dialysis[J]. J Am Soc Nephrol 2016,27(11):238–3252. 10.1681/asn.2016010112.10.1681/ASN.2016010112 PMC 508489927339663 · doi ↗ · pubmed ↗
- 3Manera KE Johnson DW Craig JC Establishing a core outcome set for peritoneal dialysis: report of the SONG-PD (standardized outcomes in Nephrology-Peritoneal Dialysis) consensus workshop Am J Kidney Dis 20207534041210.1053/j.ajkd.2019.09.01731955922 · doi ↗ · pubmed ↗
- 4Jiang J Wang LH Fei YY Zhou XW Peng L Lan L Ren W Serum albumin at start of peritoneal Dialysis predicts long-term outcomes in Anhui Han patients on continuous ambulatory peritoneal Dialysis: a retrospective cohort study Kidney Dis (Basel)201844262810.1159/00049242630574503 PMC 6276754 · doi ↗ · pubmed ↗
- 5Keskin GözmenŞSerdaroğlu E High C-reactive protein and number of previous episodes at diagnosis increase the risk of catheter removal in peritoneal dialysis-related peritonitis in children Ther Apher Dial 20232723283410.1111/1744-9987.1391135900028 · doi ↗ · pubmed ↗
- 6Huang YJ Xiong LP Zhang X Zhou JF Zhang R Higher D-dimer and activated partial thromboplastin time are poor prognostic factors in patients with peritoneal dialysis-related peritonitis Ther Apher Dial 20232759182510.1111/1744-9987.1402737357362 · doi ↗ · pubmed ↗
- 7Yang WL, Fahim M, Johnson DW. Pathophysiology and significance of natriuretic peptides in patients with end-stage kidney disease. Clin Biochem. 2020;83:1–11. 10.1016/j.clinbiochem.2020.05.013. Epub 2020 Jun 5. PMID: 32511964.10.1016/j.clinbiochem.2020.05.01332511964 · doi ↗ · pubmed ↗
- 8Ludka O Spinar J Tomandl J Konecny T Comparison of NT-pro BNP levels in hemodialysis versus peritoneal dialysis patients Biomed Pap Med Fac Univ Palacky Olomouc Czech Repub 201315743253010.5507/bp.2012.10123154540 · doi ↗ · pubmed ↗