Correction: CKLF1 Aggravates Focal Cerebral Ischemia Injury at Early Stage Partly by Modulating Microglia/Macrophage Toward M1 Polarization Through CCR4
Chen Chen, Shi‑Feng Chu, Qi‑Di Ai, Zhao Zhang, Fei‑Fei Guan, Sha‑Sha Wang, Yi‑Xiao Dong, Jie Zhu, Wen‑Xuan Jian, Nai‑Hong Chen

Abstract
Genes, proteins, chemicals, diseases, species, mutations and cell lines named across the full text — each resolved to its canonical identifier and authoritative record.
Click any figure to enlarge with its caption.
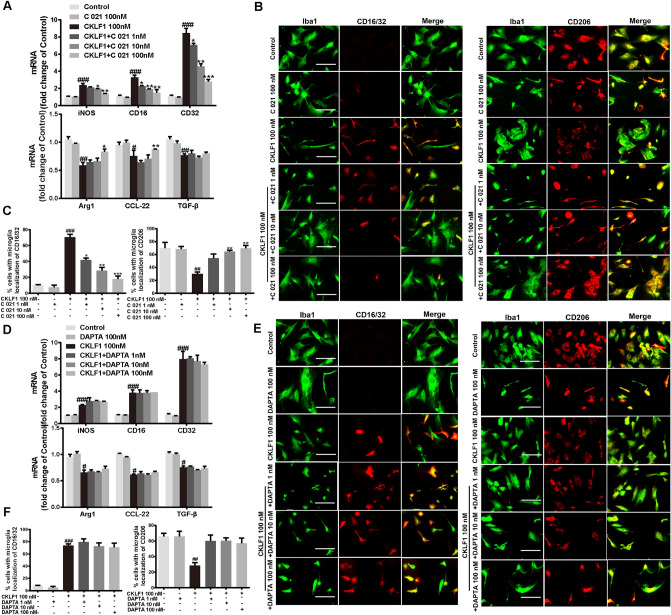 Figure 1
Peer Reviews
No public reviews on file for this paper yet. If you reviewed it on a platform where reviews are public (OpenReview, ICLR, NeurIPS, ICML), you can paste yours below so the community can read it here.
Videos
No videos yet. Explain this paper in a talk, walkthrough, or lecture? Add one.
Taxonomy
TopicsNeurological Disease Mechanisms and Treatments · Nuclear Receptors and Signaling · Intracerebral and Subarachnoid Hemorrhage Research
Correction to **: ** **Cellular and Molecular Neurobiology (2019) 39(5):651–669 ** 10.1007/s10571-019-00669-5
The original version of this article unfortunately contained error in Fig. 10.Fig. 10CKLF1 modulates the microglia polarization through CCR4. a qPCR analysis of mRNA expression levels of M1 markers (iNOS, CD16, CD32) and M2 markers (Arg1, CCL-22, TGF-β) in primary microglia treated with CKLF1 and C 021 dihydrochloride for 24 h (n = 6 cell samples). ^#^P < 0.05, ^##^P < 0.01, ^###^P < 0.001 versus control; *P < 0.05, **P < 0.01, ***P < 0.001 versus CKLF1 100 nM. b Representative photomicrographs of double-staining immunofluorescence of CD16/32 or CD206 with Iba1 in the primary microglia treated with CKLF1 and C 021 dihydrochloride for 24 h. Scale bars 100 μm. c Quantitative analysis of CD16/32-positive and CD206- positive microglia (n = 6 cell samples). ^##^P < 0.01, ^###^P < 0.001 versus control; *P < 0.05, **P < 0.01, ***P < 0.001 versus CKLF1 100 nM. d qPCR analysis of mRNA expression levels of M1 markers (iNOS, CD16, CD32) and M2 markers (Arg1, CCL-22, TGF-β) in primary microglia after treatment with CKLF1 and DAPTA for 24 h (n = 6 cell samples). ^#^P < 0.05, ^###^P < 0.001 versus control. e Representative photomicrographs of double-staining immunofluorescence of CD16/32 or CD206 with Iba1 in the primary microglia after treatment with CKLF1 and DAPTA for 24 h. Scale bars 100 μm. f Quantitative analysis of CD16/32-positive and CD206-positive microglia (n = 6 cell samples). ^##^P < 0.01, ^###^P < 0.001 versus control
In Fig. 10B, the merge image of C021 100 nM group of microglia stained with CD206 is published incorrectly. Other images in the figure remains the same, and the interpretation of the results remains unchanged.
The corrected figure is presented here.
The authors would like to apologise for any inconvenience caused.
The original article has been corrected.