Association between pathologic complete response and biochemical indicators after neoadjuvant therapy for HER2-positive breast cancer
Wei Chen, Jing Zhang, Fenxiang Li, Zongshun Chen, Junjie Li, Da-Lin Lu

TL;DR
This study explores how changes in blood lipid levels during treatment for a specific type of breast cancer may predict treatment success.
Contribution
The study identifies that fasting triglyceride levels during treatment may predict pathologic complete response in certain HER2-positive breast cancer subgroups.
Findings
Lower fasting triglyceride levels during neoadjuvant therapy are associated with higher likelihood of pathologic complete response in ER-negative HER2-positive breast cancer.
Fasting triglyceride levels may serve as a predictive biomarker for treatment response in PR-negative HER2-positive breast cancer.
Lipid management during treatment could offer both short-term and long-term benefits for some patients.
Abstract
This study investigated the changes in the fasting blood glucose (FBG), fasting triglyceride (FTG), and fasting total cholesterol (FTC) levels during neoadjuvant therapy (NAT) for human epidermal growth factor receptor 2 (HER2)-positive breast cancer (BC) and the association with pathologic complete response (pCR). Relevant data from Sichuan Cancer Hospital from June 2019 to June 2022 were collected and analyzed, and FBG, FTG, and FTC were divided into baseline, change, and process groups, which were grouped to analyze the changes after receiving NAT and the association with pCR. In the estrogen receptor (ER)-negative subgroup, patients with low levels of FTG in the process group were more likely to achieve pCR compared to high levels, and in the progesterone receptor (PR)-negative subgroup, patients with lower FTG compared to higher FTG after receiving NAT was more likely to achieve…
Genes, proteins, chemicals, diseases, species, mutations and cell lines named across the full text — each resolved to its canonical identifier and authoritative record.
Click any figure to enlarge with its caption.
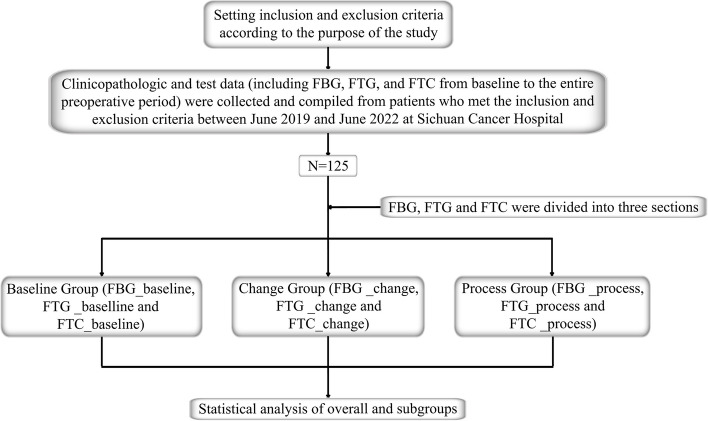 Figure 1
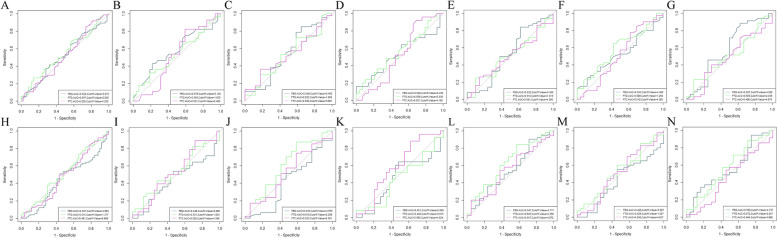 Figure 2
- —http://dx.doi.org/10.13039/501100018542Natural Science Foundation of Sichuan Province
- —http://dx.doi.org/10.13039/100007452Wu Jieping Medical Foundation
- —http://dx.doi.org/10.13039/501100001809National Natural Science Foundation of China
Peer Reviews
No public reviews on file for this paper yet. If you reviewed it on a platform where reviews are public (OpenReview, ICLR, NeurIPS, ICML), you can paste yours below so the community can read it here.
Videos
No videos yet. Explain this paper in a talk, walkthrough, or lecture? Add one.
Taxonomy
TopicsBreast Cancer Treatment Studies · HER2/EGFR in Cancer Research · Cancer Treatment and Pharmacology
Background
Breast cancer (BC) represents the most common malignant tumor in women, posing a severe health threat [1]. Furthermore, 15% ~ 20% of BC are human epidermal growth factor receptor 2 (HER2)-positive, which is clinically characterized by strong invasiveness and poor prognosis [2, 3]. Neoadjuvant therapy (NAT) is the standard preferred initial treatment for patients with HER2-positive BC (tumor primary stage ≥ 2 or lymph node status stage ≥ 1). This includes the TCbHP regimen of trastuzumab (H) and pertuzumab (P) in combination with paclitaxel and platinum drugs, and the A/EC-THP regimen of cyclophosphamide in combination with anthracycline sequenced with paclitaxel in combination with HP drugs [4, 5].
Pathologic complete response (pCR) is widely used for the alternative assessment of NAT efficacy since patients who achieve a pCR after receiving NAT have longer event-free survival (EFS) and overall survival (OS) periods [6–9]. Therefore, studies on clinicopathologic factors predicting pCR in HER2-positive BC are emerging, including hormone receptor (HR) expression status [10], histologic grading [11], and clinical staging [12].
However, receiving NAT to obtain pCR may cause or exacerbate biochemical marker abnormalities, including fasting blood glucose (FBG), fasting triglycerides (FTG), and fasting total cholesterol (FTC), increasing the risk of other diseases, especially cardiovascular disease (CVD) risk [13–17]. The association between these commonly used, highly reproducible, inexpensive, and convenient biochemical markers and NAT and pCR in HER2-positive BC has not yet been established.
This study analyzes the FBG, FTG, and FTC association with the existing NAT regimen and pCR to provide medical evidence for early HER2-positive BC glycemic, lipid management and pCR prediction.
Methods
Subjects and research design
This study examined the clinical and pathologic data of HER2-positive invasive BC patients who were first diagnosed and underwent surgery after combined neoadjuvant chemotherapy (NAC) and dual-targeted therapy (regimen: TCbHP or A/EC-THP) at the Breast Surgery Center of Sichuan Cancer Hospital from June 2019 to June 2022 (Fig. 1).Fig. 1. Technological route
Inclusion and exclusion criteria
The study included (1) females, (2) first diagnosed with HER2-positive invasive BC at the hospital, (3) clinical stages II or III, (4) unilateral BC, (5) complete and available baseline-to-preoperative FBG, FTG, and FTC profiles in fasting venous blood, (6) complete clinical and pathologic data, and (7) those receiving TCbHP or A/EC-THP as the NAT treatment regimen.
The study excluded (1) males, (2) surgery without standardized NAT combined with dual-targeted therapy, (3) incomplete test, clinical, or pathologic data, (4) stages I or IV BC, (5) patients receiving weekly treatments, (6) those with previously diagnosed cancers at the time of admission, (7) occult BC, (8) those who changed their regimen during the NAT period, (9) those who did not undergo the full treatment course at the hospital, and (10) FBG, FTG, and FTC test data from non-fasting venous blood.
Pathologic interpretation criteria
Estrogen receptor (ER) and progesterone receptor (PR) status were determined by immunohistochemistry (IHC), with ER and PR positivity [18] defined as positive nuclear staining in at least 1% of tumor cells, and HR negativity defined as negative for both ER and PR; otherwise, it was considered HR positivity. HER2 status [19] was determined by IHC and fluorescence in-situ hybridization (FISH), with HER2 3 + and HER2 2 + /FISH-positivity for HER2 positivity.
Clinical interpretation criteria
The clinical staging was guided by the eighth edition of the American Joint Committee on Cancer [20]. The menstrual status was interpreted in conjunction with questioning at the time of first diagnosis, age, and laboratory tests [21]. The reference ranges for follicle-stimulating hormone and estradiol in our hospital were (follicular phase 3.5–12.5, ovulatory phase 4.7–21.5, luteal phase 1.7–7.7, and menopausal phase 25.8–134.8) mIU/mL and (follicular phase 12.4–233, ovulatory phase 41–398, luteal phase 22.3–341, and menopausal phase < 5–138) pg/ml, respectively.
Biochemical interpretation criteria
The baseline patient group information was obtained from the test data at the first visit to the hospital (corresponding to the period before the start of the first NAT). The process group data was obtained from the average values of the period before the second NAT to the preoperative period. The FBG, FTG, and FTC reference ranges in the hospital were 3.89–6.11 mmol/L, 0.00–1.70 mmol/L, and 0.00–5.20 mmol/L, respectively, which might be interpreted differently by different testing instruments. Criteria for high and low FBG, FTG, and FTC interpretation in the baseline and process groups were determined by the cutoff values of the receiver operating characteristic (ROC) curves, whereas high and low FBG, FTG, and FTC interpretation in the change group was determined by comparing the sizes of the process and baseline groups (Fig. 2).Fig. 2. The overall and subgroup ROC curves: ROC curves of FBG, FTG, and FTC for the baseline and process groups in the overall analysis (with information on the cutoff value and AUCs) presented in Figs A and H, respectively; and ROC curves of FBG, FTG, and FTC for the baseline and process groups in the analysis of the ER-positive and ER-negative subgroups (with information on the cutoff value and AUCs) presented in Figs B, I, and C, and J, respectively.ROC curves of FBG, FTG, and FTC for baseline and process groups in PR-positive and PR-negative subgroup analyses (with information on cutoff values and AUCs) presented in Figs D, K, and E, and L, respectively; and ROC curves of FBG, FTG, and FTC for baseline and process groups in menopausal and non-menopausal subgroup analyses presented in Figs F, M, and G, and N, respectively (with information on information on cutoff values and AUCs)
Efficacy evaluation
Since pCR is widely used as an alternative prognostic indicator for EFS and OS [6–9], this study assessed the efficacy of combined NAC and dual-targeted therapy in terms of whether pCR (ypT0/isypN0) was achieved [22].
Statistical methodology
Wilcoxon's rank-sum test was used to analyze the changes in the levels of FBG, FTG and FTC after NAC combined with dual-targeted therapy (p < 0.05 indicated statistically significant differences). The ROC curves were plotted using the R language (R 4.3.1) to determine the FBG, FTG, and FTC cutoff values in the groups, showing a change from continuous to dichotomous variables. Univariate and multivariate logistic regression analyses were performed using SAS 9.4 to examine the FBG, FTG, and FTC association with the pCR in the different groups (p < 0.05 indicated statistically significant differences).
Results
NAT affects FBG, FTG, and FTC
Combining NAC with dual-targeted therapy increased the FBG levels in both the overall and subgroup analyses, yielding statistically significant differences [(5.07 ± 1.19) mmol/L vs. (5.19 ± 0.76) mmol/L, (5.01 ± 0.86) mmol/L vs. (5.15 ± 0.70) mmol/L, (5.14 ± 1.44) mmol/L vs. (5.23 ± 0.82) mmol/L, (5.22 ± 1.41) mmol/L vs. (5.34 ± 0.90) mmol/L, (4.91 ± 0.85) mmol/L vs. (5.02 ± 0.54) mmol/L, (4.91 ± 0.86) mmol/L vs. (5.07 ± 0.55) mmol/L, and (5.20 ± 1.38) mmol/L vs. (5.28 ± 0.89) mmol/L, all p < 0.05] (Table 1). Table 1. Comparison of differences between baseline and process groupsBaseline group(mean ± std)Process group(mean ± std)P-valueTotal(n = 125) FBG5.07 ± 1.195.19 ± 0.76** < 0.001** FTG1.59 ± 0.931.79 ± 0.85** < 0.001** FTC5.04 ± 0.905.00 ± 0.720.791ER + (n = 61) FBG5.01 ± 0.865.15 ± 0.700.020 FTG1.53 ± 0.981.74 ± 0.81** < 0.001** FTC4.94 ± 0.904.97 ± 0.680.370ER-(n = 64) FBG5.14 ± 1.445.23 ± 0.82** < 0.001** FTG1.64 ± 0.891.85 ± 0.89** < 0.001** FTC5.14 ± 0.905.03 ± 0.750.192Menopause(n = 66) FBG5.22 ± 1.415.34 ± 0.90** < 0.001** FTG1.80 ± 1.061.99 ± 0.950.002 FTC5.30 ± 0.885.06 ± 0.690.013****Non-menopause(n = 59) FBG4.91 ± 0.855.02 ± 0.540.013 FTG1.34 ± 0.701.58 ± 0.68** < 0.001** FTC4.76 ± 0.844.93 ± 0.750.010****PR + (n = 54) FBG4.91 ± 0.865.07 ± 0.550.003 FTG1.51 ± 1.021.67 ± 0.780.004 FTC4.960 ± 0.914.961 ± 0.630.640PR-(n = 71) FBG5.20 ± 1.385.28 ± 0.890.002 FTG1.64 ± 0.861.88 ± 0.90** < 0.001** FTC5.11 ± 0.895.03 ± 0.780.308Reference range: FBG (3.89–6.11 mmol/L), FTG (0.00–1.70 mmol/L), and FTC (0.00–5.20 mmol/L)
Combining NAC with dual-targeted therapy increased the FTG levels in both the overall and subgroup analyses, yielding statistically significant differences [(1.59 ± 0.93) mmol/L vs. (1.79 ± 0.85) mmol/L, (1.53 ± 0.98) mmol/L vs. (1.74 ± 0.81) mmol/L, (1.64 ± 0.89) mmol/L vs. (1.85 ± 0.89) mmol/L, (1.80 ± 1.06) mmol/L vs. (1.99 ± 0.95) mmol/L, (1.34 ± 0.70) mmol/L vs. (1.58 ± 0.68) mmol/L, (1.51 ± 1.02) mmol/L vs. (1.67 ± 0.78) mmol/L, and (1.64 ± 0.86) mmol/L vs. (1.88 ± 0.90) mmol/L, all p < 0.05] (Table 1).
Combining NAC combined with dual-targeted therapy reduced the FTC levels in the overall, menopausal, ER-negative, and PR-negative subgroups [(5.04 ± 0.90) mmol/L vs. (5.00 ± 0.72) mmol/L, (5.30 ± 0.88) mmol/L vs. (5.06 ± 0.69) mmol/L, (5.14 ± 0.90) mmol/L vs. (5.03 ± 0.75) mmol/L, and (5.11 ± 0.89) mmol/L vs. (5.03 ± 0.78)) mmol/L], and increased these levels in the non-menopausal, ER-positive, and PR-positive subgroups [(4.76 ± 0.84) mmol/L vs. (4.93 ± 0.75) mmol/L, (4.94 ± 0.90) mmol/L, ( 4.94 ± 0.90) mmol/L vs. (4.97 ± 0.68) mmol/L, and (4.960 ± 0.91) mmol/L vs. (4.961 ± 0.63) mmol/L]. The differences were only statistically significant between the menopausal and non-menopausal subgroups (p < 0.05) (Table 1) (Fig. 2).
The overall baseline characterization and analysis
This study included HER2-positive patients (N = 125) meeting the enrollment criteria. Univariate and multivariate statistical analyses showed that the overall sample pCR rate was approximately 60.00%, while no other independent influencing factors predicted pCR, except for the HER2 expression status (pCR: 35.00% vs. 64.76%, OR = 3.413, 95% CI: 1.253–9.299, P = 0.0164) (Table 2). Table 2. Analysis of patient characteristics on pCR (N = 125)Variablenon-pCRN(%)pCRN(%)Univariate analysisP-valueMultivariate analysis ^a^OR(95%CI)P-value**Total (N)*50(40.00)75(60.00)Age0.2210 ≤ 358(57.14)6(42.86) 35 < age ≤ 5531(41.33)44(58.67) > 5511(30.56)25(69.44)Menstrual status0.1090 Non-menopause28(47.46)31(52.54) Menopause22(33.33)44(66.67)Clinical stage0.1375 II stage26(34.67)49(65.33) III stage24(48.00)26(52.00)HR status****0.03490.1009 Negative17(29.82)40(70.18)Ref Positive33(48.53)35(51.47)0.528(0.246–1.133)HER2 expression state0.01640.0164 2 + /FISH + 13(65.00)7(35.00)Ref 3 + 37(35.24)68(64.76)3.413(1.253–9.299)****Neoadjuvant therapy0.4076 A/EC-THP21(44.68)26(55.32) TCbHP29(37.18)49(62.82)FBG_baseline^b^0.2924 Low34(43.59)44(56.41) High16(34.04)31(65.96)FTG_baseline^c^0.0968 Low43(43.88)55(56.12) High7(25.93)20(74.07)FTC_baseline^d^0.1191 Low13(54.17)11(45.83) High37(36.63)64(63.37)FBG_process^e^0.4652 Low22(36.67)38(63.33) High28(43.08)37(56.92)FTG_process^f^0.3644 Low16(34.78)30(65.22) High34(43.04)45(56.96)FTC_process^g^0.3980 Low39(38.24)63(61.76) High11(47.83)12(52.17)FBG_change0.8186 Low17(38.64)27(61.36) High33(40.74)48(59.26)FTG_change0.2248 Low11(31.43)24(68.57) High39(43.33)51(56.67)FTC_change0.5113 Low23(37.10)39(62.90) High27(42.86)36(57.14)Abbreviations: OR Odds ratio, CI Confidence interval, pCR pathologic complete response, non-pCR non-pathologic complete responseA/EC-THP: A/E Anthracycline, C Cyclophosphamide, T Paclitaxel drugs, H Trastuzumab, P Pertuzumab. TCbHP: * T Paclitaxel drugs, Cb Platinum drugs, H Trastuzumab, P Pertuzumab^a^Logistic regression was used for analysis. All statistical tests were two-sided. The OR was calculated using the non-pCR as a reference. Adjusted for HR status and HER2 expression state^b,c,d,e,f,g^ ROC curves refer to Fig. 2 [the best cutoff value for the baseline FBG value in the overall analysis conditions were 5.085 and 5.015, respectively, both of which had the same effect on the results, while 5.015 was ultimately selected as optimal]
The subgroup analysis based on the ER status
The ER-negative subgroup analysis showed that the FTG level in the process group (pCR: 80.39% vs. 46.15%, OR = 0.209, 95% CI: 0.057–0.760, P = 0.0175) was an independent influencing factor of pCR. The ER-positive subgroup analysis indicated that the PR expression status (pCR: 71.43% vs. 38.80%, OR = 0.248, 95% CI: 0.068–0.911, P = 0.0357) was an independent predictor of pCR (Table 3). Table 3. Analysis of the effect of the patient characteristics on pCR (ER-/ER +)VariableER-(n = 64)ER + (n = 61)non-pCRN(%)pCRN(%)Univariate analysisP-valueMultivariate analysis^a^non-pCRN(%)pCRN(%)Univariate analysisP-valueMultivariate analysis^b^OR(95%CI)P-valueOR(95%CI)P-valueTotal (N)17(26.52)47(73.48)33(54.10)28(45.90)Age0.28350.9986 ≤ 352(66.67)1(33.33)6(54.55)5(45.45) 35 < age ≤ 5510(27.78)26(72.22)21(53.85)18(46.15) > 555(20.00)20(80.00)6(54.55)5(45.45)Menstrual status0.06520.5933 Non-menopause9(40.91)13(59.09)19(51.35)18(48.65) Menopause8(19.05)34(80.95)14(58.33)10(41.67)Clinical stage****0.03270.10530.7677 II stage6(16.22)31(83.78)Ref20(52.63)18(47.37) III stage11(40.74)16(59.26)0.365(0.107–1.236)13(56.52)10(43.48)PR expression0.96900.0357****0.0357 Negative17(29.82)40(70.18)4(28.57)10(71.43)Ref Positive07(100.00)29(61.70)18(38.80)0.248**(0.068–0.911)HER2 expression state0.69440.0456**0.1308 2 + /FISH + 2(33.33)4(66.67)11(78.57)3(21.43)Ref 3 + 15(25.86)43(74.14)22(46.81)25(53.19)3.056(0.718–13.011)Neoadjuvant therapy0.20320.7841 A/EC-THP8(36.36)14(63.64)13(52.00)12(48.00) TCbHP9(21.43)33(78.57)20(55.56)16(44.44)FBG_baseline^c^0.08130.0733 Low11(21.57)40(78.43)26(61.90)16(38.10) High6(46.15)7(53.85)7(36.84)12(63.16)FTG_baseline^d^0.30600.1678 Low7(35.00)13(65.00)31(57.41)23(42.59) High10(22.73)34(77.27)2(28.57)5(71.43)FTC_baseline^e^0.16770.0719 Low14(31.82)30(68.18)20(46.51)23(53.49) High3(15.00)17(85.00)13(72.22)5(27.78)FBG_process^f^0.77730.5279 Low8(25.00)24(75.00)15(50.00)15(50.00) High9(28.13)23(71.88)18(58.06)13(41.94)FTG_process^g^**0.01750.01750.9748 Low10(19.61)41(80.39)Ref03(100.00) High7(53.85)6(46.15)0.209(0.057–0.760)**33(56.90)25(43.10)FTC_process^h^0.23089(75.00)3(25.00)0.1162 Low10(22.22)35(77.78)24(48.98)25(51.02) High7(36.84)12(63.16)FBG_change0.306010(41.67)14(58.33)0.1196 Low7(35.00)13(65.00)23(62.16)14(37.84) High10(22.73)34(77.27)FTG_change0.95220.6892 Low016(100.00)11(57.89)8(42.11) High17(35.42)31(64.58)22(52.38)20(47.62)FTC_change0.29770.4417 Low8(21.62)29(78.38)15(60.00)10(40.00) High9(33.33)18(66.67)18(50.00)18(50.00)Abbreviations: OR Odds ratio, CI Confidence interval, pCR pathologic complete response, non-pCR non-pathologic complete responseA/EC-THP: A/E Anthracycline, C Cyclophosphamide, T Paclitaxel drugs, H Ttrastuzumab, P Pertuzumab. TCbHP: T, Paclitaxel drugs, Cb Platinum drugs, H Trastuzumab, P Pertuzumab^a^Logistic regression was used for analysis. All statistical tests were two-sided. The OR was calculated using the non-pCR as a reference. Adjusted for the clinical stage, FTG_process^b^Logistic regression was used for analysis. All statistical tests were two-sided. The OR was calculated using the non-pCR as a reference. Adjusted for PR expression, HER2 expression state^c,d,e,f,g,h^ ROC curves refer to Fig. 2
The subgroup analysis based on the PR status
The PR-negative subgroup analysis showed that the clinical stage (pCR: 82.50% vs. 54.84%, OR = 0.234, 95% CI: 0.075–0.731, P = 0.0124) and triglyceride trend (pCR: 94.12% vs. 62.96%, OR = 0.095, 95% CI: 0.011–0.805, P = 0.0309) independently influenced pCR. No factors independently influencing pCR were present in the PR-positive subgroup (Table 4). Table 4. Analysis of the effect of patient characteristics on pCR (PR-/PR +)VariablePR-(n = 71)PR + (n = 54)non-pCRN(%)pCRN(%)Univariate analysisP-valueMultivariate analysis^a^non-pCRN(%)pCRN(%)Univariate analysisP-valueMultivariate analysisOR(95%CI)P-valueOR(95%CI)P-value**Total (N)21(29.58)50(70.42)29(53.70)25(46.30)Age0.42070.6256 ≤ 352(66.67)1(33.33)6(54.55)5(45.45) 35 < age ≤ 5512(28.57)30(71.43)19(57.58)14(42.42) > 557(26.92)19(73.08)4(40.00)6(60.00)Menstrual status0.48060.4752 Non-menopause9(34.62)17(65.38)19(57.58)14(42.42) Menopause12(26.67)33(73.33)10(47.62)11(52.38)Clinical stage0.01380.01240.9703 II stage7(17.50)33(82.50)Ref19(54.29)16(45.71) III stage14(45.16)17(54.84)0.234(0.075–0.731)10(52.63)9(47.37)ER expression0.92670.9609 Negative17(29.82)40(70.18)07(100.00) Positive4(28.57)10(71.43)29(61.70)18(38.30)HER2 expression0.37120.1558 2 + /FISH + 2(50.00)2(50.00)11(68.75)5(31.25) 3 + 19(28.36)48(71.64)18(47.37)20(52.63)Neoadjuvant therapy0.22540.6257 A/EC-THP9(39.13)14(60.87)12(50.00)12(50.00) TCbHP12(25.00)36(75.00)17(56.67)13(43.33)FBG_baseline^b^0.92950.9708 Low12(30.00)28(70.00)29(58.00)21(42.00) High9(29.03)22(70.97)04(100.00)FTG_baseline^c^0.17700.1904 Low2(14.29)12(85.71)26(57.78)19(42.22) High19(33.33)38(66.67)3(33.33)6(66.67)FTC_baseline^d^0.28810.0502 Low3(18.75)13(81.25)9(81.82)2(18.18) High18(32.73)37(67.27)20(46.51)23(53.49)FBG_process^e^0.05770.2485 Low6(54.55)5(45.45)14(46.67)16(53.33) High15(25.00)45(75.00)15(62.50)9(37.50)FTG_process^f^0.01930.10070.9795 Low12(22.22)42(77.78)Ref02(100.00) High9(52.94)8(47.06)0.349(0.099–1.227)29(55.77)23(44.23)FTC_process^g^0.22440.0802 Low8(22.86)27(77.14)11(73.33)4(26.67) High13(36.11)23(63.89)18(46.15)21(53.85)FBG_change0.38370.2110 Low9(36.00)16(64.00)8(42.11)11(57.89) High12(26.09)34(73.91)21(60.00)14(40.00)FTG_change0.03590.03090.8473 Low1(5.88)16(94.12)Ref10(55.56)8(44.44) High20(37.04)34(62.96)0.095(0.011–0.805)**19(52.78)17(47.22)FTC_change0.77980.8460 Low11(28.21)28(71.79)12(52.17)11(47.83) High10(31.25)22(68.75)17(54.84)14(45.16)Abbreviations: OR Odds ratio, CI Confidence interval, pCR pathologic complete response, non-pCR non-pathologic complete responseA/EC-THP: A/E Anthracycline, C Cyclophosphamide, T Paclitaxel drugs, H Trastuzumab, P PertuzumabTCbHP: T Paclitaxel drugs, Cb platinum drugs, H Trastuzumab, P Pertuzumab^a^Logistic regression was used for analysis. All statistical tests were two-sided. The OR was calculated using the non-pCR as a reference. Adjusted for the clinical stage, FTG_process, FTG_change^b,c,d,e,f,g^ ROC curves refer to Fig. 2
The subgroup analysis based on the menstrual status
The menopausal subgroup analysis showed that the clinical stage (pCR: 73.33% vs. 52.38%, OR = 0.152, 95% CI: 0.041–0.559, P = 0.0046), HR expression status (pCR: 77.78% vs. 53.33%, OR = 0.179, 95% CI: 0.047–0.675, P = 0.0111), and NAT regimen (pCR: 47.62% vs. 75.56%, OR = 4.233, 95%CI: 1.193–15.017, P = 0.0255) independently influenced pCR. No independent pCR predictors were present in the non-menopausal subgroup (Table 5). Table 5. Analysis of the effect of the patient characteristics on pCR (Non-menopause/Menopause)VariableNon-menopause (n = 59)Menopause (n = 66)non-pCRN(%)pCRN(%)Univariate analysisP-valueMultivariate analysisnon-pCRN(%)pCRN(%)Univariate analysisP-valueMultivariate analysis^a^OR(95%CI)P-valueOR(95%CI)P-valueTotal (N)28(47.46)31(52.54)22(33.33)44(66.67)Age0.70130.4868 ≤ 358(57.14)6(42.86)00 35 < age ≤ 5519(44.1)24(55.81)12(37.50)20(62.50) > 551(50.00)1(50.00)10(29.41)24(70.59)Clinical stage0.59920.0065****0.0046 II stage19(50.00)19(50.00)12(26.67)33(73.33)Ref III stage9(42.86)12(57.14)10(47.62)11(52.38)0.152**(0.041–0.559)HR status0.59920.03920.0111** Negative9(42.86)12(57.14)8(22.22)28(77.78)Ref Positive19(50.00)19(50.00)14(46.67)16(53.33)0.179**(0.047–0.675)HER2 expression0.40100.01740.2347 2 + /FISH + 7(58.33)5(41.67)6(75.00)2(25.00)Ref 3 + 21(44.68)26(55.32)16(27.59)42(72.51)3.978(0.542–29.223)Neoadjuvant therapy0.22150.02830.0255** A/EC-THP10(38.46)16(61.54)11(52.38)10(47.62)Ref TCbHP18(54.55)15(45.45)11(24.44)34(75.56)4.233**(1.193–15.017)**FBG_baseline^b^0.59210.7900 Low9(52.94)8(47.06)3(37.50)5(62.50) High19(45.24)23(54.76)19(32.76)39(67.24)FTG_baseline^c^0.22830.5878 Low27(50.00)27(50.00)7(29.17)17(70.83) High1(20.00)4(80.00)15(35.71)27(64.29)FTC_baseline^d^0.69090.8155 Low13(44.83)16(55.17)4(36.36)7(63.64) High15(50.00)15(50.00)18(32.73)37(67.27)FBG_process^e^0.69620.5958 Low7(46.67)8(53.33)8(29.63)19(70.37) High21(47.73)23(52.27)14(35.90)25(64.10)FTG_process^f^0.94300.7218 Low16(47.06)18(52.94)8(30.77)18(69.23) High12(48.00)13(52.00)14(35.00)26(65.00)FTC_process^g^0.54660.6910 Low25(49.02)26(50.98)5(29.41)12(70.59) High3(37.50)5(62.50)17(34.69)32(65.31)FBG_change0.62491.0000 Low10(43.48)13(56.52)7(33.33)14(66.67) High18(50.00)18(50.00)15(33.33)30(66.67)FTG_change0.31750.5758 Low5(35.71)9(64.29)6(28.57)15(71.43) High23(51.11)22(48.89)16(35.56)29(64.44)FTC_change0.78590.8535 Low8(44.44)10(55.68)15(34.09)29(65.91) High20(48.78)21(51.22)7(31.82)15(68.18)Abbreviations: OR, Odds ratio, CI Confidence interval, pCR Pathologic complete response, non-pCR non-pathologic complete responseA/EC-THP: A/E Anthracycline, C Cyclophosphamide, T Paclitaxel drugs, H Trastuzumab, P PertuzumabTCbHP: T, paclitaxel drugs, Cb Platinum drugs, H Trastuzumab, P Pertuzumab^a^Logistic regression was used for analysis. All statistical tests were two-sided. The OR was calculated using the non-pCR as a reference. Adjusted for the clinical stage, HR status, HER2 expression, and neoadjuvant therapy^b,c,d,e,f,g^ ROC curves,refer to Fig. 2
Discussion
FBG
Both the overall and subgroup (Wilcoxon's rank-sum test) analyses showed that although combining NAC with dual-targeted therapy increased the FBG levels (all p < 0.05), the mean values of the elevated levels did not exceed the normal reference ranges (normal range of FBG in the hospital: 3.89–6.11 mmol/L). The factors responsible for increasing the mean blood glucose level may be related to chemotherapeutic drug toxicity and dexamethasone pretreatment. The platinum, paclitaxel, and cyclophosphamide used during the NAT in this study kill tumor cells and damage pancreatic islet β-cells, decreasing insulin secretion, abnormal glucose tolerance, and elevated blood glucose. In addition, since patients receiving glucose-lowering therapy were not excluded from this study, it was hypothesized that the effect of NAT on FBG might be even more significant. Therefore, BC patients receiving combined NAC and dual-targeted therapy should pay close attention to their blood glucose levels. Further association analyses of the overall and multiple subgroups showed no association between FBG and pCR (p > 0.05), indicating that NAT increased the FBG levels, while FBG could not predict pCR.
FTG and FTC
FTG
Both the overall and subgroup (Wilcoxon's rank-sum test) analyses showed that combined NAC and dual-targeted therapy increased the FTG levels (all p < 0.05). Except for the PR-positive and non-menopausal subgroups, the mean FTG level of the overall and other subgroups exceeded the reference range (normal range of FTG in our hospital: 0.00–1.70 mmol/L) after NAT. The logistic regression analyses indicated that low levels of FTG during NAT and decreased FTG after NAT predicted higher pCR rates in ER-negative/HER2-positive and PR-negative/HER2-positive patients, respectively (p < 0.05). In addition, since patients who received triglyceride-lowering therapy were not excluded from this study, the FTG levels of all patients exposed to combined NAC and dual-targeted therapy should be closely monitored. They should receive possible triglyceride-lowering therapy in a timely manner, especially ER-negative/HER2-positive and PR-negative/HER2-positive patients with BC, since their triglyceride-lowering therapy possibly enhances pCR.
FTC
The overall analysis (Wilcoxon's rank-sum test) showed that combined NAC and dual-targeted therapy decreased the FTC levels. In addition, although the FTC levels increased in the ER/PR-positive subgroups and decreased in the ER/PR-negative subgroups, the differences were not statistically significant (all p > 0.05). The subgroup analysis of the menstrual status showed that combined NAC and dual-targeted therapy decreased the FTC levels in the menopausal group while increasing those in the non-menopausal group (both p < 0.05) (normal range of FTC in the hospital: 0.00–5.20 mmol/L). Further, overall and multi-subgroup logistic regression analyses indicated that FTC did not independently influence pCR (p > 0.05). Therefore, although NAT elevated the FTC levels, FTC did not predict pCR.
Summaries
In terms of NAT affecting lipids, previous studies have shown that (neo)adjuvant therapy leads to elevated FTG and FTC levels in BC patients [23–27]. However, our results were only partially the same as previous studies, as we found that FTG was significantly elevated in both overall and subgroups (both p < 0.05), but FTC was significantly elevated only in the non-menopausal subgroup (p < 0.05) and decreased in the menopausal group (p < 0.05). The possible reasons for the differences were analyzed as differences in treatment regimens, molecular typing and enrollment criteria. In terms of lipid prediction of pCR, our study found that FTG in process and change groups could only predict pCR in some HER2-positive BCs. On the contrary, unlike our study, some studies [23] found no significant association between lipid levels and pCR rate in both baseline and process groups, which may be related to different group stratification methods and study backgrounds. Since, as far as is known, this is the first high-quality retrospective study on FTG and FTC based exclusively on combined NAC and dual-targeted therapy in the context of HER2-positive BC, there is a lack of reference to previous studies.
It should be noted that lipid is a general term for serum FTG, FTC, and lipoid, and FTG and FTC, as the most clinically relevant lipids, are not only associated with the development of CVD, but also with a multiple of developmental processes such as cell growth, proliferation, differentiation, apoptosis, motility, and metastasis in BC [28–31]. In HER2-positive breast cancer, fatty acid accumulation due to dyslipidemia also promotes drug resistance via acyl-CoAcholesterolacyltransferase and apolipoprotein E receptors [32]. In addition, CVD is an important cause of death after a diagnosis of BC, and women with BC have a higher risk of developing CVD than women in the general population [33, 34]. Therefore, controlling FTG and FTC at reasonable levels is crucial for BC patients treated with NAT.
Clinical and pathologic
In addition to biochemical indexes (FTG), this study indicated that the clinical stage, treatment regimen, and expression status of HER2 and HR (all p < 0.05) displayed good pCR predictive in some cases, which was consistent with previous studies.
Limitations
Since this was a single-center retrospective study, the case samples were small, and bias might be evident in case selection, possibly influencing the results. In addition, limited by the lack of high-density lipoprotein, low-density lipoprotein, and very-low-density lipoprotein information, further subgroup analysis could not be performed. Finally, this study was more concerned with describing the statistical differences and did not explore the molecular mechanisms underlying the association between biochemical indicators and pCR. Therefore, further multicenter prospective studies with high-quality, large samples and basic research are necessary.
Conclusions
Combined NAC and dual-targeted therapy increase the overall and subgroup FBG and FTG levels (p < 0.05), while the FTC was lower in the menopausal group and higher in the non-menopausal group (p < 0.05). In addition to the clinicopathologic features, the lower FTG level during and after treatment could be used as an independent influence to predict ER-negative and PR-negative pCR, respectively (p < 0.05). Overall and subgroup analyses showed that FBG and FTC did not predict pCR (p > 0.05). Early and timely intervention of FTG levels based on pathologic features may improve the pCR rate and reduce the likelihood of long-term CVD risk in HER2-positive BC treated via combined NAC and dual-target therapy.
The reference list from the paper itself. Each links out to its DOI / PubMed record.
- 1Sung H Ferlay J Siegel RL Global Cancer Statistics 2020: GLOBOCAN Estimates of Incidence and Mortality Worldwide for 36 Cancers in 185 Countries CA Cancer J Clin 202171320924910.3322/caac.2166033538338 · doi ↗ · pubmed ↗
- 2Loibl S Gianni LHER 2-positive breast cancer Lancet 2017389100872415242910.1016/S 0140-6736(16)32417-527939064 · doi ↗ · pubmed ↗
- 3Slamon DJ Godolphin W Jones LA Studies of the HER-2/neu proto-oncogene in human breast and ovarian cancer Science 1989244490570771210.1126/science.24701522470152 · doi ↗ · pubmed ↗
- 4Gradishar WJ Moran MS Abraham J Breast Cancer, Version 3.2022, NCCN Clinical Practice Guidelines in Oncology J Natl Compr Canc Netw 202220669172210.6004/jnccn.2022.003035714673 · doi ↗ · pubmed ↗
- 5Burstein HJ Curigliano G Thürlimann B Customizing local and systemic therapies for women with early breast cancer Guidelines for treatment of early breast cancer: the St. Gallen International Consensus 2021 Ann Oncol 2021321012163510.1016/j.annonc.2021.06.02334242744 PMC 9906308 · doi ↗ · pubmed ↗
- 6Spring L Greenup R Niemierko A Pathologic Complete Response After Neoadjuvant Chemotherapy and Long-Term Ou FT Comes Among Young Women With Breast Cancer J Natl Compr Canc Netw 201715101216122310.6004/jnccn.2017.015828982747 · doi ↗ · pubmed ↗
- 7Cortazar P Geyer CE Jrpathologic complete response in neoadjuvant treatment of breast cancer Ann Surg Oncol 20152251441144610.1245/s 10434-015-4404-825727556 · doi ↗ · pubmed ↗
- 8Spring LM Fell G Arfe A Pathologic Complete Response after Neoadjuvant Chemotherapy and Impact on Breast Cancer Recurrence and Survival: A Comprehensive Meta-analysis Clin Cancer Res 202026122838284810.1158/1078-0432.CCR-19-349232046998 PMC 7299787 · doi ↗ · pubmed ↗