Activity Diversity and Well-Being in Daily Life: Evidence for Heterogeneity Between Older Adults
Minxia Luo, Robert Glenn Moulder, Laura K Breitfelder, Christina Röcke

TL;DR
This study explores how daily activity variety relates to well-being in older adults, finding mixed results depending on individual health.
Contribution
The study reveals heterogeneity in how activity diversity affects well-being within older adults.
Findings
Daily activity diversity was not significantly linked to daily positive or negative affect overall.
Lower self-rated health was associated with lower daily positive affect when activity diversity was higher.
Results show divergent patterns in how activity diversity affects well-being across individuals.
Abstract
Although higher activity diversity is associated with higher well-being at the between-person level, it is unknown whether a day with higher activity diversity is related to higher well-being within persons. Within 24 hr per day, there are a limited number of activities on which individuals could spend their time and energy. Personal resources could influence the expenditure of energy and thus the experience with daily activities. This study examined daily associations between activity diversity and well-being and whether age and self-related health moderated the associations. For seven times per day over 2 weeks, 129 retired older adults (Mage = 73.9 years, SDage = 5.6) reported their present activity engagement and positive and negative affect. Daily activity diversity was operationalized as the number of different activity types reported per day. Daily positive and negative affect…
Genes, proteins, chemicals, diseases, species, mutations and cell lines named across the full text — each resolved to its canonical identifier and authoritative record.
Click any figure to enlarge with its caption.
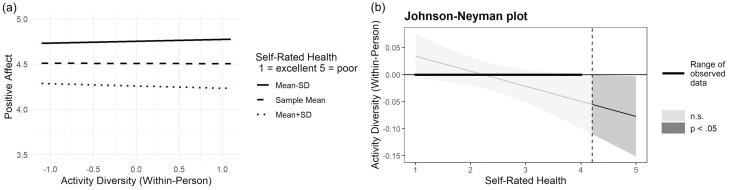 Figure 1
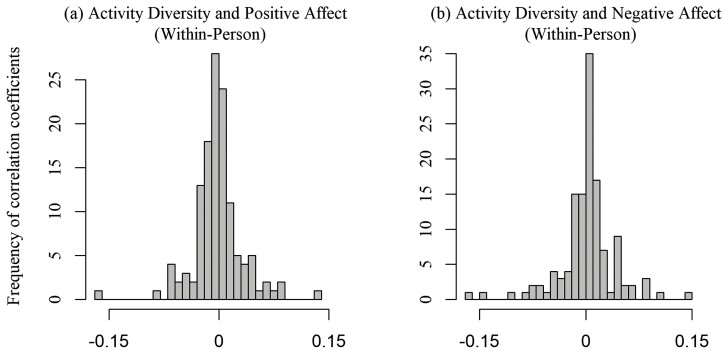 Figure 2
| Variables |
|
| Intraclass correlation coefficients |
|---|---|---|---|
| Activity diversity | 3.79 | 1.22 | 0.21 |
| Positive affect | 4.50 | 0.79 | 0.74 |
| Negative affect | 0.55 | 0.60 | 0.64 |
| Activity frequency | |||
| (1) Housework | 0.89 | 1.03 | 0.14 |
| (2) Cook/eat | 0.84 | 0.85 | 0.16 |
| (3) TV/music | 0.63 | 0.76 | 0.23 |
| (4) Education/intellectual | 0.77 | 0.97 | 0.23 |
| (5) Cultural/religious | 0.06 | 0.25 | 0.06 |
| (6) Hobbies | 0.13 | 0.46 | 0.20 |
| (7) Social | 0.51 | 0.82 | 0.12 |
| (8) Sports | 0.24 | 0.58 | 0.19 |
| (9) Walk | 0.14 | 0.40 | 0.12 |
| (10) Doctor/care | 0.11 | 0.35 | 0.07 |
| (11) Work/volunteer | 0.19 | 0.59 | 0.22 |
| (12) Rest | 0.38 | 0.65 | 0.14 |
| (13) Other | 0.53 | 0.87 | 0.14 |
| Parameters | Model 1 | Model 2 | Model 3 | Model 4 | ||||
|---|---|---|---|---|---|---|---|---|
|
|
|
|
|
|
|
|
| |
| Fixed effects | ||||||||
| Intercept |
| 0.06 |
| 0.09 |
| 0.05 |
| 0.07 |
| Diversity WP | 0.01 | 0.01 | −0.00 | 0.01 |
| 0.01 | 0.00 | 0.01 |
| Diversity BP | 0.14 | 0.09 | 0.10 | 0.09 | 0.01 | 0.07 | 0.04 | 0.06 |
| (1) Housework | 0.01 | 0.01 | − | 0.01 | ||||
| (2) Cook/eat | 0.01 | 0.01 | − | 0.01 | ||||
| (3) TV/music | 0.00 | 0.02 | − | 0.01 | ||||
| (4) Education/intellectual | 0.01 | 0.01 | − | 0.01 | ||||
| (5) Cultural/religious | 0.03 | 0.04 | −0.05 | 0.04 | ||||
| (6) Hobbies | 0.02 | 0.02 | −0.03 | 0.02 | ||||
| (7) Social |
| 0.01 | − | 0.01 | ||||
| (8) Sports |
| 0.02 | − | 0.02 | ||||
| (9) Walk |
| 0.03 | − | 0.02 | ||||
| (10) Doctor/care | −0.05 | 0.03 | 0.02 | 0.03 | ||||
| (11) Work/volunteer | −0.02 | 0.02 | − | 0.02 | ||||
| (12) Rest | − | 0.02 | 0.00 | 0.02 | ||||
| (13) Other | −0.01 | 0.01 | −0.01 | 0.01 | ||||
| Study day | −0.00 | 0.00 | −0.00 | 0.00 |
| 0.00 | − | 0.00 |
| Weekend (1 = yes) | 0.02 | 0.02 | −0.02 | 0.02 | ||||
| Sex (1 = men) |
| 0.13 | − | 0.09 | ||||
| Years of education | − | 0.02 | 0.00 | 0.01 | ||||
| Marital status (1 = married) | 0.12 | 0.12 | −0.06 | 0.09 | ||||
| Age | −0.01 | 0.01 | 0.01 | 0.01 | ||||
| Self-rated health | − | 0.07 |
| 0.05 | ||||
| Random effects | ||||||||
| Intercept VAR | 0.47 | 0.39 | 0.24 | 0.21 | ||||
| Slope (diversity WP) VAR | 0.00 | 0.00 | 0.00 | 0.00 | ||||
| Intercept-slope corr | 0.00 | −0.09 | −0.01 | 0.00 | ||||
| Residual VAR | 0.16 | 0.16 | 0.12 | 0.12 | ||||
| Marginal | 0.01/0.75 | 0.17/0.76 | 0.01/0.67 | 0.12/0.68 | ||||
| Parameters | Model 1 | Model 2 | Model 3 | Model 4 | ||||
|---|---|---|---|---|---|---|---|---|
|
|
|
|
|
|
|
|
| |
| Fixed effects | ||||||||
| Intercept |
| 0.10 |
| 0.07 |
| 0.09 |
| 0.07 |
| Diversity WP | −0.00 | 0.01 | 0.00 | 0.01 | −0.00 | 0.01 | 0.00 | 0.01 |
| Diversity BP | 0.11 | 0.10 | 0.04 | 0.07 | 0.07 | 0.10 | 0.06 | 0.07 |
| Age | −0.01 | 0.01 | 0.01 | 0.01 | ||||
| Diversity WP × age | 0.00 | 0.00 | −0.00 | 0.00 | ||||
| Diversity BP × age | 0.01 | 0.02 | −0.01 | 0.01 | ||||
| Health | − | 0.07 |
| 0.05 | ||||
| Diversity WP × health | − | 0.01 | 0.01 | 0.01 | ||||
| Diversity BP × health | 0.10 | 0.11 | −0.08 | 0.08 | ||||
| (1) Housework | 0.01 | 0.01 | − | 0.01 | 0.01 | 0.01 | − | 0.01 |
| (2) Cook/eat | 0.01 | 0.01 | − | 0.01 | 0.01 | 0.01 | − | 0.01 |
| (3) TV/music | 0.00 | 0.02 | − | 0.01 | 0.00 | 0.02 | − | 0.01 |
| (4) Education/intellectual | 0.01 | 0.01 | − | 0.01 | 0.01 | 0.01 | − | 0.01 |
| (5) Cultural/religious | 0.03 | 0.04 | −0.05 | 0.04 | 0.03 | 0.04 | −0.05 | 0.04 |
| (6) Hobbies | 0.02 | 0.02 | −0.03 | 0.02 | 0.02 | 0.02 | −0.03 | 0.02 |
| (7) Social |
| 0.01 | − | 0.01 |
| 0.01 | − | 0.01 |
| (8) Sports |
| 0.02 | − | 0.02 |
| 0.02 | − | 0.02 |
| (9) Walk |
| 0.03 | − | 0.02 |
| 0.03 | − | 0.02 |
| (10) Doctor/care | −0.05 | 0.03 | 0.02 | 0.03 | −0.05 | 0.03 | 0.02 | 0.03 |
| (11) Work/volunteer | −0.02 | 0.02 | − | 0.02 | −0.02 | 0.02 | − | 0.02 |
| (12) Rest | − | 0.02 | 0.00 | 0.02 | − | 0.02 | 0.00 | 0.02 |
| (13) Other | −0.01 | 0.01 | −0.01 | 0.01 | −0.01 | 0.01 | −0.01 | 0.01 |
| Study day | −0.00 | 0.00 | − | 0.00 | −0.00 | 0.00 | − | 0.00 |
| Weekend (1 = yes) | 0.02 | 0.02 | −0.02 | 0.02 | 0.02 | 0.02 | −0.02 | 0.02 |
| Sex (1 = men) |
| 0.14 | − | 0.10 |
| 0.12 | −0.17 | 0.09 |
| Years of education | −0.03 | 0.02 | 0.00 | 0.01 | − | 0.02 | −0.00 | 0.01 |
| Marital status (1 = married) | 0.17 | 0.13 | −0.07 | 0.09 | 0.15 | 0.12 | −0.10 | 0.09 |
| Random effects (VAR) | ||||||||
| Intercept VAR | 0.46 | 0.23 | 0.39 | 0.21 | ||||
| Slope (diversity WP) VAR | 0.00 | 0.00 | 0.00 | 0.00 | ||||
| Intercept-slope corr | 0.05 | 0.06 | −0.10 | −0.01 | ||||
| Residual VAR | 0.16 | 0.12 | 0.16 | 0.12 | ||||
| Marginal | 0.08/0.76 | 0.07/0.68 | 0.17/0.76 | 0.12/0.68 | ||||
- —Velux Stiftung10.13039/100007214
- —University of Zurich10.13039/501100006447
Peer Reviews
No public reviews on file for this paper yet. If you reviewed it on a platform where reviews are public (OpenReview, ICLR, NeurIPS, ICML), you can paste yours below so the community can read it here.
Videos
No videos yet. Explain this paper in a talk, walkthrough, or lecture? Add one.
Taxonomy
TopicsHealth disparities and outcomes · Retirement, Disability, and Employment · Psychological Well-being and Life Satisfaction
One of the continuous and important pursuits in gerontological research is to understand the role of activity engagement in daily life for healthy and successful aging (Horgas et al., 1998; Möwisch et al., 2022). Decades ago, the activity theory proposed that staying active and engaged within life and society is the key to older adults’ well-being (Havighurst, 1963). Activity diversity denotes the variety of activity types that people engage in during a particular time frame. It has been shown that activity diversity is associated with higher cognitive functioning (Brown et al., 2023), more agreeable personality states (Lindner et al., 2023), and lower likelihood to develop frailty (Takahashi et al., 2023) and depression (Lee, Yu, et al., 2018).
Does a lifestyle characterized by diversity also foster well-being, one of the key indicators of healthy aging (World Health Organization, 2015)? One study examined two-wave 10-year longitudinal population survey data and showed that, cross-sectionally, older adults with higher activity diversity indeed had higher eudaimonic well-being (e.g., purpose in life); and that, longitudinally, an increase in activity diversity was marginally associated with an increase in positive affect (Lee, Koffer, et al., 2018). Relatedly, higher perception of variety experienced in life is shown to be associated with higher quality of life of older adults at the between-person level (Jansen et al., 2023). Further, an experience sampling study showed that higher activity diversity was associated with more positive mood at a 3-hr time window within older adults (Fingerman et al., 2020). Thus, engagement in diverse activities might promote older adults’ well-being. Prior studies on activity diversity proposed that activity diversity may offer opportunities for social integration and thus benefit well-being (Lee, Koffer, et al., 2018; Lee, Urban-Wojcik, et al., 2022). Moreover, diverse activities might compensate for limited benefits of single activities for well-being (Joseph Sirgy & Wu, 2009; Luo, Macdonald, et al., 2022).
However, it remains unclear whether these associations would also hold for the within-person day-to-day level. Within 24 hr per day, there are a limited number of activities that individuals can spend their time and energy on. The selective optimization with compensation model proposes that older adults would select activities that are of high priority to their life goals and augment resources for these activities (Baltes & Carstensen, 1996). Similarly, the socioemotional selectivity theory predicts that emotional regulation through familiar social contacts becomes increasingly more important in older age—particularly for those with a limited future time perspective—and, thus, the desire of older adults to affiliate with familiar people increases (Carstensen, 1995). These theoretical propositions view older adults as self-regulatory agents who make their own decisions on daily activities and suggest that older adults are selective in choices on which they spend their time and energy. In turn, activity diversity, which might be at odds with an increase in being selective in overall and particularly social goals and activities, may not have a positive association with older adults’ well-being at the within-person level within a day.
Among older adults, those of more advanced age reduce their engagement in physical, social, and cognitive activities more than those of relatively younger age (Buchman et al., 2014; Finkel et al., 2018). Further, older adults with more functional limitations engage in fewer leisure activities (Janke et al., 2006) and have lower activity diversity (Lee, Ng, et al., 2022). Thus, older age and lower health status may encourage older adults to adapt their behaviors, being more selective in their daily activities and devoting more time on fewer rather than more diverse activities. These older adults, with lower resources and possibly lower expenditure of energy, might experience greater enjoyment and well-being when their days are less diverse.
The Current Study
This study had two research aims. First, we aimed to examine associations between daily activity diversity and daily well-being. We expected that activity diversity would be positively related to well-being at the between-person level and we explored the daily associations between activity diversity and well-being at the within-person level. Second, we aimed to examine whether age and health status moderated these associations. We expected that participants with older age and lower health status would show negative associations of activity diversity with emotional well-being.
This study conceptualized that activity diversity could give rise to well-being. Nevertheless, we acknowledge that positive and negative affect could also, in reverse, govern the choice of everyday activities (Sardina et al., 2022; Taquet et al., 2016). Activity engagement and affect could also have a bidirectional association (Ruissen et al., 2022). We examined data from a larger interdisciplinary study on mobility, activity, and social interactions of community-dwelling older adults from Switzerland (Röcke et al., 2023). We focus our examination on participants who were fully retired because they could have very different time use and experiences of leisure participation than older adults with work and family obligation (Freund, 2020).
Method
Participants
This study included 150 older adults living in Switzerland, recruited through the research institute’s participant database, snowballing method, and advertisements in local newspapers. Inclusion criteria were a minimum age of 65 years, sufficient vision to operate a smartphone, computer and internet access at home, and no cognitive impairment (Mini-Mental State Examination score ≥27). We retained the 129 (86%) participants who were retirees, excluding one participant working full time and 20 participants working part time (see Author Note 1). The sample (Mage = 73.9 years, SD = 5.6, range = 65–91) was exclusively Caucasian, consisted of 49% men and 56% married, and had an average of 13.87 years of education (*SD *= 3.45). On average, participants rated their own health as “very good” (M = 2.32 on a scale from 1 [“excellent”] to 5 [“poor”], SD = 0.82). In total, 127 (98%) participants were rated mildly or not impaired in the baseline assessment using the Short Physical Performance Battery (Guralnik et al., 1994). Participants received 200 Swiss francs as compensation for their participation in the entire study.
Procedure
The study was conducted according to the Declaration of Helsinki and approved by the Ethics Committee of the Faculty of Arts and Social Sciences of the University of Zurich (permission no. 17.2.4). Written informed consent was obtained from all individuals. Participants completed baseline questionnaires and 2-week smartphone-based ambulatory assessment. The latter included seven prompts per day to report their current activity and positive and negative effects on a smartphone that was provided for the study. The prompts were scheduled every 120 min with a random interval of plus or minus 0–15 min (i.e., each day around 8:30, 10:35, 12:40, 14:45, 16:50, 18:55, and 21:00). All prompts last around 5 min, with the last prompt in the evening lasting around 7 min as it included a longer questionnaire on the experience of the whole day. We examined a total of 1,994 days’ data (97%) out of 2,064 (129 participants × 16 days) possible days.
Measures
Activity diversity
Participants answered the question “[w]hat is your current activity?” by choosing one of 13 different types of activities (see Table 1). The activity types were selected based on prior studies of daily experiences (Fisher et al., 2012; Hultsch et al., 1999). Three members of the study team collected a longer list of possible activities and then collapsed and shortened this list to provide relevant activities in the target group and a list that seemed feasible for smartphone assessment without too much scrolling and the intended target group of older adults. Daily activity diversity was operationalized as the number of different activity types across all assessment points in a day (range = 1–7). Based on our previous research using the same data set (Luo et al., 2023), the count measure and Shannon’s (1948) entropy measure, which promise to take into account the evenness of frequency of each activity (Lee, Koffer, et al., 2018), were highly correlated (r = 0.98). We thus took a simpler approach and operationalized activity diversity by counting the number of different activity types.
Well-being
On a 7-point scale (0 = not at all to 6 = very strongly), participants rated their positive affect across five items: content, awake, relaxed, happy, and balanced. Positive affect was the average of the five items (omega_within_ = 0.85, omega_between_ = 0.98). Likewise, participants rated their negative affect over the following eight items: unwell, restless, without energy, nervous, worried, annoyed, sad, and angry (omega_within_ = 0.85, omega_between_ = 0.99), with responses being averaged over these items at each prompt. The items were drawn from the PANAS-X (Grühn et al., 2010; Watson et al., 1988) and the momentary version of the Multidimensional Mood Questionnaire (Wilhelm & Schoebi, 2007) to cover a broad range of positively and negatively valanced states that also differed in arousal. Daily positive affect and daily negative affect were computed as the respective average over the seven positive and negative affect ratings.
Age
Age was assessed as years since birth.
Self-rated health
Self-rated health was assessed with an item from the 12-Item Short-Form Health Survey: “[i]n general, would you say your health is…” (1 = excellent to 5 = poor; Ware et al., 1996).
Covariates
We controlled for covariates that are known to influence daily activity engagement and daily well-being, including sex (1 = men, 0 = women), education (years of education), marital status (1 = married/long term partnership, 0 = single/divorced/widowed), and weekend (1 = yes, 0 = no; Kim & Fingerman, 2022). We controlled for daily activity frequency of different activities to ensure that the effects of activity diversity did not come from potential overlap with high frequency of activity engagement (Okabe-Miyamoto et al., 2023). Daily activity frequency was the number of occurrences of each of the 13 activities reported per day. Table 1 shows the descriptive statistics of daily frequency of each activity. For example, across participants, “sports” was on average endorsed 0.24 times per day (SD = 0.58). We controlled for study day since the study began (range = 0–15) for potential time-related trends in well-being over the study period.
Statistical Analysis
We used multilevel models (Bolger & Laurenceau, 2013) to examine the two-level data, where days are nested within participants. We estimated daily well-being as a function of daily activity diversity, and separated the time-varying variable of daily activity diversity into between- and within-person variations. The between-person variation was the average value of each participant’s daily activity diversity, representing each participant’s typical activity diversity. The within-person variation was the raw daily activity diversity score minus the between-person variation (person-mean centered), representing the deviation of activity diversity of a given day from the person’s typical activity diversity. We controlled for study day.
Next, we added age (grand-mean centered), self-rated health (grand-mean centered), and the covariates, including the binary variables of sex, marital status, and weekend and years of education (grand-mean centered) and daily activity frequency of the 13 different activities (within-person variation). Consequently, the reference category of these models were the days, which were the first study days, weekday, and of participants’ own typical activity diversity and activity frequencies, and participants who were women, unmarried, had a sample average age, self-rated health, year of education, and activity diversity. We estimated the random intercept and random slope of the daily activity diversity (within-person variation). We did not estimate the random slopes of daily activity frequency (within-person variation) because the models with the 13 additional random slopes were too complex to converge.
Analyses were conducted in R Version 4.3.2 (R Core Team, 2013) using the “lme4” Version 1.1-35.1 (Bates et al., 2007) and “lmerTest” package Version 3.1-3 (Kuznetsova et al., 2017). We handled missing data with the default setting of the R “lme4” package: restricted maximum likelihood. Pseudo-R-squared indicating explained variance was calculated with the R “MuMIn” package version 1.47.5 (Barton & Barton, 2015). The Johnson-Neyman technique was used to examine the region of significance of the moderating effects (Preacher et al., 2006), the result of which was plotted with the R “interactions” package version 1.1.5 (Long & Long, 2019). Statistical significance was evaluated at p < .05.
Results
Table 1 shows the descriptive statistics of the time-varying daily variables. The intraclass correlation coefficients show that there was more variance across days within individuals in the activity variables, whereas there was more variance between individuals in the well-being variables. Bivariate between-person associations of the focal variables can be found in Supplementary Table S1.
As shown in Table 2, within persons, higher daily activity diversity on average was not associated with daily positive affect (Model 1, b = 0.01, SE = 0.01, p = .580), but was associated with lower daily negative affect (Model 3, b = −0.02, SE = 0.01, p = .033). However, the latter significant association became nonsignificant once the covariates were added to the model (Model 4, b = 0.002, SE = 0.01, p = .838). Additionally, activity diversity was not associated with positive and negative affect at the between-person level (Models 1–4).
As shown in Table 3, we found a significant moderating effect of self-rated health. Participants with lower self-rated health showed a negative within-person association between daily activity diversity and daily positive affect (Model 3, b = −0.03, SE = 0.01, p = .040). Yet, analysis with the Johnson-Neyman technique showed that the regions of significance of the moderating effect were either below −1.08 or above 4.45, which were outside the range of scores for the sample (Figure 1, panel B). More specifically, our participants rated from 1 (= excellent) to 4 (= fair) on the self-rated health scale (range = 1 to 5 [= poor]). In other words, the negative within-person association between daily activity diversity and daily positive affect could be observed in participants who rated their own health as “poor.” Additionally, this finding is seen in Figure 1, panel A, in which the lines representing within-person association between daily activity diversity and daily positive affect were almost horizontal and parallel across participants of different self-rated health levels.
Plots of moderating effect of self-rated health on within-person association between daily activity diversity and daily positive affect. n.s. = not significant; SD = standard deviation.
Discussion and Conclusion
With 2-week smartphone-based ambulatory assessment data from community-dwelling older adults, we examined associations between activity diversity and well-being of older adults. Different from our expectations and previous results in the literature, we did not find any association of daily activity diversity with daily positive or negative affect at the between- or within-person levels. Moderation analysis showed that participants with lower self-rated health experienced lower positive affect on a day when they had more diverse activities than usual. However, analysis with the Johnson-Neyman technique showed that the region of significance of the moderating effect was only significant in participants who rated their health as “poor” and was outside the observed data.
Referring to prior research that showed a positive between-person association of activity diversity with well-being (Lee, Koffer, et al., 2018), we expected a positive between-person association in our data. However, we did not find any significant relations indicting that interindividual differences in activity diversity were linked with differences in emotional well-being. Further, we examined the association at the within-person level to understand whether beyond person-level differences there were meaningful intraindividual covariations in daily life, and did not find any significant relations. To understand our pattern of not statistically significant results, we plotted Figure 2 to examine the degree of heterogeneity of within-person relations as indicated by the histograms of coefficients for each individual participant relating their daily positive and negative affect to daily activity diversity (based on Table 2, Models 2 and 4). This plot indicates divergent patterns in the within-person associations across participants. That is, activity diversity relates to higher well-being in the daily lives of some participants, but to lower well-being in others. Considering such divergent patterns explained, the finding of a nonsignificant overall sample average estimate of the within-person associations is plausible.
Histogram of person-specific coefficients of within-person associations between daily activity diversity and daily positive and negative affect. The histograms represent the coefficients for each participant relating their daily positive and negative affect to daily activity diversity at the within-person level. In panel (A), the correlation coefficients ranged from −0.17 to 0.13. In panel (B), the correlation coefficients ranged from −0.16 to 0.15.
Next, we examined whether age and self-rated health could explain some of the observed heterogeneity by introducing them as between-person moderators of the within-person associations between activity diversity and well-being. Referring to the selective optimization with compensation model (Baltes & Carstensen, 1996) and the socioemotional selectivity theory (Carstensen, 1995), we expected that older age and lower self-rated health may motivate more careful selection in daily activities and, thus, would lead to lower well-being in light of more diverse activities at both the within- and between-person levels. Results showed that self-rated health moderated the association of daily activity diversity and daily positive affect at the within-person level, but the moderating effect was not significant within the range of observed data. That is, older adults’ “poor” health ratings may express a lower availability of personal resources and lower energy levels, which prompt them to be selective in their pursuit of daily activities, leading to less pleasant experience on a day with more diverse activities. This finding is in line with recent research, which proposed that energy depletion and its recovery should be taken into account when understanding the full complexity of activity engagement in older age (Cardini & Freund, 2019; Luo, Pauly, et al., 2022). However, the scores of self-rated health in our study were better than “poor” and did not fall within the region of significance. Thus, we could not generalize the moderating effect to our study sample.
Markedly, we found a negative within-person association between daily activity diversity and daily negative affect at first, but the effects became nonsignificant once we controlled for the effects of the frequency of several activities. An intervention study to boost happiness showed that diverse positive activities were associated with higher well-being, but the association reversed when total activity frequency was taken into account (Okabe-Miyamoto et al., 2023). This finding speaks to the importance of considering activity frequency in the examination of activity diversity. We also noted that the prior study indicating a between-person association of activity diversity with well-being controlled for the total duration of activity participation (Lee, Koffer, et al., 2018). Said prior study calculated the total duration of all activities as one covariate, whereas our study calculated the frequency of different activities separately. Activity duration across all activities may have given more weight to the activities that occupied more time, but not necessarily reflected the respective effects of activities that were important for older adults’ well-being.
Additionally, our findings showed that higher frequency of social interactions (item 7), sports activities (item 8), and walking (item 9) were associated with higher positive affect (Table 2, Model 2), whereas higher frequency of the aforementioned activities and, additionally, housework/gardening/shopping (item 1), cooking/eating (item 2), watching television/listening to music (item 3), and education/mental stimulation (item 4) were associated with lower negative affect (Table 2, Model 4). The findings on sociocognitive (education/mental stimulation [item 4], social interactions [item 7]), and physical activities (sports activities [item 8], walking [item 9]) are in line with existing research on older adults’ activity engagement and well-being (Adams et al., 2011; Netz et al., 2005). These activities were also rated by midaged adults as meaningful activities, and their engagement was associated with greater positive affect (Hooker et al., 2020).
The findings on housework/gardening/shopping (item 1), cooking/eating (item 2), and watching television/listening to music (item 3) were inconsistent with prior research. Some research showed that television watching was related to lower positive affect and higher loneliness (Fingerman et al., 2022; Goodwin et al., 2005), although a paper showed that television watching was related to fewer stressors in life (Charles, Mogle, et al., 2021). It has been reported that household activities, including preparing meals and grocery shopping, were related to lower happiness (Oerlemans et al., 2011). We assumed that associations between activity frequency and well-being might also depend on social contexts, which we did not specifically consider in this article. For example, older adults have been found to spend more time watching television when they are alone than when they are with other people (Fingerman et al., 2022). This could be similar to other activities (e.g., cooking, shopping, and television watching) in such that the experience of an activity is altered by the presence of others.
We acknowledge several limitations in this study. First, although this study tried to capture activities that commonly occur in daily life, the choices offered for selection were still limited as a function of balancing our quest for information with participant burden in seven repeated assessments per day over 2 weeks. We also did not request participants to report their exact activity for the item of “other activities” (8% of the total observations). Future studies could consider adding more activities, such as grandparental childcare. Moreover, there could be variations across participants in how a particular activity was categorized. For example, visiting a cinema with a friend may be a social activity for some participants, but a cultural activity for others. There might also be other elements of activities that are important for older adults’ well-being and warrant future investigation, such as novelty (Chu et al., 2024), meaningfulness (Hooker et al., 2020), enjoyment, and importance (Jarosz, 2022).
Second, some of the activities had relatively lower frequency observed, such as doctor’s visits. This may influence the results of our findings on activity frequency. Relatedly, our design with the assessment at seven times per day may miss activities that occurred outside of these timepoints. Future research could use alternative (e.g., event-based or sensing) methods to continuously and possibly unobtrusively capture everyday activities over longer times (Hülür et al., 2023; Ng et al., 2021). Third, associations between activities and well-being could have been dependent on activity contexts, such as cooking alone versus eating with others. It is beyond the scope of this article to incorporate the contexts of activity (Charles, Röcke, et al., 2021), but future research could address the effects of contexts on the associations between activity diversity/frequency and well-being. Finally, we did not observe the hypothesized association between activity diversity and well-being and did not find the expected moderating effects of age and self-rated health at the between-person level. This might be due to the sample characteristics of the relatively active and high-functioning community-dwelling Swiss older adult participants. Future research would profit from more heterogeneous samples in terms of health status and social background.
To conclude, this study examined the associations between activity diversity and well-being on a day-to-day basis. Our findings suggest that rather than a uniform associative picture, there were quite divergent patterns in associations between daily activity diversity and daily well-being across individuals and, thus, not everybody experienced increased or decreased well-being on a day with diverse activities. Potentially, older adults with “poor” self-rated health may experience less positive affect on days with more diverse activities than usual, suggesting the experience of a suboptimal mapping between available resources and situational challenges. Yet, this proposition should be examined with further evidence. Taken together, our findings shed light on the discussion of how to optimize and regulate time spent in older age to maintain well-being (Horgas et al., 1998; Luo, Pauly, et al., 2022; Möwisch et al., 2022).
Supplementary Material
gbae025_suppl_Supplementary_Material
The reference list from the paper itself. Each links out to its DOI / PubMed record.
- 1Adams, K. B., Leibbrandt, S., & Moon, H. (2011). A critical review of the literature on social and leisure activity and wellbeing in later life. Ageing & Society, 31(4), 683–712. 10.1017/s 0144686 x 10001091 · doi ↗
- 2Baltes, M. M., & Carstensen, L. L. (1996). The process of successful ageing. Ageing & Society, 16(4), 397–422. 10.1017/s 0144686 x 00003603 · doi ↗
- 3Barton, K., & Barton, M. K. (2015). Package “mumin.”.Version, 1(18), 439. https://cran.hafro.is/web/packages/Mu M In/Mu M In.pdf
- 4Bates, D., Sarkar, D., Bates, M. D., & Matrix, L. (2007). The lme 4 package. R Package Version, 2(1), 74. https://cran.r-project.org/web/packages/lme 4/lme 4.pdf
- 5Bolger, N., & Laurenceau, J.-P. (2013). Intensive longitudinal methods: An introduction to diary and experience sampling research. Guilford Press.
- 6Brown, C. J., Jeon, S., Ng, Y. T., Lee, S., Fingerman, K. L., & Charles, S. T. (2023). Switching it up: Activity diversity and cognitive functioning in later life. Psychology and Aging, 38(6), 483–493. 10.1037/pag 000077037535516 PMC 10528947 · doi ↗ · pubmed ↗
- 7Buchman, A. S., Wilson, R. S., Yu, L., James, B. D., Boyle, P. A., & Bennett, D. A. (2014). Total daily activity declines more rapidly with increasing age in older adults. Archives of Gerontology and Geriatrics, 58(1), 74–79. 10.1016/j.archger.2013.08.00124007938 PMC 3889486 · doi ↗ · pubmed ↗
- 8Cardini, B. B., & Freund, A. M. (2019). When the fun is over. European Psychologist, 24(4), 322–336. 10.1027/1016-9040/a 000361 · doi ↗