Abnormal coagulation after hepatectomy in patients with normal preoperative coagulation function
Liting Kuang, Weibin Lin, Dahui Wang, Bin Chen

TL;DR
This study identifies risk factors for abnormal coagulation after liver surgery in patients with normal preoperative coagulation and builds a predictive model.
Contribution
A novel three-factor predictive model for postoperative coagulation abnormalities after hepatectomy is developed and validated.
Findings
PAC occurred in 54.8% of patients with normal preoperative coagulation after hepatectomy.
Preoperative INR, intraoperative succinyl gelatin infusion, and major hepatectomy were identified as independent risk factors for PAC.
A predictive model with an ROC of 0.742 in the training set and 0.711 in the validation set was successfully developed.
Abstract
To explore the risk factors for postoperative abnormal coagulation (PAC) and establish a predictive model for patients with normal preoperative coagulation function who underwent hepatectomy. A total of 661 patients with normal preoperative coagulation function who underwent hepatectomy between January 2015 and December 2021 at the First Affiliated Hospital of Sun Yat-sen University were divided into two groups: the postoperative abnormal coagulation group (PAC group, n = 362) and the normal coagulation group (non-PAC group, n = 299). Univariate and multivariate logistic analyses were used to identify the risk factors for PAC. The incidence of PAC in 661 patients who underwent hepatectomy was 54.8% (362/661). The least absolute shrinkage and selection operator (LASSO) method was used for multivariate logistic regression analysis. The preoperative international normalized ratio (INR),…
Genes, proteins, chemicals, diseases, species, mutations and cell lines named across the full text — each resolved to its canonical identifier and authoritative record.
Click any figure to enlarge with its caption.
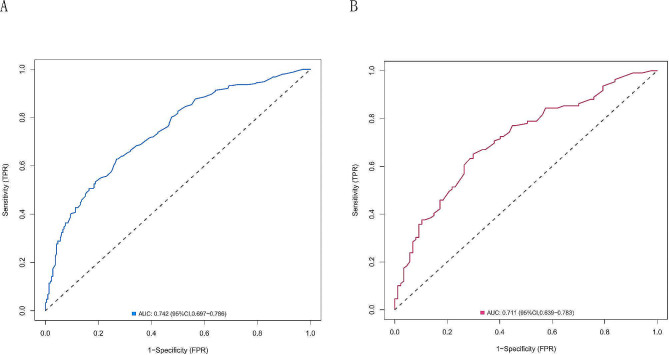 Figure 1
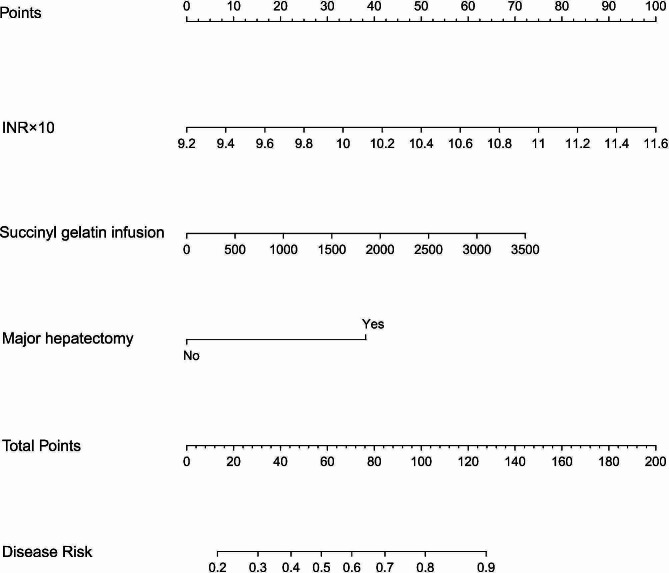 Figure 2
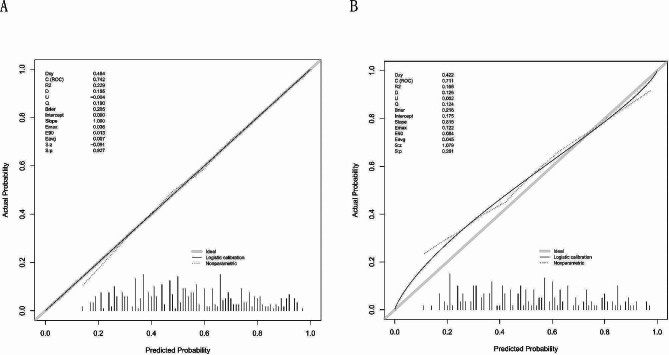 Figure 3
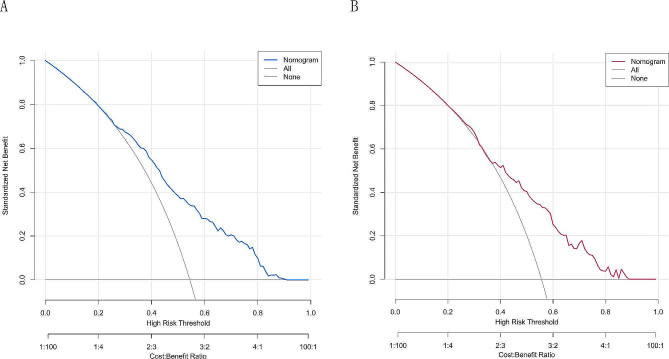 Figure 4
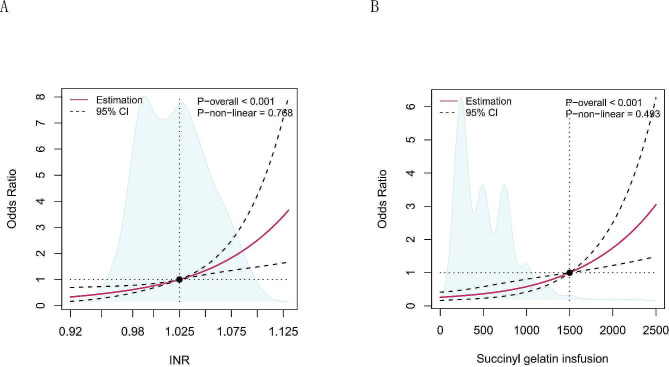 Figure 5
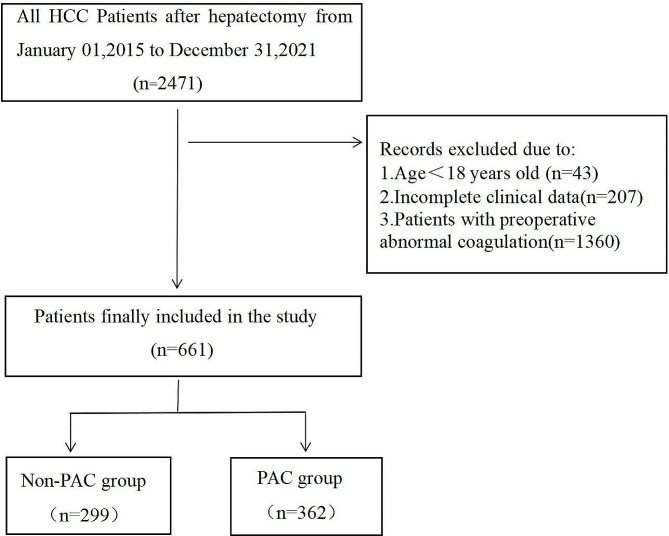 Figure 6
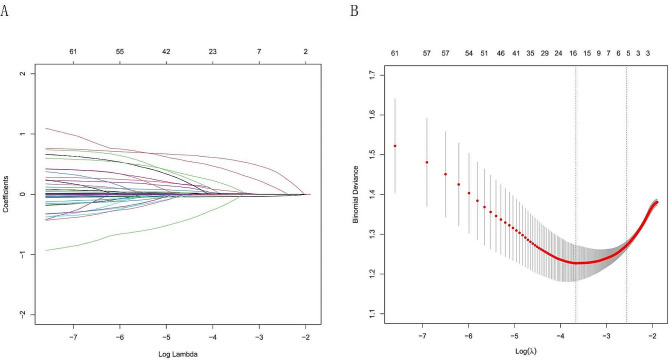 Figure 7
Peer Reviews
No public reviews on file for this paper yet. If you reviewed it on a platform where reviews are public (OpenReview, ICLR, NeurIPS, ICML), you can paste yours below so the community can read it here.
Videos
No videos yet. Explain this paper in a talk, walkthrough, or lecture? Add one.
Taxonomy
TopicsHepatocellular Carcinoma Treatment and Prognosis · Organ Transplantation Techniques and Outcomes · Surgical Simulation and Training
Introduction
Hepatocellular carcinoma is still one of the most common tumors in the world, and hepatectomy is the main treatment for hepatocellular carcinoma [1]. Bleeding and thromboembolism are major complications following hepatectomy; hence, early anticoagulation to avoid venous thromboembolism (VTE) is critical [2]. However, effective analgesia for abdominal surgery can hasten recovery. However, many investigators do not use epidural analgesia or early anticoagulation due to concerns about postoperative abnormal coagulation (PAC). If the risk of PAC can be detected and controlled, the use of epidural analgesia is safer, and anticoagulation can be initiated early postoperatively. Postoperative analgesia and anticoagulation will improve, as will perioperative complications. Many studies have identified preoperative cirrhosis, preoperative coagulation disorders, preoperative platelet levels, hepatectomy, and intraoperative bleeding as risk factors for PAC following hepatectomy [3–7]. Some studies have shown that the incidence of PAC after hepatectomy is relatively high, possibly due to a variety of factors, such as the patient’s preoperative liver dysfunction, the degree of intraoperative blood loss, the residual liver volume, and ischemia‒reperfusion injury [6, 8, 9]. Early PAC might increase postoperative bleeding, postoperative complications, or hospital stays in patients with other diseases [10, 11]. However, the PAC appears to be self-limiting in patients who undergo hepatectomy [2]. Moreover, no risk factor studies have been conducted in individuals with normal preoperative coagulation who underwent hepatectomy in China. The purpose of this retrospective study was to explore the risk factors for impaired coagulation function following hepatectomy for hepatocellular cancer in China.
Materials and methods
Patients and ethics
From January 2015 to December 2021, 661 patients who underwent hepatectomy for hepatocellular carcinoma at the First Affiliated Hospital of Sun Yat-sen University had normal preoperative coagulation function, and all enrolled patients had complete preoperative examination data and a coagulation function review within 48 h of surgery. The inclusion criteria were as follows: (1) aged ≥ 18 years, American Society of Anesthesiologists (ASA) I-III; and (2) had a normal preoperative peripheral blood coagulation function index. The exclusion criteria were patients who (1) had preoperative coagulation disorders, (2) had incomplete clinical data, or (3) consumed coagulation-altering medicines within one week prior to surgery. (4) Major cardiovascular illness, (5) aberrant renal function, (6) other cancers or metastasis to other organs, and (7) immune system disease. (8) Patients with a recent history of abnormal bleeding. (9) Allergy to plasma, gelatin, or starch. Our study complied with the relevant provisions of ethics and adhered to the Declaration of Helsinki, as described in the text below. The study was approved by the ethics committee of the First Affiliated Hospital of Sun Yat-sen University on May 30, 2023 (No. [2023]198). The data were completely anonymized to remove any identifying information, and the need for informed consent was waived. The study complied with all regulations. The flow chart of the study is shown in Fig. 1.
Fig. 1. Flow chart of the study
Definition of PAC
The definition of preoperative normal coagulation function must simultaneously meet the following conditions: 11 s ≤ prothrombin time (PT) ≤ 14 s, 80%≤PT%≤130%, 0.80 ≤ INR ≤ 1.15, 25 s ≤ activated partial thromboplastin time (APTT) ≤ 31.2 s, 14 s ≤ thrombin time (TT) ≤ 21 s, 1.8 g ≤ fibrinogen (FIB) ≤ 3.5 g, and platelet count ≥ 100 × 10^9^/L. Postoperative coagulation abnormalities were defined as the presence of any of the following disorders within 48 h after surgery [7]: an INR ≥ 1.4, a PLT < 80 × 10^9^/L, or an APTT > 38 s. The recruited patients were divided into two groups based on the above criteria: those with abnormal coagulation (PAC group, n = 362) and those with normal coagulation (non-PAC group, n = 299).
Data collection
We retrospectively reviewed the medical history, surgical records, anesthesia records, and examination tests of all patients who underwent hepatectomy for hepatocellular carcinoma at our institution from January 2015 to December 2021. Age, sex, body mass index (BMI), past medical history, preoperative imaging, laboratory tests, preoperative medications, intraoperative medications, intraoperative blood and fluid transfusions, surgical modality, duration of surgery, and intraoperative low central venous pressure time were all collected retrospectively from medical history, surgical records, anesthesia records, and examination tests.
Surgical procedures
Before surgery, the potential liver and tumor status were evaluated through enhanced computed tomography (CT), magnetic resonance imaging (MRI), or abdominal ultrasound. Patients with severe liver fibrosis or other organ dysfunction will have a residual liver volume of at least 40% in the future, and patients with normal liver function are allowed to have a residual liver volume of > 30%. In the process of hepatectomy, the Pringle maneuver was used to block blood flow into the liver when necessary. Major hepatectomy was defined as resection of at least three hepatic segments [3]. Intermittent clamping was performed as patterns of alternating clamping phase and reperfusion phase: 15-5-15-5.Under anesthesia, low central venous pressure method was applied to reduce liver volume perfusion and minimize blood loss.
Statistical analysis
All the statistical analyses were performed with Stata/SE 17.0 (College Station, TX77845, USA) and R version 4.2.2 software (https://www.r-project.org/). The normality of the distribution of the data was assessed using the Kolmogorov–Smirnov test. Continuous variables are reported as the mean ± standard deviation (SD) and were compared using Student’s independent t test. Nonnormally distributed data are reported as the median [interquartile range (IQR)] and were tested by a nonparametric test (Mann‒Whitney U test). Categorical variables are presented as numbers and percentages [n(%)] and were compared using the χ2 test or Fisher’s exact test (if an expected value ≤ 5 was found).
All datasets were randomly divided into training and validation cohorts at a 7:3 ratio, and homogeneity analysis was performed between the two cohorts. The least absolute shrinkage and selection operator (LASSO) method was used to reduce the number of candidate predictors. The penalty term was determined by 10-fold cross-validation, selecting the penalty that yielded the smallest mean square error. The optimal model, with the fewest variables, was identified based on λ = 1se as the criterion. These variables were subjected to multivariate analysis to calculate odds ratios (ORs) and P values. Factors with P < 0.05 in the multivariate analysis were included in the subsequent analysis. The variables that were significant in the multivariate logistic regression model were recognized as variables associated with PAC and were used in the final model.
A nomogram was also established by the final model through the “rms” package of R software. The predicted probabilities of the models were evaluated by the receiver operating characteristic (ROC) curve and area under the curve (AUC). Calibration plots (1000 bootstrap resamples) and the Hosmer‒Lemeshow goodness-of-fit test (HL test) were used to evaluate the accuracy of the prediction models, and P > 0.05 indicated that the model calibration degree was reliable. Decision curve analysis (DCA) was performed to assess the clinical usefulness of the rmda package in R. A two-tailed P < 0.05 was considered to indicate statistical significance. The research flowchart is shown in Fig. 1.
Results
Incidence of PAC
From January 2015 to December 2021, the incidence of PAC was 54.8% (362/661). PAC was detected in 160 patients with an INR ≥ 1.4, 124 patients with an APTT > 38 s, and 83 patients with a PLT < 80 × 10^9^/L.
Comparison of preoperative data and intraoperative conditions
Compared with those in the validation cohort, patients in the training cohort had no significant differences in preoperative indicators or intraoperative conditions (P > 0.05). There was good homogeneity between the training cohort and validation cohort in terms of patient demographic and clinical characteristics (Table 1 and 2).
Table 1. Comparison of preoperative baseline characteristics in training cohort and the validation cohortParametersAll (n = 661)Training cohort(n = 465)Validation cohort(n = 196) P
General characteristics PAC (%)0.766Yes362 (54.8)253 (54.4)109 (55.6)No299 (45.2)212 (45.6)87 (44.4)Age, y55.06 ± 11.3855.13 ± 11.4854.88 ± 11.160.800Gender, (%)0.599Male554 (83.8)392 (84.3)162 (82.7)Female107 (16.2)73 (15.7)34 (17.3)BMI,, Kg/m^2^23.16 ± 3.1922.84 ± 3.2022.96 ± 3.140.256ASA grade, (%)0.717129 (4.4)19 (4.1)10 (5.1)2505 (76.4)359 (77.2)146 (74.5)3127 (19.2)87 (18.7)40 (20.4)MELD score17.34 ± 1.8217.32 ± 1.7617.38 ± 1.950.686ALBI score-2.57 ± 0.31-2.57 ± 0.31-2.59 ± 0.300.430APRI score0.61 ± 0.610.60 ± 0.590.64 ± 0.660.465FIB-4 score2.22 ± 1.902.23 ± 2.092.19 ± 1.370.804Tumor diameter, cm6.06 ± 4.026.05 ± 4.296.08 ± 3.290.922 Preoperative complications HBV infection, n (%)0.099Yes515(77.9)368(79.1)147(75.0)No146(22.1)97(20.9)49(25.0)HP, n (%)0.899Yes103 (15.6)73 (15.7)30 (15.3)No558 (84.4)392 (84.3)166 (84.7)CAD, No. (%)0.384Yes18 (2.7)11 (2.4)7 (3.6)No643 (97.3)454 (97.6)189 (96.4)Diabetes, n (%)0.532Yes54 ( 8.2)40 (8.6)14 (7.1)No607 (91.8)425 (91.4)182 (92.9)HL, n (%)0.655Yes59 (8.9)43 (9.2)16 (8.2)No602 (91.1)422 (90.8)180 (91.8)COPD, No. (%)0.484Yes18 (2.7)14 (3.0)4 (2.0)No643 (97.3)451 (97.0)192 (98.0)Liver cirrhosis, n (%)0.656Yes181 (27.4)125 (26.9)56 (28.6)No480 (72.6)340 (73.1)140 (71.4) Laboratory measurements Hb, g/L141.25 ± 17.75141.04 ± 17.74141.76 ± 17.800.634PLT,×10^9^/L189.67 ± 58.97189.98 ± 59.92188.72 ± 56.800.803ALB, g/L39.34 ± 3.6739.23 ± 3.6239.60 ± 3.770.245TBIL,µmol/L16.92 ± 15.0016.64 ± 14.9717.56 ± 15.070.245UREA,µmol/L4.99 ± 1.665.04 ± 1.794.87 ± 1.310.225CREA,µmol/L78.55 ± 33.2979.58 ± 38.5276.13 ± 14.590.224ALT, U/L30.0 (20.0, 44.0)30.0(19.0,46.3)30.0(20.0,44.0)0.573AST, U/L32.0 (24.0, 45.0)34.0(25.0,48.0)32.0(24.0,44.0)0.349GGT, U/L54.0 (32.0, 105.0)56.0(34.0,108.5)54.0(31.0,104.0)0.528LDH, U/L200.0 (172.0, 233.0)199.0(172.0,236.3)200.0(172.0,231.0)0.848ALP, U/L82.0 (69.0, 104.0)83.5(70.0,105.8)80.0(68.0,103.0)0.176CHE, U/L6711 ± 15526738 ± 16466648 ± 13060.496PT, s11.89 ± 0.5511.89 ± 0.5411.87 ± 0.580.633PT%93.46 ± 8.0993.30 ± 7.8693.82 ± 8.630.452INR1.02 ± 0.051.02 ± 0.051.01 ± 0.050.152APTT, s28.01 ± 1.8627.95 ± 1.7428.15 ± 2.120.218TT, s18.44 ± 1.1718.46 ± 1.1918.42 ± 1.140.706FIB, g/L2.65 ± 1.172.67 ± 0.472.60 ± 0.460.093 Preoperative medication ACEI/ARB, n (%)0.600Yes13 (2.0)10 (2.2)3 (1.5)No648 (98.0)455 (97.8)193 (98.5)CCB, n (%)0.627Yes77 (11.6)56 (12.0)21 (10.7)No584 (88.4)409 (88.0)175 (89.3)Preoperative Nsaids, n(%)0.272Yes17 (2.6)14 (3.0)3 (1.5)No644 (97.4)451 (97.0)193 (98.5)Statin (%)0.328Yes9 (1.4)5 (1.1)4 (2.0)No652 (98.6)460 (98.9)192 (98.0)Diuretics, n (%)192 (98.0)454 (97.6)0.798Yes15 (2.3)4 (2.0)11 (2.4)No646 (97.7)1354 (95.6)581 (96.2)Hormones, n (%)0.109Yes7 (1.1)3 (0.6)4 (2.0)No654 (98.9)462 (99.4)192 (98.0)Abbreviations: ACEI/ARB: Angiotensin-converting enzyme inhibitor/Angiotensin II receptor blocker; ALB: Albumin; ALBI: albumin-bilirubin; ALP: Alkaline phosphatase; ALT: Alanine transaminase; APRI, AST to Platelet Ratio Index; APTT: Activated partial thromboplastin time; AST: Aspartate aminotransferase; BMI, Body mass index; CAD, coronary artery disease; CCB: Calcium channel blocker; CHE: Cholinesterase; COPD: chronic obstructive pulmonary diseases; CREA: Creatinine; FIB: Fibrinogen; FIB-4, fibrosis4; GGT: γ-glutamyl transpeptidase; HBV: Hepatitis B Virus; Hb: Hemoglobin; HL, Hyperlipidemia; HP, Hypertension; INR: International normalized ratio; LDH: Lactic Dehydrogenase; MELD: Model for end-stage liver disease; NSAIDs, non-steroidal anti-inflammatory drugs; PAC: Postoperative abnormal coagulation; PLT: Platelet; PT: Prothrombin time; PT%: Prothrombin activity; TBIL: Total bilirubin; TT: Thrombin time; UREA: Blood urea nitrogen
Table 2. Comparison of intraoperative conditions in training cohort and the validation cohortParametersAll (n = 661)Training cohort(n = 465)Validation cohort(n = 196) P
Surgical and anesthetic Factors Surgery time, minute240.27 ± 95.05241.85 ± 96.96236.52 ± 90.480.510Sevoflurane inhalation, No. (%)0.875Yes578 (87.4)406 (87.3)172 (87.8)No83 (12.6)59 (12.7)24 (12.2)Dexmedetomidine, No. (%)0.578Yes517 (78.2)361 (77.6)156 (79.6)No144 (21.8)104 (22.4)40 (20.4)Intraoperative NSAIDs, No. (%)0.581Yes377 (57.0)262 (56.3)115 (58.7)No284 (43.0)203 (43.7)81 (41.3)Dopamine, No. (%)0.568Yes120 (18.2)87 (18.7)33 (16.8)No541 (81.8)378 (81.3)163 (83.2)Norepinephrine, No. (%)0.805Yes278 (42.1)197 (42.4)81 (41.3)No383 (57.9)268 (57.6)115 (58.7)Major hepatectomy, n (%)0.428Yes193 (29.2)140 (30.1)53 (27.0)No468 (70.8)325 (69.9)143 (73.0)Low CVP time, min143.77 ± 138.84144.88 ± 104.07141.12 ± 198.660.751Minimum SBP, mmHg81.10 ± 9.8981.22 ± 10.3080.81 ± 8.870.620Minimum MAP, mmHg57.49 ± 7.3457.37 ± 7.3557.76 ± 7.330.534Epidural anesthesia, n (%)0.822Yes53 (8.0)38 (8.2)15 (7.7)No608 (92.0)427 (91.8)181 (92.3)Estimated blood loss, ml250 0.0(100.0, 600.0)200 0.0(100.0, 500.0)300 0.0(100.0, 600.0)0.312 Intra-operative insfusion Crystalloids infusion, ml2214.92 ± 847.982243.12 ± 850.842295.92 ± 808.600.460Hydroxyethyl starch infusion, ml0.0(0.0, 500.0)0 0.0(0.0, 500.0)0 0.0(0.0, 500.0)0.288Succinyl gelatin infusion, ml500.0(0.0, 1000.0)500.0(0.0, 1000.0)500.0(0.0, 1000.0)0.922Albumin, ml28.74 ± 58.8329.89 ± 60.9626.02 ± 53.460.440RBC, ml138.59 ± 433.75140.54 ± 414.47133.95 ± 477.480.859Plasma, ml80.26 ± 241.5783.98 ± 230.9771.43 ± 265.450.542Total infusion, ml3381.86 ± 1661.243377.10 ± 1681.173393.14 ± 1617.150.910Insfusion per hour per Kg, ml10.27 ± 3.9910.15 ± 4.0610.56 ± 3.810.236Abbreviations: MAP, mean artery pressure; RBC, red blood cell; SBP, systolic blood pressure
Risk factors for PAC and multivariable logistic regression analysis
To further remove the confounding factors in Tables 1 and 2, the variables of preoperative indicators and intraoperative conditions were subjected to LASSO regression analysis. Five risk factors, namely, the preoperative international normalized ratio (INR), estimated blood loss, major hepatectomy, succinyl gelatin infusion and red blood cell (RBC) infusion, were identified by using lambda.1 se = 0.0754 (Fig. 2A and B). By analyzing these five variables via multivariable logistic regression analysis, we found that preoperative INR (OR: 3.648; 95% CI: 2.378 to 5.710), major hepatectomy (OR: 2.117; 95% CI: 1.152 to 3.901), and succinyl gelatin infusion (OR: 1.0005; 95% CI: 1.0001 to 1.0009) were found to be independent risk factors for PAC (P < 0.05) (Table 3).
Fig. 2. Selection of PAC patient features using the LASSO logistic regression model. (A) A Lasso coefficient profile plot was built for the prediction of PAC. (B) The optimal parameter (λ) was selected by the LASSO model using 10-fold cross-validation via 1 standard error of the minimum criteria
Table 3. The univariate and multivariate logistic regression model of independent variables to PACParametersUnivariate logisticMultivariate logisticOR (95% CI) P OR (95% CI) P INR×103.249 (2.183,4.914)< 0.0013.648 (2.378,5.710)< 0.001Estimated blood loss1.0011 (1.0007,1.0016)< 0.0011.0005 (1.0001,1.0009)0.246Major hepatectomy3.588 (2.329,5.632)< 0.0012.117 (1.152,3.901)0.016Succinyl gelatin infusion1.0008(1.0007,1.0016)< 0.0011.0005 (1.0001,1.0009)0.025RBC infusion1.002(1.001,1.003)< 0.0011.001 (1.000,1.002)0.147
Construction of the nomogram column chart model
We used the three independent risk factors to construct a nomogram column chart model. Each patient can be scored based on the identified risk factors. The higher the total score is, the greater the possibility of PAC. This score enabled us to develop a preliminary prediction for the possibility of PAC (Fig. 3).
Fig. 3. The nomogram of factors associated with the final model for diagnosing intraoperative MBT, including preoperative INR, intraoperative succinyl gelatin infusion, and major hepatectomy. (To use the nomogram, an individual patient’s value is located on each variable axis, and a line is drawn upward to find the points received for each variable value. Then, the sum of these numbers is located on the total points axis, and a line is drawn downward to the risk of the PAC axes to determine the likelihood of PAC).
Internal validation of the ROC curve
ROC curves were constructed for the training cohort and validation cohort to evaluate the predictive models. The area under the curve (AUC) of the training cohort was 0.742 (95% CI: 0.697–0.786, P < 0.001), and the sensitivity, specificity, positive predictive value (PPV), negative predictive value (NPV) and Youden’s index were 0.628, 0.731, 0.736, 0.622 and 0.360, respectively (Fig. 4A). For the validation cohort, the AUC was 0.711 (95% CI: 0.639–0.783, P < 0.001), and the sensitivity, specificity, PPV, NPV and Youden’s index were 0.596, 0.736, 0.739, 0.593 and 0.332, respectively (Fig. 4B). There was no significant difference between the validation and training cohorts (P > 0.05).
Fig. 4. Receiver operating characteristic (ROC) curves of the model for predicting PAC. (A) ROC curve of the prediction model in the training cohort. (B) ROC curve of the prediction model in the validation cohort
Internal validation of the Hosmer‒Lemeshow (H-L) goodness-of-fit calibration test
For the training cohort, the C-index was 0.741 (χ2 = 12.792, P = 0.804) (Fig. 5A); for the validation cohort, the C-index was 0.710 (χ2 = 11.251, P = 0.883) (Fig. 5B). The calibration curve slopes for both the training cohort and the validation cohort were close to 1, indicating strong agreement between the model and the actual risk and a high predictive value.
Fig. 5. Calibration plots for the model in predicting PAC. (A) Calibration plot of the nomogram in the training cohort. (B) Calibration plot of the nomogram in the validation cohort
Decision curve analyses to assess clinical utility
The DCA of the nomogram model is presented in Fig. 6A and B. The DCA curves provided a favorable net benefit across a wide range, with a threshold probability across 30–90% and 40–90% for the training and validation cohorts, respectively.
Fig. 6. Decision curve analysis (DCA) comparing the net benefit of the model in predicting PAC. (A) DCA plot of the nomogram in the training cohort. (B) DCA plot of the nomogram in the validation cohort
Restricted cubic splines (RCSs) between preoperative INR, succinyl gelatin infusion and PAC
The RCS confirmed a linear association between the preoperative INR (P-overall < 0.001, *P-*nonlinear = 0.768; Fig. 7A), the incidence of succinyl gelatin infusion (P-overall < 0.001, *P-*nonlinear = 0.493; Fig. 7B) and the PAC. The reference points for the preoperative INR and amount of succinyl gelatin infusion were 1.025 and 1500 ml, respectively. There was a linear relationship between preoperative INR, succinyl gelatin infusion and PAC. The risk of PAC increased linearly when the preoperative INR was above 1.025 and the amount of succinyl gelatin infusion was above 1500 ml.
Fig. 7. Restricted cubic splines between preoperative INR (A), intraoperative succinyl gelatin infusion (B) and PAC. Solid red lines are multivariable adjusted odds ratios, with dashed bold lines showing 95% confidence intervals derived from restricted cubic spline regressions. The reference lines for no association are indicated by the black dashed lines at a hazard ratio of 1.0
Discussion
Even in individuals with normal preoperative coagulation, the frequency of postoperative abnormal coagulation was not low, according to our findings. Preoperative INR, intraoperative succinyl gelatin infusion and major hepatectomy were found to be independent risk factors for coagulopathy after hepatectomy. Patients with preexisting coagulation abnormalities combined with intraoperative bleeding and hepatectomy were indeed more likely to have postoperative coagulation abnormalities. However, in patients with normal preoperative coagulation, we found risk factors for abnormal postoperative coagulation.
Abnormal coagulation is prevalent following hepatectomy for hepatocellular carcinoma, and malfunction of liver parenchymal cells can lead to coagulation dysfunction, even in individuals who have fairly normal coagulation function before surgery. In our study, the incidence of abnormal coagulation after hepatectomy was 54.8%, which was greater than that in healthy living donors [12].
Although some studies did not include the INR, preoperative coagulation problems remain an important risk factor for posthepatectomy abnormal coagulation [6]. In Tina et al.’s study, the preoperative INRs without postoperative coagulation abnormalities and transient and persistent coagulation abnormalities were 1.05 ± 0.06, 1.10 ± 0.09, and 1.15 ± 0.08, respectively [7]. As shown, even small changes in the INR prior to surgery were significant risk factors. As a result, preparing products such as platelets, cold precipitates, and prothrombin complexes prior to hepatectomy may help with coagulation problems.
No difference between 40 and 70% hepatectomy was found when coagulopathy was evaluated in an animal study [13]. However, major hepatectomy has been a risk factor in different clinical studies. Decreased coagulation factor levels are strongly related to major hepatectomy [6, 14]. Major hepatectomies frequently result in excessive bleeding and necessitate intraoperative infusions of red blood cells and plasma. Red blood cell transfusions might result in inappropriate postoperative coagulation [15, 16]. This is consistent with our findings.
There is currently controversy over whether succinyl gelatin causes abnormal coagulation. Our study indicated that while succinyl gelatin also served as an intraoperative plasma substitute, it appeared to be more prone to coagulation disorders than the other components. When blood products are not yet available in the case of substantial intraoperative blood loss, the transfusion of albumin and artificial colloids (hydroxyethyl starch, succinyl gelatin, etc.) is frequently necessary. Although succinyl gelatin was formerly assumed to have no effect on clotting other than through dilution, there is now mounting evidence that succinyl gelatin does have an effect on platelet function and clotting. Thromboelastography and scanning electron microscopy were used to investigate in vitro coagulation in the presence of succinyl gelatin, where the weight and strength of the clots generated in the presence of succinyl gelatin were decreased and the usual reticular network of fibrin chains was lost. After succinyl gelatin administration, thrombin generation was reduced, presumably due to hemodilution [17, 18]. Kam et al. reported that hemodilution of more than 20% with succinyl gelatin impaired coagulation more strongly than that observed with NS hemodilution [19]. Palmaers et al. reported that gelatin significantly inhibited whole blood coagulation and platelet function in neurosurgical procedures [20]. Only succinyl gelatin was identified as a risk factor for abnormal coagulation following hepatectomy in our study, which may be related to the fact that succinyl gelatin infusion is frequently chosen over hydroxyethyl starch in situations of excessive bleeding.
Since the incidence of bleeding was lower in both groups than in other studies, heavy bleeding is a risk factor for abnormal postoperative coagulation. Thus, improved surgical techniques and reduced bleeding can help improve postoperative abnormal coagulation.
The findings of this study provide a clinical reference for predicting postoperative coagulation problems in hepatectomy patients with hepatocellular carcinoma, although there are significant limitations. First, this was a retrospective study in which data were obtained during hospitalization, and only changes in coagulation function within 48 h of surgery were noted, with no long-term follow-up or follow-up. Second, while arterial blood pressure is continuously monitored during most hepatectomies, it is only recorded at 5-minute intervals on electronic anesthesia sheets, so we cannot assess the duration of hypotension in each patient or pinpoint the precise stage at which blood pressure is at its lowest. Third, this study concentrated on preoperative and intraoperative risk factors for coagulation disorders, with little emphasis on postoperative risk variables. Fourth, we did not determine how many patients with PAC needed to be treated. Fifth, the postoperative disease processes of PAC patients with different INRs were not compared.
Conclusion
Postoperative coagulation problems following hepatectomy are associated with a variety of preoperative and intraoperative risk factors, and more complete screening and monitoring are required to minimize the occurrence of postoperative abnormal coagulation and improve patient prognosis.
The reference list from the paper itself. Each links out to its DOI / PubMed record.
- 1Zhang J Yang X Fang J Cheng Q-C Ding H-R Sun Y-R Evolution of associating liver partition and portal vein ligation for staged hepatectomy from 2012 to 2021: a bibliometric analysis Rev Int J Surg 202210310664810.1016/j.ijsu.2022.10664835513249 · doi ↗ · pubmed ↗
- 2Elterman KG Xiong Z Coagulation profile changes and safety of epidural analgesia after hepatectomy: a retrospective study J Anesth 2015293677210.1007/s 00540-014-1933-425391365 · doi ↗ · pubmed ↗
- 3Yuan FS Ng SY Ho KY Lee SY Chung AY Poopalalingam R Abnormal coagulation profile after hepatic resection: the effect of chronic hepatic disease and implications for epidural analgesia J Clin Anesth 20122439840310.1016/j.jclinane.2011.11.00522626687 · doi ↗ · pubmed ↗
- 4Jacquenod P Wallon G Gazon M Darnis B Pradat P Virlogeux V Incidence and risk factors of Coagulation Profile Derangement after Liver surgery: implications for the Use of Epidural Analgesia—A Retrospective Cohort Study Anesth Analgesia 20181261142710.1213/ANE.000000000000245728922227 · doi ↗ · pubmed ↗
- 5Shontz R Karuparthy V Temple R Brennan TJ Prevalence and risk factors predisposing to coagulopathy in patients receiving epidural analgesia for hepatic surgery Reg Anesth Pain Med 2009343081110.1097/AAP.0b 013e 3181 ac 7d 0019574863 · doi ↗ · pubmed ↗
- 6Singh SA Vivekananthan P Sharma A Sharma S Bharathy KGS Retrospective analysis of post-operative coagulopathy after major hepatic resection at a tertiary care centre in Northern India Indian J Anaesth 2017615758010.4103/ija.IJA_734_1628794530 PMC 5530743 · doi ↗ · pubmed ↗
- 7Ramspoth T Roehl AB Macko S Heidenhain C Junge K Binnebösel M Risk factors for coagulopathy after liver resection J Clin Anesth 2014266546210.1016/j.jclinane.2014.08.00225468574 · doi ↗ · pubmed ↗
- 8Chung JJ Dolan MT Patetta MJ Des Laurier JT Boroda N Gonzalez MH Abnormal coagulation as a risk factor for postoperative complications after primary and revision total hip and total knee arthroplasty J Arthroplasty 2021363294910.1016/j.arth.2021.04.02433966941 · doi ↗ · pubmed ↗