Prevalence of Diabetes, Ketosis, and Ketoacidosis and Their Correlation With Mortality in Critical COVID-19 Patients: A Single-Center Retrospective Study
Mohamed F Hendi, Zeyad F Alrais, Fahimuddin Syed, Hesham M Elkholy, Hawra Alsayed, Muneeba Moin, Sara H Mukhtar

TL;DR
This study found that diabetes and ketosis are common in critically ill COVID-19 patients and are linked to higher mortality rates.
Contribution
The study identifies ketosis and uncontrolled hyperglycemia as significant risk factors for mortality in ICU COVID-19 patients.
Findings
79.05% of ICU patients had diabetes or prediabetes on admission.
Ketotic patients had a higher mortality rate (69.7%) compared to nonketotic patients (54.8%).
Uncontrolled hyperglycemia and elevated lab values like lactate and PCT were significant predictors of mortality.
Abstract
Aim We aimed to find out the prevalence of diabetes, ketosis, and ketoacidosis in coronavirus disease 2019 (COVID-19) critically ill patients and to explore the clinical impact of the development of ketosis and ketoacidosis on the outcome of COVID-19 critically ill patients and identify them as potential risk factors for these patients. Methods We collected data on COVID-19 patients admitted to the intensive care unit (ICU) retrospectively. The study population will be classified into two groups based on the presence of diabetes or ketosis. Results The study comprises data on 253 ICU patients admitted with COVID-19 pneumonia. Two hundred patients (79.05%) had diabetes or prediabetes on admission. Seventy-six patients (30%) presented with ketosis. Nine patients had progressed to diabetic ketoacidosis during their ICU stay. Concerning the outcome, among 150 patients who died (59.3%),…
Genes, proteins, chemicals, diseases, species, mutations and cell lines named across the full text — each resolved to its canonical identifier and authoritative record.
Click any figure to enlarge with its caption.
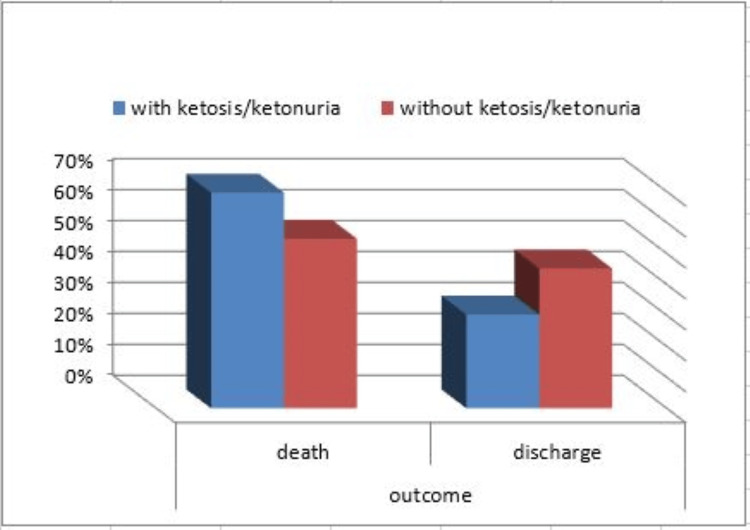 Figure 1
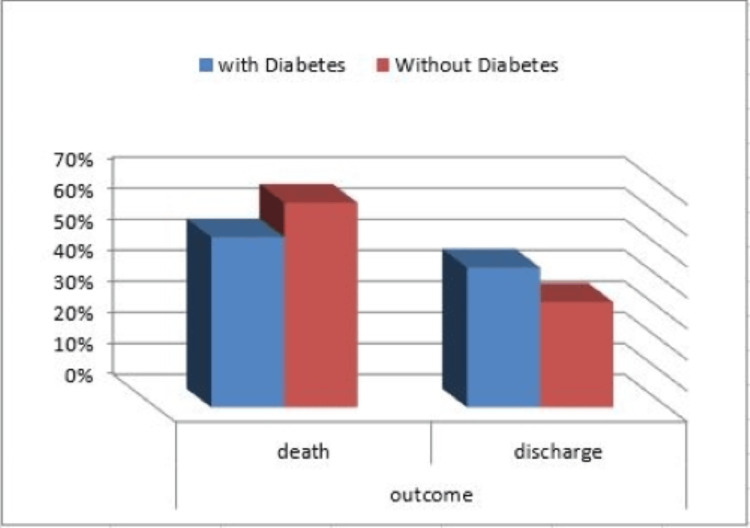 Figure 2
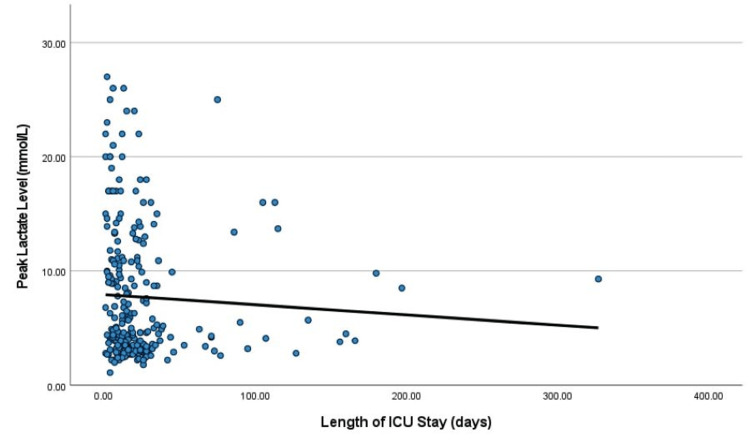 Figure 3
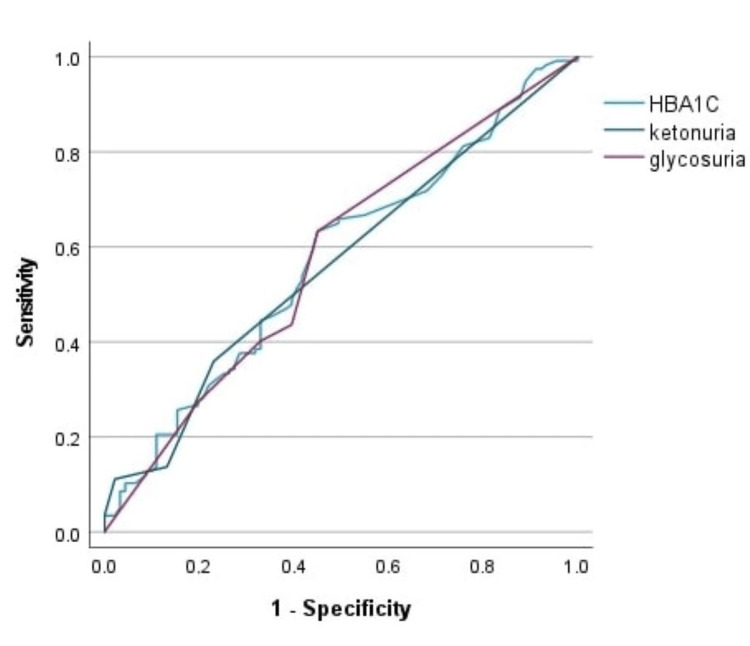 Figure 4
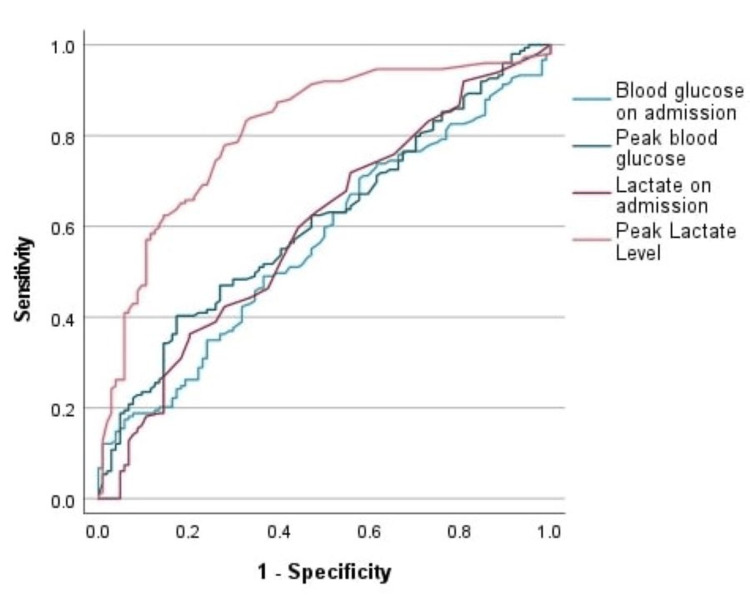 Figure 5
| Study Group Distribution | Count | % | |
| Sex | M | 198 | 78.3% |
| F | 55 | 21.7% | |
| Diabetic/prediabetic | yes | 153 | 60.5% |
| no | 100 | 39.5% | |
| Ketosis/ketonuria | yes | 76 | 30.0% |
| no | 177 | 70.0% | |
| Diabetic ketoacidosis | yes | 9 | 3.6% |
| no | 244 | 96.4% | |
| Other complications | Count | % | |
| ARDS | yes | 201 | 79.4% |
| no | 52 | 20.6% | |
| Septic shock | yes | 40 | 15.8% |
| no | 213 | 84.2% | |
| AKI | yes | 95 | 37.5% |
| no | 158 | 62.5% | |
| Pneumothorax | yes | 19 | 7.5% |
| no | 234 | 92.5% | |
| MI | yes | 8 | 3.2% |
| no | 245 | 96.8% | |
| Thrombotic disease | yes | 21 | 8.3% |
| no | 232 | 91.7% | |
| Bleeding | yes | 16 | 6.3% |
| no | 237 | 93.7% | |
| ICH | yes | 7 | 2.8% |
| no | 246 | 97.2% | |
| Variables | Diabetes | ||||||||||
| Yes | No | P-value | |||||||||
| Mean | SD | Median | Minimum | Maximum | Mean | SD | Median | Minimum | Maximum | ||
| Age | 55.27 | 12.76 | 54.00 | 24.00 | 92.00 | 48.25 | 15.24 | 46.00 | 22.00 | 89.00 | < 0.001 |
| Length of ICU stay | 25.22 | 33.59 | 15.00 | 1.00 | 197.00 | 24.54 | 39.14 | 16.00 | 1.00 | 327.00 | 0.985 |
| HBA1C | 8.54 | 2.47 | 7.70 | 5.30 | 18.30 | 6.73 | 2.22 | 6.10 | 4.60 | 17.70 | < 0.001 |
| Ketonuria | 0.59 | 0.97 | 0.00 | 0.00 | 4.00 | 0.32 | 0.80 | 0.00 | 0.00 | 4.00 | 0.010 |
| Glycosuria | 1.93 | 1.68 | 2.00 | 0.00 | 4.00 | 0.66 | 1.30 | 0.00 | 0.00 | 4.00 | < 0.001 |
| Blood glucose on admission | 231.73 | 110.49 | 203.00 | 52.00 | 600.00 | 176.81 | 117.97 | 152.00 | 65.00 | 1122.00 | < 0.001 |
| Peak blood glucose | 362.63 | 101.73 | 344.00 | 112.00 | 600.00 | 270.19 | 123.94 | 248.00 | 99.00 | 1122.00 | < 0.001 |
| PH on admission | 7.37 | 0.14 | 7.42 | 6.73 | 7.53 | 7.35 | 0.13 | 7.38 | 6.96 | 7.55 | 0.100 |
| PH peak | 7.15 | 0.15 | 7.18 | 6.69 | 7.41 | 7.12 | 0.18 | 7.14 | 6.71 | 7.48 | 0.196 |
| Lactate on admission | 2.60 | 3.09 | 1.80 | 0.60 | 26.00 | 2.58 | 2.42 | 1.80 | 0.60 | 16.00 | 0.536 |
| Lactate peak | 7.64 | 5.99 | 4.60 | 1.10 | 27.00 | 7.83 | 5.72 | 5.60 | 2.20 | 25.00 | 0.448 |
| Procalcitonin on admission | 5.40 | 26.34 | 0.39 | 0.04 | 269.56 | 1.72 | 4.82 | 0.41 | 0.03 | 33.19 | 0.480 |
| Procalcitonin peak | 16.48 | 33.66 | 3.48 | 0.10 | 269.56 | 28.33 | 66.25 | 4.66 | 0.21 | 352.00 | 0.301 |
| CRP on admission | 155.58 | 115.23 | 131.00 | 0.50 | 497.90 | 156.87 | 109.41 | 145.60 | 1.70 | 514.00 | 0.736 |
| CRP peak | 271.52 | 143.06 | 247.60 | 18.10 | 727.00 | 267.96 | 130.18 | 280.00 | 3.30 | 563.00 | 0.706 |
| WBC on admission | 9.72 | 4.84 | 8.20 | 2.50 | 26.40 | 11.49 | 6.05 | 10.40 | 2.80 | 39.00 | 0.006 |
| WBC peak | 25.10 | 10.96 | 23.90 | 6.90 | 60.30 | 27.31 | 12.44 | 23.40 | 7.70 | 69.70 | 0.241 |
| Ferritin on admission | 1602.77 | 3781.14 | 954.85 | 18.00 | 43678.00 | 1996.76 | 3077.49 | 1308.00 | 25.00 | 21890.00 | 0.015 |
| Ferritin peak | 6105.17 | 19244.35 | 1748.15 | 72.00 | 151800.00 | 4595.79 | 5765.40 | 2567.00 | 231.20 | 29891.00 | 0.002 |
| D dimer on admission | 4.17 | 5.86 | 1.51 | 0.20 | 20.00 | 4.60 | 5.87 | 1.98 | 0.24 | 20.00 | 0.123 |
| D dimer peak | 9.98 | 7.29 | 7.22 | 0.68 | 20.00 | 11.31 | 7.31 | 10.48 | 1.08 | 20.00 | 0.155 |
| LDH on admission | 453.45 | 213.43 | 399.00 | 173.00 | 1907.00 | 587.91 | 579.16 | 515.00 | 94.00 | 5732.00 | 0.003 |
| LDH peak | 720.71 | 982.55 | 605.00 | 173.00 | 11864.00 | 954.02 | 1424.50 | 687.00 | 141.00 | 12512.00 | 0.004 |
| Variables | Ketosis/ketonuria | ||||||||||
| Yes | No | P-value | |||||||||
| Mean | SD | Median | Minimum | Maximum | Mean | SD | Median | Minimum | Maximum | ||
| Age | 52.49 | 11.72 | 51.00 | 24.00 | 78.00 | 54.36 | 14.31 | 53.00 | 22.00 | 92.00 | 0.488 |
| Length of ICU stay | 23.26 | 23.80 | 16.00 | 1.00 | 115.00 | 25.67 | 39.92 | 14.00 | 1.00 | 327.00 | 0.335 |
| HBA1C | 8.98 | 2.97 | 8.45 | 4.60 | 18.30 | 7.54 | 2.16 | 6.80 | 4.80 | 15.70 | < 0.001 |
| Ketonuria | 1.53 | 1.04 | 1.00 | 0.00 | 4.00 | 0.00 | 0.00 | 0.00 | 0.00 | 0.00 | < 0.001 |
| Glycosuria | 2.36 | 1.74 | 3.00 | 0.00 | 4.00 | 1.01 | 1.44 | 0.00 | 0.00 | 4.00 | < 0.001 |
| Blood glucose on admission | 257.13 | 161.06 | 220.00 | 55.00 | 1122.00 | 189.79 | 83.56 | 169.00 | 52.00 | 473.00 | 0.001 |
| Peak blood glucose | 385.30 | 143.46 | 368.00 | 99.00 | 1122.00 | 300.67 | 97.88 | 290.00 | 112.00 | 600.00 | < 0.001 |
| PH on admission | 7.36 | 0.12 | 7.40 | 6.77 | 7.52 | 7.37 | 0.14 | 7.41 | 6.73 | 7.55 | 0.433 |
| PH peak | 7.14 | 0.16 | 7.18 | 6.74 | 7.37 | 7.13 | 0.17 | 7.16 | 6.69 | 7.48 | 0.664 |
| Lactate on admission | 2.27 | 2.22 | 1.70 | 0.90 | 17.00 | 2.73 | 3.06 | 1.80 | 0.60 | 26.00 | 0.321 |
| Lactate peak | 7.37 | 5.63 | 4.60 | 2.00 | 25.00 | 7.86 | 5.99 | 5.40 | 1.10 | 27.00 | 0.632 |
| Procalcitonin on admission | 7.72 | 33.21 | 0.45 | 0.06 | 269.56 | 2.33 | 11.76 | 0.37 | 0.03 | 120.84 | 0.090 |
| Procalcitonin peak | 22.17 | 41.61 | 4.31 | 0.26 | 269.56 | 20.69 | 52.41 | 3.58 | 0.10 | 352.00 | 0.114 |
| CRP on admission | 159.17 | 117.31 | 118.20 | 0.70 | 433.70 | 154.77 | 111.05 | 140.60 | 0.50 | 514.00 | 0.944 |
| CRP peak | 281.80 | 143.87 | 278.10 | 18.10 | 587.70 | 265.08 | 135.33 | 266.40 | 3.30 | 727.00 | 0.340 |
| WBC on admission | 10.81 | 5.09 | 9.80 | 2.50 | 26.40 | 10.25 | 5.54 | 8.60 | 2.80 | 39.00 | 0.182 |
| WBC peak | 26.42 | 11.07 | 24.30 | 8.90 | 69.70 | 25.78 | 11.84 | 23.40 | 6.90 | 65.90 | 0.448 |
| Ferritin on admission | 1870.80 | 2420.57 | 1385.65 | 55.60 | 15588.00 | 1711.94 | 3899.67 | 1040.45 | 18.00 | 43678.00 | 0.070 |
| Ferritin peak | 5743.89 | 9262.99 | 2310.00 | 72.00 | 54200.00 | 5400.61 | 17359.22 | 1957.50 | 72.70 | 151800.00 | 0.126 |
| D Dimer on admission | 4.60 | 5.86 | 1.86 | 0.20 | 20.00 | 4.22 | 5.87 | 1.70 | 0.24 | 20.00 | 0.460 |
| D Dimer peak | 11.28 | 7.24 | 12.19 | 1.29 | 20.00 | 10.17 | 7.33 | 8.10 | 0.68 | 20.00 | 0.321 |
| LDH on admission | 471.91 | 181.65 | 444.00 | 202.00 | 1294.00 | 523.09 | 472.96 | 443.00 | 94.00 | 5732.00 | 0.922 |
| LDH peak | 704.45 | 400.57 | 647.50 | 294.00 | 3258.00 | 862.19 | 1392.61 | 635.50 | 141.00 | 12512.00 | 0.821 |
| Group | Outcome | |||||
| Death | Discharge | P-value | ||||
| Count | % | Count | % | |||
| Diabetic/prediabetic | yes | 84 | 54.9% | 69 | 45.1% | 0.079 |
| no | 66 | 66.0% | 34 | 34.0% | ||
| Ketosis/ketonuria | yes | 53 | 69.7% | 23 | 30.3% | 0.027 |
| no | 97 | 54.8% | 80 | 45.2% | ||
| Laboratories | Outcome | ||||||||||
| Death (nonsurvivors) | Discharge (survivors) | P-value | |||||||||
| Mean | SD | Median | Minimum | Maximum | Mean | SD | Median | Minimum | Maximum | ||
| HBA1C | 8.28 | 2.73 | 7.30 | 4.60 | 18.30 | 7.63 | 2.20 | 6.70 | 4.80 | 14.30 | 0.090 |
| Ketonuria | 0.56 | 1.01 | 0.00 | 0.00 | 4.00 | 0.37 | 0.76 | 0.00 | 0.00 | 3.00 | 0.127 |
| Glycosuria | 1.54 | 1.68 | 1.00 | 0.00 | 4.00 | 1.28 | 1.63 | 0.00 | 0.00 | 4.00 | 0.121 |
| Blood glucose on admission | 223.72 | 134.21 | 185.50 | 52.00 | 1122.00 | 190.07 | 80.59 | 167.00 | 65.00 | 406.00 | 0.074 |
| Peak blood glucose | 345.33 | 129.66 | 328.00 | 137.00 | 1122.00 | 298.08 | 97.47 | 294.00 | 99.00 | 600.00 | 0.006 |
| PH on admission | 7.35 | 0.13 | 7.38 | 6.77 | 7.55 | 7.38 | 0.14 | 7.42 | 6.73 | 7.53 | 0.021 |
| PH peak | 7.09 | 0.16 | 7.12 | 6.71 | 7.35 | 7.20 | 0.14 | 7.24 | 6.69 | 7.48 | < 0.001 |
| Lactate on admission | 2.61 | 2.15 | 1.90 | 0.60 | 13.10 | 2.57 | 3.63 | 1.60 | 0.60 | 26.00 | 0.009 |
| Lactate peak | 9.82 | 6.20 | 8.80 | 1.10 | 27.00 | 4.65 | 3.60 | 3.40 | 2.20 | 26.00 | < 0.001 |
| Procalcitonin on admission | 3.89 | 23.45 | 0.42 | 0.04 | 269.56 | 4.03 | 16.17 | 0.37 | 0.03 | 120.84 | 0.125 |
| Procalcitonin peak | 26.62 | 60.02 | 5.68 | 0.10 | 352.00 | 13.19 | 25.56 | 2.88 | 0.11 | 139.08 | 0.043 |
| CRP on admission | 161.49 | 108.69 | 140.80 | 0.60 | 426.60 | 148.23 | 118.51 | 126.40 | 0.50 | 514.00 | 0.215 |
| CRP peak | 272.44 | 149.15 | 277.00 | 3.30 | 727.00 | 266.77 | 120.37 | 247.60 | 26.80 | 661.60 | 0.851 |
| WBC on admission | 10.79 | 5.89 | 9.75 | 2.70 | 39.00 | 9.87 | 4.59 | 8.30 | 2.50 | 22.00 | 0.293 |
| WBC peak | 27.99 | 12.42 | 26.40 | 6.90 | 69.70 | 23.05 | 9.61 | 21.20 | 7.70 | 65.90 | < 0.001 |
| Ferritin on admission | 2087.79 | 4130.03 | 1288.00 | 18.00 | 43678.00 | 1280.76 | 2286.46 | 954.85 | 20.80 | 21890.00 | 0.001 |
| Ferritin peak | 7838.26 | 19518.34 | 2626.50 | 72.00 | 151800.00 | 2095.68 | 2466.11 | 1681.50 | 94.00 | 21890.00 | < 0.001 |
| D dimer on admission | 5.02 | 6.30 | 1.98 | 0.40 | 20.00 | 3.37 | 5.05 | 1.50 | 0.20 | 20.00 | 0.031 |
| D dimer peak | 11.87 | 7.11 | 12.53 | 0.68 | 20.00 | 8.59 | 7.18 | 4.95 | 0.98 | 20.00 | < 0.001 |
| LDH on admission | 511.25 | 225.45 | 490.00 | 141.00 | 1572.00 | 501.59 | 579.22 | 406.50 | 94.00 | 5732.00 | 0.013 |
| LDH peak | 898.25 | 1454.87 | 648.00 | 141.00 | 12512.00 | 691.00 | 577.72 | 632.00 | 241.00 | 5732.00 | 0.165 |
| Laboratories | Length of ICU Stay | ||
| Correlation Coefficient | P-value | N | |
| HBA1C | -0.004 | 0.956 | 214 |
| Ketonuria | -0.004 | 0.956 | 242 |
| Glycosuria | -0.033 | 0.612 | 242 |
| Blood glucose on admission | -0.013 | 0.838 | 253 |
| Peak blood glucose | 0.035 | 0.582 | 253 |
| PH on admission | 0.118 | 0.060 | 253 |
| PH peak | -0.040 | 0.529 | 253 |
| Lactate on admission | -0.098 | 0.121 | 253 |
| Lactate peak | -0.154 | 0.014 | 253 |
| Procalcitonin on admission | -0.027 | 0.666 | 253 |
| Procalcitonin peak | 0.209 | 0.001 | 252 |
| CRP on admission | 0.049 | 0.438 | 253 |
| CRP peak | 0.315 | < 0.001 | 252 |
| WBC on admission | -0.088 | 0.162 | 253 |
| WBC peak | 0.263 | < 0.001 | 252 |
| Ferritin on admission | -0.028 | 0.657 | 246 |
| Ferritin peak | 0.086 | 0.177 | 246 |
| D dimer on admission | -0.038 | 0.556 | 248 |
| D dimer peak | 0.137 | 0.031 | 248 |
| LDH on admission | -0.001 | 0.993 | 247 |
| LDH peak | 0.135 | 0.033 | 248 |
| Mortality | Area under the curve | P-value | 95% Confidence interval | |
| Lower bound | Upper bound | |||
| HBA1C | 0.563 | 0.118 | 0.484 | 0.641 |
| Ketonuria | 0.560 | 0.136 | 0.481 | 0.638 |
| Glycosuria | 0.572 | 0.075 | 0.493 | 0.651 |
| Mortality | Area under the curve | P-value | 95% Confidence interval | Cutoff value | Sensitivity % | Specificity % | PPV % | NPV % | Accuracy % | |
| Lower bound | Upper bound | |||||||||
| Lactate on admission | 0.597 | 0.008 | 0.526 | 0.668 | 1.75 | 60 | 56.3 | 66.67 | 49.15 | 58.50 |
| Lactate peak | 0.805 | < 0.001 | 0.749 | 0.860 | 4.05 | 82.7 | 67 | 78.48 | 72.63 | 76.28 |
| Blood glucose on admission | 0.566 | 0.068 | 0.495 | 0.637 | ---- | ----- | ----- | ---- | ---- | ----- |
| Peak blood glucose | 0.602 | 0.004 | 0.532 | 0.672 | 322 | 51.3 | 63.1 | 66.96 | 47.10 | 56.13 |
| PH on admission | 0.585 | 0.018 | 0.514 | 0.656 | 7.4020 | 56.7 | 60.2 | 67.46 | 48.82 | 58.10 |
| PH peak | 0.721 | < 0.001 | 0.657 | 0.786 | 7.2105 | 78.7 | 62.1 | 75.16 | 66.67 | 71.94 |
| Procalcitonin on admission | 0.557 | 0.131 | 0.483 | 0.630 | ---- | ----- | ----- | ---- | ---- | ----- |
| CRP on admission | 0.546 | 0.218 | 0.473 | 0.619 | ---- | ----- | ----- | ---- | ---- | ----- |
| WBC on admission | 0.539 | 0.289 | 0.467 | 0.611 | ---- | ----- | ----- | ---- | ---- | ----- |
| Procalcitonin peak | 0.573 | 0.047 | 0.501 | 0.644 | 4.485 | 54.1 | 61.2 | 66.94 | 47.73 | 56.92 |
| CRP peak | 0.505 | 0.893 | 0.433 | 0.576 | ---- | ----- | ----- | ---- | ---- | ----- |
| WBC peak | 0.635 | < 0.001 | 0.566 | 0.704 | 24.05 | 60.1 | 67 | 72.58 | 53.49 | 62.85 |
| Ferritin on admission | 0.624 | 0.001 | 0.552 | 0.695 | 1297.5 | 50.7 | 65.7 | 68.47 | 47.89 | 56.92 |
| D dimer on admission | 0.588 | 0.018 | 0.515 | 0.661 | 1.61 | 59.9 | 57.6 | 67.16 | 49.58 | 58.89 |
| LDH | 0.592 | 0.015 | 0.518 | 0.666 | 456.5 | 54.9 | 60.6 | 66.67 | 47.69 | 56.92 |
| Ferritin peak | 0.691 | < 0.001 | 0.626 | 0.757 | 2598.5 | 52.1 | 79 | 78.00 | 52.94 | 62.85 |
| D dimer peak | 0.635 | < 0.001 | 0.564 | 0.707 | 7.935 | 64.8 | 62 | 71.32 | 54.70 | 63.64 |
| LDH peak | 0.556 | 0.131 | 0.483 | 0.629 | ---- | ----- | ----- | ---- | ---- | ----- |
Peer Reviews
No public reviews on file for this paper yet. If you reviewed it on a platform where reviews are public (OpenReview, ICLR, NeurIPS, ICML), you can paste yours below so the community can read it here.
Videos
No videos yet. Explain this paper in a talk, walkthrough, or lecture? Add one.
Taxonomy
TopicsDiabetes and associated disorders · COVID-19 Clinical Research Studies · Diet and metabolism studies
Introduction
During the coronavirus disease 2019 (COVID-19) outbreak in 2020, there was a huge increase in demand for critical ill services owing to the massive growth in the number of patients with severe illness during the pandemic.
Diabetes is a common comorbidity in COVID-19 patients due to its high prevalence worldwide and occurs in around 20-50% of patients, depending on the global region [1]. We wanted to review and analyze evidence on the relationship between COVID-19 and diabetes patients.
There is limited data on ketosis and ketoacidosis in critically ill COVID-19 patients. We report many cases of ketosis and diabetic ketoacidosis (DKA) precipitated by COVID-19 infection. Some COVID-19 patients present with ketosis, which may progress to DKA in those with diabetes.
Diabetes is a chronic inflammatory disorder marked by a variety of metabolic and vascular problems that can impair the ability to respond to infections. Serious acute metabolic complications, such as DKA, are often caused by infections and linked to uncontrolled blood glucose.
Previous viral pandemics have shown that diabetes is associated with higher rates of mortality and morbidity. Diabetes was identified as a major contributor to disease severity and mortality in the 2012 outbreak of Middle East Respiratory Syndrome Coronavirus (MERS-CoV) [1]. Similarly, the presence of diabetes tripled the risk of hospitalization and quadrupled the risk of intensive care unit (ICU) admission during Influenza A (H1N1) infection outbreak in 2009 [2]. Diabetes and uncontrolled glycemia have been reported as significant predictors of severity and deaths in patients infected with different previous pandemic viruses, including the pandemic influenza A (H1N1), MERS-CoV, and SARS-CoV-1 [3].
This study will focus on the prevalence of diabetes, ketosis, and ketoacidosis in critical adult patients with COVID-19 pneumonia who were admitted to the ICU and their correlation with ICU mortality to provide a better understanding of COVID-19 in diabetic patients.
Materials and methods
Population and study sample
We enrolled all adult critically ill patients who were diagnosed with COVID-19 pneumonia and admitted to the ICU of our hospital (Rashid Hospital) in Dubai during the COVID-19 pandemic from January 1, 2020, to June 30, 2021, in our study, which comprised 253 critically ill patients. During the pandemic, oral and nasal swabs were collected for SARS-CoV-2 PCR for any suspected cases of COVID-19 pneumonia.
We collected epidemiological and clinical data as well as data from laboratory investigations and outcomes from the Salama Electronic medical record system. We collected results of laboratories done on the day of ICU admission e.g. blood glucose, lactate, PH, PCT, CRP, WBC, D dimer, ferritin, and lactate dehydrogenase (LDH) and also results of the highest peak level of those laboratories during the whole ICU stay via retrospective collection of laboratories flowchart of our electronic hospital file system. We analyzed retrospectively collected data using Microsoft Excel 2016.
We classified the study population into two groups based on the presence of diabetes or ketosis. Ketosis is defined by a positive test result of urine or serum ketone (>0.6 mmol/l), whereas ketoacidosis is defined by a positive test result of urine or serum ketone (>0.6 mmol/l) with arterial pH < 7.35 and/or bicarbonate level < 18 mmol/L [4]. We statistically analyzed and expressed data as medians, percentages, and P-values to assess the differences between groups, such as ketosis against nonketosis and diabetes versus nondiabetes.
Statistical methods
We coded and entered data using IBM SPSS Statistics for Windows, Version 28 (Released 2021; IBM Corp., Armonk, New York, United States). For categorical data, we used frequency (count) and relative frequency (%) to summarize the data, whereas for quantitative data, we used mean, standard deviation, median, minimum, and maximum.
We used the Mann-Whitney and nonparametric Kruskal-Wallis tests to compare quantitative variables [5]. To compare categorical data, we used the Chi-square (c2) test. When the expected frequency was less than 5, we used the exact test instead [6].
We used the Spearman correlation coefficient [7] to determine correlations between quantitative variables. Spearman correlation coefficient (rho) (r) shows the strength and direction of the correlation. If rho is positive, then the direction of the correlation is positive, and if it is negative, then the direction of the correlation will be negative.
The strength of the correlation is determined by the amount of rho, irrespective of its sign. If the rho value < 0.3, there is a weak correlation. If the rho value is 0.3-0.49, there is a moderate correlation. If the rho value < 0.5, there is a strong correlation.
The receiver operating characteristic (ROC) curve will be calculated to assess the relation between many laboratories e.g. Blood glucose, lactate, PH, PCT, CRP, WBC, D dimer, ferritin, LDH, and mortality. To detect the best cutoff value for the detection of the outcome of significant parameters, we constructed the ROC curve and performed an analysis with the area under the curve (AUC).
P-values less than 0.05 were considered statistically significant. P-values less than 0.001 were considered highly statistically significant.
Results
The study was conducted on a total of 253 patients admitted to the ICU with COVID-19 pneumonia. The study population was classified into categories (diabetic or prediabetic versus nondiabetic and ketosis versus nonketosis) as shown in Table 1. The prevalence of complications associated with COVID-19 in our study is shown in Table 1.
Our patients had a median age of 53 (22-92) years; 198 patients were male (78.3%). Two hundred (79.05%) ICU patients had diabetes or prediabetic on admission, and they had a median age of 54 (24-92) years. Patients with diabetes were older (median age 54 vs. 46 years; P-value < 0.001).
In this study, seventy-six (30%) patients presented with ketosis. They had a median age of 51 (24-78) years. Nine of the ketosis group had progressed to diabetic ketoacidosis during ICU admission. Eight patients with diabetic ketoacidosis died.
We observed that there was no statistical difference in the duration of ICU stay between the diabetic and nondiabetic groups (median 15 (1-197) vs. 16 (1-327) days; P = 0.985), as shown in Table 2, and also between the ketosis and nonketosis groups (median 16 (1-115) vs. 14 (1-327) days; P = 0.335), as shown in Table 3.
Concerning the outcome of the 253 COVID-19 patients included in our study, 150 patients died (59.3%), and 103 patients were discharged from ICU (40.7%). According to the mortality outcome, patients were divided into survivors and nonsurvivors. Our data showed there was a significantly higher mortality among the ketotic patients (69.7%) compared to nonketotic patients (54.8%) with a P-value < 0.027, as shown in Table 4 and Figure 1. However, there was no significant mortality difference among the diabetic group (54.9%) compared to the nondiabetic group (66%) (Figure 2).
Mortality and discharge distribution among studied groups (ketosis and nonketosis)
Mortality and discharge distribution among studied groups (diabetic and nondiabetic)
We noted that peak blood glucose level was statistically significantly higher in nonsurvivors (mean 345 mg/dl) compared to survivors (mean 298 mg/dl) with a P-value of 0.006, while HBA1C and blood glucose on admission showed no statistical difference in ICU outcomes, as shown in Table 5.
Our data showed that peak serum levels of lactate, PCT, CRP, WBC, D dimer, and LDH during ICU stay strongly positively correlated to the length of ICU stay (Figure 3). However, there was no statistically significant positive correlation between laboratory results on admission e.g. blood glucose, lactate, PH, PCT, CRP, WBC, D dimer, ferritin, LDH, and the length of ICU stay, as shown in Table 6.
Correlation between the peak lactate level and length of ICU stay
The ketosis group had higher mortality during COVID-19 infection than nonketosis groups, as shown in Table 4. For more optimum results, we calculated the ROC curve to assess the relation between glycosuria, ketonuria, and HBA1C levels and mortality. We observed that there is no significant P-value to predict ICU mortality, as shown in Table 7 and Figure 4.
ROC curve for HBA1C, ketonuria, and glycosuria on admission as a prognostic marker in COVID-19 infections to predict ICU mortalityROC: Receiver operating characteristic; COVID-19: coronavirus disease 2019; ICU: intensive care unit
We calculated the ROC curve to assess the relationship between laboratory results and mortality. We noted that uncontrolled hyperglycemia during ICU admission (peak blood glucose) and other laboratory variables are significant predictors of mortality during ICU admission for patients with COVID-19, as shown in Table 8 and Figure 5).
ROC curve for PH, lactate, and blood glucose (peak, on admission) as a prognostic marker in COVID-19 infections to predict ICU mortalityROC: Receiver operating characteristic; COVID-19: coronavirus disease 2019; ICU: intensive care unit
Discussion
Diabetes is a chronic inflammatory condition characterized by multiple metabolic and vascular abnormalities that can affect the human response to pathogens [8]. Diabetes is one of the most important comorbidities associated with the severity of all three known human pathogenic coronavirus infections, including the 2009 pandemic influenza A (H1N1), MERS-CoV, and SARS-CoV [1]. During the 2012 outbreak of MERS-CoV, diabetes was prevalent in nearly 50% of the population [9]. Diabetes is a common comorbidity in SARS-CoV-2 (COVID-19) patients due to the high frequency of the disease worldwide [10]. Depending on the worldwide region, 20-50% of patients in the COVID-19 pandemic had diabetes [1].
We carried out this study on 253 critically ill patients admitted to ICU with COVID-19 pneumonia. We classified the study population into two groups based on the presence of diabetes or ketosis. Our study aimed to provide a better understanding of COVID-19 in diabetic patients and to focus on issues related to ketosis and ketoacidosis in critically ill adult patients with COVID-19 pneumonia and their correlation to ICU mortality.
Understandably, the prevalence of diabetes in patients with COVID-19 varies by age, region, and ethnicity [11]. Nearly 36% of COVID-19 patients had diabetes, according to an Italian study by Onder et al. (2020) [12]. A study from the United States by Bhatraju et al. (2020) reported that diabetes was associated with 58% of patients with COVID-19 [13]. We reported in our study that the prevalence of diabetes or prediabetes in ICU patients infected with the COVID-19 virus was 79.05% (200 patients out of 253 patients were diabetic or prediabetic). Wang et al. (2020) reported that out of 138 patients, 72% of COVID-19 patients with comorbidities including diabetes required admission to the ICU, compared to 37% of COVID-19 patients without comorbidities [14].
Diabetes and uncontrolled hyperglycemia have been reported as significant predictors of severity and mortality in patients infected with viruses, for example, the pandemic influenza A (H1N1) [15], MERS-CoV [16], and SARS-CoV [17]. Diabetes was considered an independent risk factor for complications and death during the 2002 to 2003 outbreak of severe acute respiratory syndrome (SARS-CoV-1) with mortality rates of 10% for SARS-CoV [1] and 36% in patients with MERS who had diabetes [18]. Similarly, the presence of diabetes tripled the risk of hospitalization and quadrupled the risk of ICU admission during Influenza A (H1N1) infection outbreak in 2009 [2].
Studies have also shown that COVID-19 is associated with hyperglycemia, particularly in elderly patients with type 2 diabetes [19]. Blood glucose control is important not only for patients who are infected with COVID-19 but also for those without the disease [20]. We noted in our study that peak blood glucose level was statistically significantly higher in nonsurvivors (mean 345 mg/dl) compared to survivors (mean 298 mg/dl) with a P-value of 0.006. However, HBA1C and blood glucose on admission showed no statistically significant change in mortality, which means that uncontrolled blood glucose during ICU admission plays a role in the final outcome for patients infected with COVID-19.
A correlation between the severity of the disease and diabetes was not clearly observed in some research conducted during the COVID-19 epidemic [21,22]. However, the evidence has remained controversial regarding whether diabetes itself increases susceptibility and influences outcomes from infections or whether the cardiovascular and renal comorbidities that are usually linked with diabetes are the key factors involved [8].
Diabetic patients with COVID-19 have been found to have a worse prognosis and higher mortality among hospitalized patients. A meta-analysis of nine studies from China (n = 1,936) showed a significant correlation between the severity of COVID-19 and diabetes (OR 2.67; 95% CI, 1.91-3.74; P < 0.01) [23]. However, a multivariate regression study revealed that the link between diabetes and mortality was no longer significant [20]. In the meta-analysis of nine trials (no 46,248) by Yang et al. (2020) [10], the odds ratio (OR) of severe COVID-19 was not significantly higher in diabetic patients (OR 2.07; 95% CI, 0.89-4.82).
Li et al. (2020), in a study of 658 hospitalized patients with confirmed COVID-19, reported that diabetes increased the length of hospital stay (median 33 vs. 17; P = 0.003) for patients with COVID-19 infection but had no effect on their mortality (33.3% vs. 14.8%; P = 0.313) [24]. Our study is similar to the study by Li et al. (2020) in that there was no significant difference regarding the mortality rate, (54.9% vs. 66%; P = 0.079) in diabetic patients versus non-diabetic patients admitted to the ICU in our study. Also, in our study, there was no significant difference regarding the length of ICU stay (median 15 vs. 16 days; P = 0.985) in diabetic patients versus non-diabetic patients because our study was concerned with ICU patients who were in critical illness regardless of their diabetic history, this explained why diabetes did not affect ICU mortality and length of ICU stay, while the study by Li et al. study was concerned with general hospitalized COVID-19 patients.
Our work found that there was no positive correlation between length of ICU stay and HBA1C (P =0.956), peak blood glucose level (P =0.582), and blood glucose on admission (P =0.838). Our results showed that diabetic history on admission and blood glucose on admission, will not affect the length of ICU stay and outcome but Peak blood glucose and other laboratory variables will correlate with mortality.
For more optimum results, we calculated the ROC curve to assess the relation between glycosuria, ketonuria, HBA1C, and blood glucose levels on ICU admission and mortality. We observed that there was no significant P value to predict ICU mortality, whereas peak blood glucose level has a prognostic value for ICU patients infected with COVID-19 (P value 0.004). The ROC curve in our study showed that uncontrolled hyperglycemia during ICU admission (peak blood glucose) and other laboratory variables (e.g., PCT (P = 0.047), and P < 0.001 of other laboratories e.g. Lactate, PH, WBC, D Dimer, Ferritin) are significant predictors of mortality in COVID-19 patients hospitalized in the ICU.
There are data regarding glucose metabolism in the body and the development of acute complications of diabetes, for example, diabetic ketoacidosis, in COVID-19 patients. Increased stress and production of hyperglycemic hormones, such as catecholamines and glucocorticoids, may be triggered by COVID-19 infection in diabetic patients, resulting in higher blood glucose levels and abnormal glucose variability [25].
Ketosis is defined by a positive test result of urine or serum ketone. Ketones are formed in the liver from free fatty acids [26]. When ketone consumption decreases, it results in ketosis (elevated blood ketone concentrations, e.g., acetone, acetoacetate, and β-hydroxybutyrate) [27].
Ketoacidosis, a severe metabolic illness marked by the accumulation of ketone bodies and acidosis, is most common in diabetics and rarely induced by other pathological conditions [28]. Ketoacidosis is defined by a positive test result of urine or serum ketone (above 0.6 mmol/L) and arterial PH < 7.35. DKA is a potentially fatal metabolic complication that is often caused by infections and linked to uncontrolled blood glucose. Seventy-six of the COVID-19 patients in our study were in ketosis, which suggests that COVID-19 may enhance the breakdown of fat and promote ketosis, leading to the development of ketoacidosis. DKA occurs as a result of insulin deficiency and increased counterregulatory responses that favor the production of ketones. It is possible that COVID-19 may aggravate pancreatic beta cell function and precipitate DKA [29].
We observed in our work that the ketosis group had a higher mortality rate (69.7% vs. 54.8%; P = 0.027) but no statistical difference in duration of ICU stay between ketosis and nonketosis groups (median 16 (1-115) vs. 14 (1-327) days; P < 0.335) and also between diabetic and nondiabetic groups (median 15 (1-197) vs. 16 (1-327) days; P < 0.985). In the current study, nine COVID-19 patients developed DKA; eight of them died. This suggests that COVID-19 infection could cause ketosis, or ketoacidosis, and induce DKA in those with diabetes. Ketosis increased ICU mortality but not the length of ICU stays.
Li et al. reported that 42 (6.4%) out of 658 patients presented with ketosis at hospital admission with COVID-19 [21]. Ketosis increased the mortality and length of hospital stay in their study. The ketosis group had a significantly higher mortality rate (21.4% vs. 8.9%; P = 0.017) like our study and also had a significantly longer hospital stay (median 19 (12.8-33.3) vs. 16 (10-24) days; P < 0.001). Our present study showed a longer ICU stay in the ketosis group admitted with COVID-19 (median 16 (1-115) vs. 14 (1-327) days; P < 0.335), but it was not significant due to different disease severity because most of our studied group were in critical illness with COVID-19 during ICU admission.
The study was limited because of the small number of patients with COVID-19 who progressed from ketosis to ketoacidosis. Notably, more research is needed to understand the mechanism of COVID-19-induced DKA. To lower the COVID-19-related mortality from complications, future research should focus on COVID-19 patients who have ketosis and ketoacidosis and monitor the disease’s long-term prognosis.
Conclusions
We reported that COVID-19 infection can cause ketosis and induce DKA in diabetic people. There is a high prevalence of diabetes and ketosis among critically ill COVID-19 patients admitted to the ICU. Ketosis is associated with an increased mortality risk. Uncontrolled hyperglycemia is a significant predictor of mortality in critically ill COVID-19 patients. It is critical to control blood glucose levels in COVID-19 patients admitted to the ICU.
The reference list from the paper itself. Each links out to its DOI / PubMed record.
- 1Practical recommendations for the management of diabetes in patients with COVID-19Lancet Diabetes Endocrinol Bornstein SR Rubino F Khunti K 546550820203233464610.1016/S 2213-8587(20)30152-2PMC 7180013 · doi ↗ · pubmed ↗
- 2Diabetes and the severity of pandemic influenza A (H 1N 1) infection Diabetes Care Allard R Leclerc P Tremblay C Tannenbaum TN 149114933320102058772210.2337/dc 09-2215 PMC 2890346 · doi ↗ · pubmed ↗
- 3COVID-19 and diabetes: knowledge in progress Diabetes Res Clin Pract Hussain A Bhowmik B do Vale Moreira NC 10814216220203227876410.1016/j.diabres.2020.108142 PMC 7144611 · doi ↗ · pubmed ↗
- 4Management of hyperglycemic crises in patients with diabetes Diabetes Care Kitabchi AE Umpierrez GE Murphy MB Barrett EJ Kreisberg RA Malone JI Wall BM 1311532420011119421810.2337/diacare.24.1.131 · doi ↗ · pubmed ↗
- 5Biostatistics 102: quantitative data--parametric & non-parametric tests Singapore Med J Chan YH 391396442003 https://pubmed.ncbi.nlm.nih.gov/14700417/14700417 · pubmed ↗
- 6Biostatistics 103: qualitative data - tests of independence Singapore Med J Chan YH 498503442003 https://pubmed.ncbi.nlm.nih.gov/15024452/15024452 · pubmed ↗
- 7Biostatistics 104: correlational analysis Singapore Med J Chan YH 614619442003 https://pubmed.ncbi.nlm.nih.gov/14770254/14770254 · pubmed ↗
- 8Diabetes and infection: is there a link?--A mini-review Gerontology Knapp S 991045920132318288410.1159/000345107 · doi ↗ · pubmed ↗