Neutral competition explains the clonal composition of neural organoids
Florian G. Pflug, Simon Haendeler, Christopher Esk, Dominik Lindenhofer, Jürgen A. Knoblich, Arndt von Haeseler

TL;DR
The paper explains how random competition among cells in neural organoids leads to large differences in cell lineage sizes, which helps understand brain development and organoid applications.
Contribution
The SAN model introduces neutral competition among symmetrically dividing cells to explain variability in lineage sizes in neural organoids.
Findings
The SAN model explains the experimentally observed variability in lineage sizes through neutral competition.
The model shows a quantitative relationship between symmetrically dividing cell survival time and lineage size.
The model implies a regulatory mechanism maintaining constant symmetrically dividing cell population size.
Abstract
Neural organoids model the development of the human brain and are an indispensable tool for studying neurodevelopment. Whole-organoid lineage tracing has revealed the number of progenies arising from each initial stem cell to be highly diverse, with lineage sizes ranging from one to more than 20,000 cells. This high variability exceeds what can be explained by existing stochastic models of corticogenesis and indicates the existence of an additional source of stochasticity. To explain this variability, we introduce the SAN model which distinguishes Symmetrically diving, Asymmetrically dividing, and Non-proliferating cells. In the SAN model, the additional source of stochasticity is the survival time of a lineage’s pool of symmetrically dividing cells. These survival times result from neutral competition within the sub-population of all symmetrically dividing cells. We demonstrate that…
Genes, proteins, chemicals, diseases, species, mutations and cell lines named across the full text — each resolved to its canonical identifier and authoritative record.
Click any figure to enlarge with its caption.
 Figure 1
 Figure 2
 Figure 3
 Figure 4
 Figure 5
 Figure 6
 Figure 7
 Figure 8
 Figure 9
 Figure 10
 Figure 11
 Figure 12
 Figure 13
 Figure 14
 Figure 15
 Figure 16
 Figure 17
 Figure 18
 Figure 19
 Figure 20
 Figure 21
 Figure 22
 Figure 23
 Figure 24
 Figure 25
 Figure 26
 Figure 27
 Figure 28
 Figure 29
 Figure 30
 Figure 31
 Figure 32
 Figure 33
 Figure 34
 Figure 35
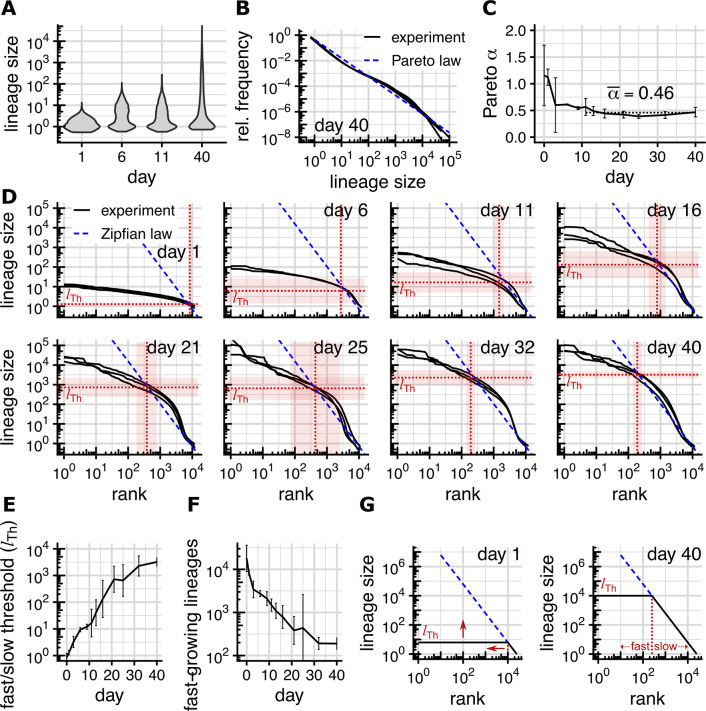 Figure 36
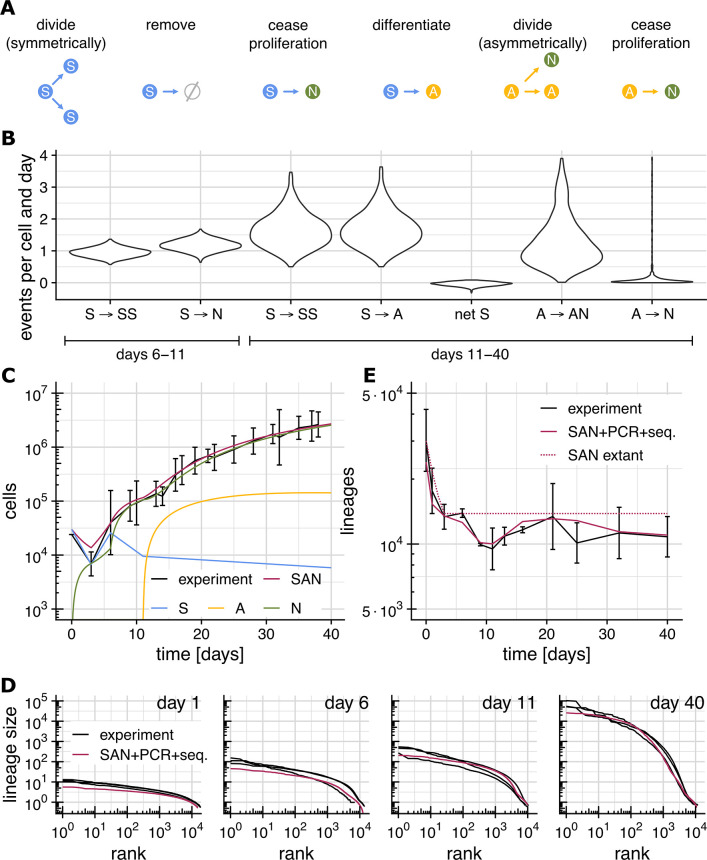 Figure 37
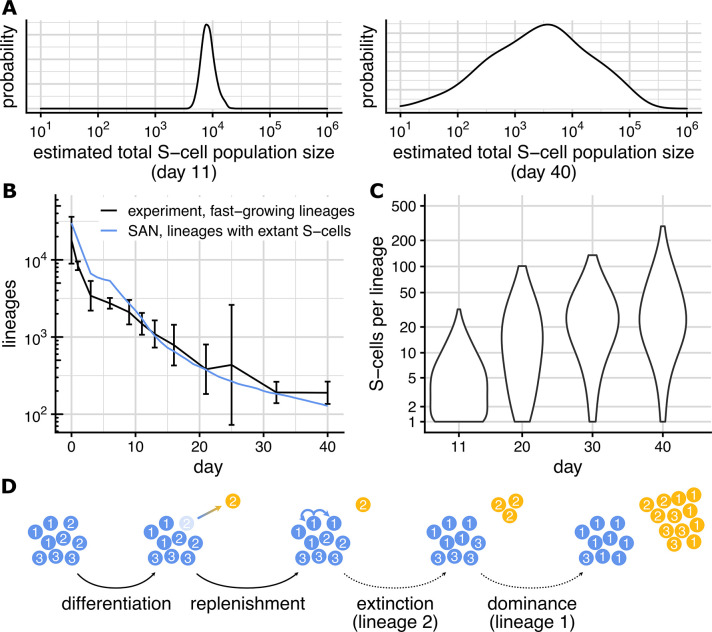 Figure 38
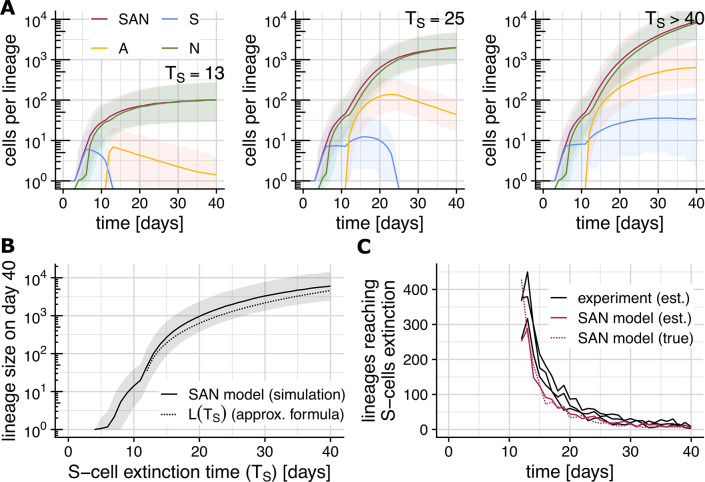 Figure 39
 Figure 40
 Figure 41
Peer Reviews
No public reviews on file for this paper yet. If you reviewed it on a platform where reviews are public (OpenReview, ICLR, NeurIPS, ICML), you can paste yours below so the community can read it here.
Videos
No videos yet. Explain this paper in a talk, walkthrough, or lecture? Add one.
Taxonomy
TopicsPluripotent Stem Cells Research · Gene Regulatory Network Analysis · Single-cell and spatial transcriptomics