Association of composite dietary antioxidant index with depression and all-cause mortality in middle-aged and elderly population
Juanjuan Luo, Xiying Xu, Yiyan Sun, Xixue Lu, Leiyong Zhao

TL;DR
This study finds that a higher dietary antioxidant index is linked to lower depression risk and a complex relationship with mortality in middle-aged and elderly Americans.
Contribution
The study introduces a novel analysis of the composite dietary antioxidant index's association with depression and mortality in older populations.
Findings
Higher CDAI is linearly associated with lower odds of depression.
CDAI shows a non-linear relationship with all-cause mortality, with benefits up to a certain threshold.
The protective effect of CDAI on mortality diminishes beyond an inflection point of -0.19.
Abstract
Current research has shown an increasing acceptance of interventions for depression through dietary modifications. However, whether composite dietary antioxidant index (CDAI) is associated with depression and all-cause mortality in middle-aged and elderly population remains unknown. This study aimed to explore those associations in American middle-aged and elderly population. Weighted logistic regression models and weighted Cox proportional hazard regression models were used to assess the association of CDAI, covariates, depression, and all-cause mortality, respectively. The stability of the results was also determined by a linear trend test based on CDAI quintiles. Restricted cubic spline curves were employed to test for non-linear relationships. In the model adjusted for all covariates, significant associations were found with the ORs (95% CI) for CDAI and depression [0.77 (0.67,…
Genes, proteins, chemicals, diseases, species, mutations and cell lines named across the full text — each resolved to its canonical identifier and authoritative record.
Click any figure to enlarge with its caption.
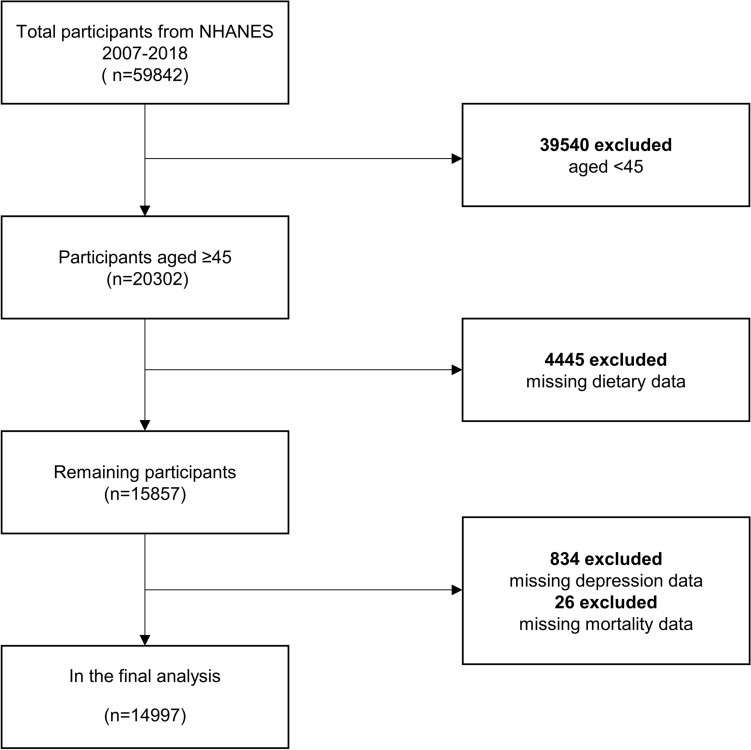 Figure 1
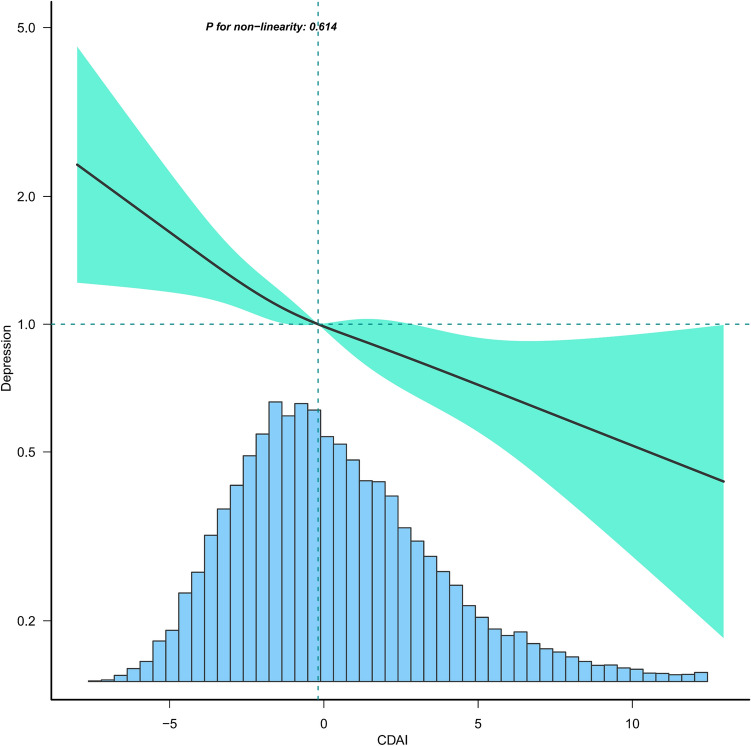 Figure 2
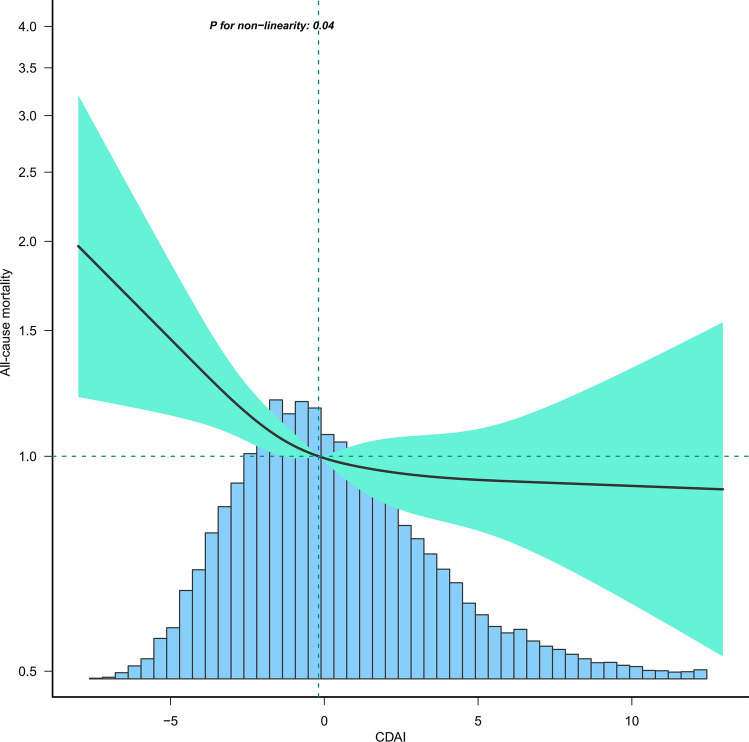 Figure 3
- —Shandong Province Chinese Medicine Science and Technology Project
- —Shandong Provincial Medical and Health Science and Technology Development Program Project
Peer Reviews
No public reviews on file for this paper yet. If you reviewed it on a platform where reviews are public (OpenReview, ICLR, NeurIPS, ICML), you can paste yours below so the community can read it here.
Videos
No videos yet. Explain this paper in a talk, walkthrough, or lecture? Add one.
Taxonomy
TopicsNutritional Studies and Diet · Cardiovascular Health and Risk Factors · Antioxidant Activity and Oxidative Stress
Introduction
Depression is an affective disorder characterized by severe and persistent symptoms of mood, cognition, and physical state, such as low self-esteem, anhedonia, lack of energy, despondency, irritability, and fatigue^1,2^. Severe depression can even lead to suicide and is one of the most common mental illnesses, significantly affecting cognitive functioning, quality of life, and overall health^3^. Moreover, depression has become a serious public health issue, increasing social and economic burdens and the risk of death^4^. Epidemiological studies indicate that more than 350 million people worldwide suffer from depression^5^. The World Health Organization (WHO) predicts that by 2030, major depression will become the leading cause of global disease burden^6^. Research has found that the onset and severity of depression are not only influenced by genetic factors but also by environmental and dietary factors^7–9^.
Dietary interventions for chronic diseases have become increasingly recognized. The Mediterranean diet, based on a high intake of vegetables and fruit, fish, grains, legumes, and olive oil, has been shown to offer protection against heart disease, diabetes, and cardiovascular disease. It also prevents cerebrovascular damage, thereby reducing the risk of stroke, memory loss, and all-cause mortality^10,11^. The dietary approach to stop hypertension (DASH) diet promotes a diet high in potassium, low in sodium, magnesium, and calcium, and high in dietary fiber and unsaturated fatty acids, which is well proven to be effective in lowering blood pressure^12^. The flexible vegetarian diet that emphasizes increased vegetable consumption and reduced meat intake, is very effective in weight loss^13^. Anti-inflammatory diets focusing on fish, fruits, and vegetables have also been demonstrated a suppressive effect on the risk of Alzheimer's disease, Parkinson's disease, atherosclerosis, heart disease, and muscle wasting^14–17^. Furthermore, a meta-analysis showed that the addition of the antioxidant vitamin E to the treatment of depression and anxiety might be beneficial^18^.
The composite dietary antioxidant index (CDAI) is a measurement of individual antioxidant profiles derived from dietary combinations developed to assess and reflect the overall impact of dietary antioxidants on health^19^. Initially, research on the CDAI predominantly addressed cancer; however, its relevance has increasingly expanded into psychiatry in recent years^20,21^. An Iranian study highlighted that the dietary antioxidant index was associated with a reduced incidence of depression and anxiety in young women. However, the association of CDAI with depression and all-cause mortality in the middle-aged and elderly, a population with a high prevalence of depression and death, has still not been explored. To address this gap, we extracted data from the National Health and Nutrition Examination Survey (NHANES) for six cycles (2007–2018) to investigate these associations.
Methods
Study population
NHANES, initiated in 1999 by the Centers for Disease Control and Prevention, is a biennial observational survey that assesses the health and nutritional status of the non-institutionalized US population. It combines interviews with physical examinations to gather comprehensive data on demographics, socioeconomics, dietary habits, and health status. Medical assessments, physiological measurements, and laboratory examinations were conducted by highly qualified medical specialists. The NHANES protocol was approved by the National Center for Health Statistics of the Institutional Review Board, and all participants' informed consent was obtained. For this study, data from six cycles were analyzed, encompassing 14,997 individuals after excluding those who were: (1) younger than 45 years (n = 39,540); (2) missing CDAI data (n = 445); (3) missing depression data (n = 834), missing mortality data(n = 26) (Fig. 1).Figure 1. Flow chart of sample selection.
Assessment of composite dietary antioxidant index
Dietary assessments were based on two 24-h recall interviews conducted by trained dietary interviewers. The first recall was carried out in person using a standardized protocol during the medical examination at the mobile screening center. The second recall was conducted by telephone within 3 to 10 days of the first recall. Nutritional intakes were calculated based on food intake through the use of a revised nutritional database which translates each individual's food intake into nutrients. We calculated CDAI for all subjects from six dietary minerals and vitamins (Mn, Se, Zn, Vitamins A, C, and E) using Wright's recommended measures^22^. The detailed calculation formula was as follows:
\documentclass[12pt]{minimal} \usepackage{amsmath} \usepackage{wasysym} \usepackage{amsfonts} \usepackage{amssymb} \usepackage{amsbsy} \usepackage{mathrsfs} \usepackage{upgreek} \setlength{\oddsidemargin}{-69pt} \begin{document}$$CDAI = \mathop \sum \limits_{{{\text{i}} = 1}}^{{{\text{n}} = 6}} \frac{{{\text{Individual Intake}} - {\text{Mean}}}}{{{\text{SD}}}}$$\end{document}Assessment of depression and all-cause mortality
The diagnosis of depression was determined using the Patient Health Questionnaire-9 (PHQ-9) scores, with each item being scored on a scale of 0–3 and a total score range of 0–27. A PHQ-9 score of 10 or above is considered indicative of depressive symptoms, offering a good balance between sensitivity and specificity for depression diagnosis. This determination has been widely used in cross-sectional studies of depression^23–25^. We extracted mortality data from the National Death Index (NDI) death certificate records, from which the information on mortality status and follow-up time (in months) was collected from the date of participation to the end of the follow-up period (December 31, 2019).
Covariates
Referring to previous literature, we included covariates potentially influencing CDAI, depression, and all-cause mortality. Demographic characteristics such as age, gender, race, education level, marital status, and income-to-poverty ratio were included. Health-related behaviors included smoking status, vigorous recreational activity, drinking status, and medical co-morbidity variables (CVD, stroke, hypertension, diabetes, and cancer) were also collected. Biochemical and physical examinations consisted of C-reactive protein (CRP), body mass index (BMI), and waist. Additionally, the 24-h dietary recall interviews were utilized to obtain energy intake.
Statistical analysis
All statistical analyses were performed in R version 4.2.0 with the "Survey" package after considering the complex sampling design. All statistical tests were two-tailed, with the statistical significance set at p < 0.05. In the baseline population characteristics, we divided the study population into five groups based on quintiles of the CDAI. Continuous variables were expressed as means ± standard errors, and categorical variables were presented as percentages. The weighted linear regression method for continuous variables and the weighted chi-square test for categorical variables were used in the comparison of baseline characteristics. Given that depression and all-cause mortality were both dichotomous variables, weighted logistic regression models and weighted Cox proportional hazard regression models were used to assess the association of CDAI and covariates, depression, and all-cause mortality, respectively. The results of the weighted logistic regression models were expressed as odds ratios (ORs) and 95% confidence intervals (CIs), and for Cox proportional hazard regression models as hazard ratios (HRs) and 95% confidence intervals (CIs).
To exclude the influence of confounding factors, three models were constructed to explore the associations. Model 1 performed the analysis without adjustment for any covariates. Model 2 adjusted for age, sex, and race, and Model 3 adjusted for all covariates listed in Table 1. The robustness of the results was further evaluated by a linear trend test based on CDAI quintiles. Restricted cubic spline curves were employed to test for non-linear relationships between the outcome variable and exposure factors. Upon finding the non-linear relationship, the inflection point was calculated by a recursive algorithm, and a two-piecewise linear regression model was constructed. Stratified analyses and interactions were utilized to explore the characteristics of the relationship between CDAI with depression and all-cause mortality across different population subgroups.Table 1. Characteristics of the study population.Overall(n = 14,997)Q1(n = 3000)Q2(n = 2999)Q3(n = 2999)Q4(n = 2998)Q5(n = 3001)P-valueAge (years)60.61 ± 10.3861.74 ± 10.6261.24 ± 10.7560.92 ± 10.4360.57 ± 10.2459.04 ± 9.78 < 0.0001Sex (%) < 0.0001 Men46.2227.6533.7943.3950.7567.81 Women53.7872.3566.2156.6149.2532.19Race/ethnicity (%) < 0.0001 Mexican American5.045.485.674.914.544.83 White75.6267.8272.4077.0278.8479.41 Black9.6715.8511.888.457.286.92 Other9.6610.8510.049.639.348.85Education level (%) < 0.0001 Less than high school5.068.586.304.813.623.15 High school33.8745.4840.3133.6428.5025.80 More than high school61.0745.9353.3961.5567.8871.05Marital status (%) < 0.0001 Married /Living with partner67.6257.1865.0468.4571.7672.41 Divorced/separated/widowed26.0335.3629.6024.9922.9020.42 Never married6.367.465.366.565.337.17Smoking status (%) < 0.0001 Never15.6023.9317.6214.2412.0412.71 Former32.6927.9729.7232.5236.8234.58 Current51.7148.1152.6653.2451.1452.70Drinking status (%) < 0.0001 Never11.3316.4513.4011.119.578.02 Former17.3622.6418.3115.5715.9415.94 Current71.3160.9168.2973.3274.4976.04Vigorous recreational activities (%) < 0.0001 Yes16.317.8012.0914.7718.7624.89 No83.6992.2087.9185.2381.2475.11Cancer (%)0.0330 Yes17.3117.0716.1819.1016.6517.39 No82.6982.9383.8280.9083.3582.61CVD (%) < 0.0001 Yes14.5018.4915.5714.5314.2311.01 No85.5081.5184.4385.4785.7788.99Stroke (%) < 0.0001 Yes4.827.685.314.124.763.07 No95.1892.3294.6995.8895.2496.93Hypertension (%) < 0.0001 Yes55.4558.8359.1756.1253.6651.15 No44.5541.1740.8343.8846.3448.85Diabetes (%) < 0.0001 Yes17.1720.4518.1317.7116.7013.99 No82.8379.5581.8782.2983.3086.01Depression (%) < 0.0001 Yes7.9813.149.438.095.565.36 No92.0286.8690.5791.9194.4494.64All-cause mortality(%) < 0.0001 Yes10.7114.3512.0910.998.848.55 No89.2985.6587.9189.0191.1691.45 Income-to-poverty ratio3.27 ± 1.602.64 ± 1.592.96 ± 1.583.36 ± 1.583.55 ± 1.533.61 ± 1.54 < 0.0001BMI (kg/m^2^)29.57 ± 6.6029.81 ± 6.8329.69 ± 6.5129.72 ± 6.7329.38 ± 6.2629.33 ± 6.670.0127Waist (cm)102.27 ± 15.43101.69 ± 15.15101.70 ± 14.96102.30 ± 15.52102.43 ± 15.47102.92 ± 15.820.0110Energy intake (kcal)1986.12 ± 732.591231.67 ± 384.051617.87 ± 397.221892.91 ± 457.632169.18 ± 518.742735.07 ± 751.75 < 0.0001CRP (mg/dl)2.38 ± 5.953.53 ± 8.592.46 ± 4.302.50 ± 7.212.18 ± 4.971.56 ± 3.76 < 0.0001CVD cardiovascular disease; BMI body mass index; CRP c-reactive protein.
Ethical approval
The NHANES protocol was approved by the National Center for Health Statistics of the Institutional Review Board, and all participants' informed consent was obtained. All methods were carried out in accordance with relevant guidelines and regulations (declarations of Helsinki).
Results
Characteristics of the study population
In the baseline population of Table 1, men accounted for 46.22%, and women for 53.78%. The proportions of Mexican American, White, and Black were 5.04%, 75.6%, and 9.67%, respectively. Additionally, 61.07% of participants had a high school education or higher. Analysis revealed that individuals with higher CDAI were younger, more likely to be men, and white, with higher levels of education and income-to-poverty ratio. These individuals also reported higher energy intake, more frequent engagement in recreational activities, and exhibited lower risks of hypertension, diabetes, depression, and all-cause mortality, alongside reduced C-reactive protein levels.
Univariate analysis
The results of the univariate analysis are presented in Table 2. Women had a higher risk of depression and a lower risk of all-cause mortality compared to men. Depression showed a negative association with income-to-poverty ratio, vigorous recreational activities, CVD, stroke, hypertension, diabetes, BMI, waist, and CRP, and smoking status was found to be positively associated with depression. The covariates positively associated with all-cause mortality included age, cancer, CVD, stroke, hypertension, diabetes, waist, and energy intake.Table 2. Univariate analyses.DepressionAll -cause mortalityOR (95% CI)p-valueHR (95% CI)p-valueAge0.98 (0.97, 0.99) < 0.00011.11 (1.10, 1.11) < 0.0001Sex Male1.01.0 Female1.60 (1.34, 1.92) < 0.00010.76 (0.69, 0.85) < 0.0001Race/ethnicity Mexican American1.01.0 White0.69 (0.56, 0.85)0.00071.83 (1.37, 2.44)0.0001 Black0.88 (0.71, 1.10)0.27191.70 (1.26, 2.30)0.0009 Other1.11 (0.85, 1.45)0.45631.00 (0.69, 1.43)0.9873Education level Less than high school1.01.0 High school0.71 (0.60, 0.85)0.00020.65 (0.54, 0.78) < 0.0001 More than high school0.36 (0.29, 0.45) < 0.00010.35 (0.27, 0.44) < 0.0001Marital status Married/Living with partner1.01.0 Divorced/separated/widowed2.14 (1.81, 2.53) < 0.00012.15 (1.92, 2.41) < 0.0001 Never married2.23 (1.73, 2.88) < 0.00011.37 (1.06, 1.77)0.0190Smoking status Current1.01.0 Former0.39 (0.32, 0.48) < 0.00011.06 (0.90, 1.26)0.4844 Never0.29 (0.24, 0.34) < 0.00010.59 (0.50, 0.69) < 0.0001Drinking status Current1.0 < 0.00011.0 Former2.12 (1.60, 2.80)1.66 (1.38, 2.00) < 0.0001 Never1.04 (0.84, 1.29)0.72030.51 (0.41, 0.63) < 0.0001Vigorous recreational activities Yes1.01.0 No5.89 (4.04, 8.59) < 0.00014.35 (3.25, 5.82) < 0.0001Cancer Yes1.01.0 No1.11 (0.88, 1.40)0.38800.46 (0.42, 0.52) < 0.0001CVD Yes1.01.0 No0.47 (0.39, 0.56) < 0.00010.25 (0.22, 0.30) < 0.0001Stroke Yes1.01.0 No0.38 (0.29, 0.50) < 0.00010.26 (0.21, 0.33) < 0.0001Hypertension Yes1.01.0 No0.63 (0.53, 0.75) < 0.00010.39 (0.34, 0.44) < 0.0001Diabetes Yes1.01.0 No0.59 (0.50, 0.71) < 0.00010.47 (0.42, 0.54) < 0.0001Income-to-poverty ratio0.65 (0.60, 0.69) < 0.00010.72 (0.68, 0.75) < 0.0001BMI1.04 (1.03, 1.05) < 0.00010.99 (0.98, 1.00)0.2975Waist1.01 (1.01, 1.02) < 0.00011.01 (1.00, 1.01)0.0018Energy intake1.00 (1.00, 1.00)0.00021.00 (1.00, 1.00) < 0.0001CRP1.02 (1.01, 1.03) < 0.00010.97 (0.93, 1.02)0.2648CVD, cardiovascular disease; BMI, body mass index; CRP, c-reactive protein.
Association between CDAI and depression and all-cause mortality
As shown in Table 3, the initial unadjusted analysis (Model 1) revealed that CADI was negatively associated with depression [0.74 (0.70, 0.79)] and all-cause mortality [0.84 (0.80, 0.88)]. This negative association persisted in regression models adjusted for all variables, with ORs for CDAI with depression at 0.77 (95% CI: 0.67, 0.89) and HRs for CDAI with all-cause mortality at 0.91 (95% CI: 0.83, 1.00). Comparing against the lowest quartile of CDAI (Q1) as the reference, higher CDAI was associated with a lower risk of depression, with ORs (95% CI) of 0.80 (0.61, 1.04), 0.67 (0.52, 0.87), 0.65 (0.48, 0.88), and 0.52 (0.36, 0.77). A similar trend was observed for all-cause mortality risk, with HRs (95% CI) of 0.87 (0.72, 1.05), 0.82 (0.69, 0.98), 0.77 (0.63, 0.96), and 0.75 (0.58, 0.96). Subsequent analysis using restricted cubic spline curves indicated a linear association between CDAI and depression (Fig. 2), whereas the relationship with all-cause mortality was non-linear with an inflection point of −0.19 (Fig. 3). This association was statistically significant only before this inflection point [0.71 (0.56, 0.89)] (Table 4).Table 3. Association of composite dietary antioxidant index with depression and all-cause mortality in middle-aged and elderly population.Model 1 OR (95% CI)P-valueModel 2 OR (95% CI)P-valueModel 3 OR (95% CI)P-valueDepression CDAI..Z score0.74 (0.70, 0.79) < 0.00010.75 (0.71, 0.80) < 0.00010.77 (0.67, 0.89)0.0003 Q11.01.01.0 Q20.72 (0.62, 0.84) < 0.00010.72 (0.61, 0.84) < 0.00010.80 (0.61, 1.04)0.0950 Q30.67 (0.57, 0.78) < 0.00010.67 (0.57, 0.79) < 0.00010.67 (0.52, 0.87)0.0021 Q40.49 (0.41, 0.59) < 0.00010.50 (0.42, 0.60) < 0.00010.65 (0.48, 0.88)0.0059 Q50.44 (0.37, 0.53) < 0.00010.46 (0.38, 0.55) < 0.00010.52 (0.36, 0.77)0.0009 P for trend < 0.0001 < 0.00010.0031Model 1 HR (95% CI)P-valueModel 2 HR (95% CI)P-valueModel 3 HR (95% CI)P-valueAll-cause mortality CDAI..Z score0.84 (0.80, 0.88) < 0.00010.84 (0.80, 0.88) < 0.00010.91 (0.83, 1.00)0.0419 Q11.01.01.0 Q20.87 (0.77, 0.99)0.03160.81 (0.71, 0.92)0.00090.87 (0.72, 1.05)0.1456 Q30.84 (0.74, 0.95)0.00490.80 (0.71, 0.91)0.00060.82 (0.69, 0.98)0.0305 Q40.69 (0.60, 0.79) < 0.00010.64 (0.56, 0.74) < 0.00010.77 (0.63, 0.96)0.0184 Q50.62 (0.54, 0.71) < 0.00010.62 (0.54, 0.71) < 0.00010.75 (0.58, 0.96)0.0238 P for trend < 0.0001 < 0.00010.0600Model 1: No covariates were adjusted.Model 2: Age, sex, race were adjusted.Model 3: Age, sex, race, education level, income-to-poverty ratio, marital status, smoking status,drinking status, vigorous recreational activity, BMI, waist, stroke, diabetes, CVD, cancer, hypertension, energy intake, and CRP were adjusted.Figure 2. Association between CDAI and depression in middle-aged and elderly population. Age, sex, race, education level, income-to-poverty ratio, marital status, smoking status, drinking status, vigorous recreational activity, BMI, waist, stroke, diabetes, CVD, cancer, hypertension, energy intake, and CRP were adjusted.Figure 3. Association between CDAI and all-cause mortality in middle-aged and elderly population. Age, sex, race, education level, income-to-poverty ratio, marital status, smoking status,drinking status, vigorous recreational activity, BMI, waist, stroke, diabetes, CVD, cancer, hypertension, energy intake, and CRP were adjusted.Table 4. Threshold effect analysis of composite dietary antioxidant index on all-cause mortality in middle-aged and elderly population using a two-piecewise linear regression model.All-cause mortalityAdjust HR (95% CI)P-valueCDAI Fitting by standard linear model0.91 (0.83, 1.00)0.0419Fitting by two-piecewise linear model Inflection point − 0.19 < −0.190.71 (0.56, 0.89)0.0029 > −0.190.99 (0.96, 1.02)0.4288 Log-likelihood ratio0.021Age, sex, race, education level, income-to-poverty ratio, marital status, smoking status, drinking status, vigorous recreational activity, BMI, waist, stroke, diabetes, CVD, cancer, hypertension, energy intake, and CRP were adjusted.
Subgroup analysis
To explore the disparities in the relationship between CDAI and depression and all-cause mortality in various subgroups, stratified analyses and interactions were conducted in the middle-aged and elderly population (Table 5), and significant differences were found in these relationships only in the smoking population (P interaction = 0.0343 and P interaction = 0.0399). The associations between CDAI and depression and all-cause mortality were 0.76 (0.59, 0.97) and 0.69 (0.54, 0.89) for former smokers. For those who had never smoked, the relationship was 0.64 (0.51, 0.80) and 0.64 (0.51, 0.80).Table 5. Subgroup logistic regression analysis for the association between CDAI and outcomes in middle-aged and elderly population.SubgroupDepressionAll -cause mortalityOR (95% CI)p interactionHR (95% CI)p interactionSex0.36730.5397 Male0.83 (0.67, 1.02)0.88 (0.79, 0.99) Female0.73 (0.61, 0.88)0.93 (0.80, 1.09)Race/ethnicity0.19540.0986 Mexican American0.54 (0.36, 0.81)0.73 (0.47, 1.13) White0.77 (0.64, 0.94)0.90 (0.80, 1.00) Black0.87 (0.63, 1.21)0.79 (0.61, 1.02) Other0.91 (0.67, 1.24)1.27 (0.93, 1.75)Education0.44310.2725 Less than high school0.61 (0.41, 0.92)1.02 (0.79, 1.31) High school0.80 (0.65, 0.98)0.94 (0.82, 1.08) More than high school0.81 (0.66, 1.00)0.94 (0.82, 1.08)Marital status0.80560.3982 Married/Living with partner0.77 (0.63, 0.93)0.86 (0.76, 0.98) Divorced/separated/widowed0.81 (0.66, 1.00)0.98 (0.85, 1.14) Never married0.90 (0.56, 1.44)0.94 (0.63, 1.41)Vigorous recreational activities0.22080.2244 Yes1.05 (0.64, 1.72)1.13 (0.77, 1.65) No0.75 (0.65, 0.87)0.88 (0.80, 0.97)Smoking status0.03430.0399 Current0.99 (0.78, 1.26)0.86 (0.69, 1.06) Former0.76 (0.59, 0.97)0.69 (0.54, 0.89) Never0.64 (0.51, 0.80)0.57 (0.46, 0.72)Drinking status0.39430.8828 Current0.60 (0.39, 0.93)0.96 (0.75, 1.22) Former0.75 (0.57, 0.97)0.89 (0.76, 1.04) Never0.82 (0.69, 0.97)0.90 (0.79, 1.03)Cancer0.07400.9328 Yes0.81 (0.70, 0.94)0.90 (0.80, 1.00) No0.56 (0.38, 0.83)0.91 (0.76, 1.08)Stroke0.40060.8727 Yes0.64 (0.40, 1.02)0.88 (0.69, 1.12) No0.79 (0.68, 0.91)0.90 (0.81, 0.99)CVD0.76860.9631 Yes0.74 (0.56, 0.98)0.90 (0.77, 1.04) No0.78 (0.67, 0.92)0.90 (0.80, 1.01)Diabetes0.53050.3756 Yes0.85 (0.56, 1.27)0.84 (0.70, 1.01) No0.77 (0.63, 0.93)0.93 (0.83, 1.03)Hypertension0.54060.4842 Yes0.80 (0.67, 0.95)0.89 (0.80, 0.99) No0.73 (0.58, 0.92)0.96 (0.80, 1.14)In the subgroup analysis stratified by sex, race, education, marital status, vigorous recreational activities, smoking status, drinking status, stroke, CVD, diabetes, hypertension, and cancer, the model is not adjusted for sex, race, education, marital status, vigorous recreational activities, smoking status, drinking status, stroke, CVD, diabetes, hypertension, and cancer, respectively.
Discussion
In the observational study among middle-aged and elderly Americans, higher CDAI was associated with a lower risk of depression and all-cause mortality. Further restricted cubic spline curves revealed a linear association of CDAI with depression and a non-linear association of CDAI with all-cause mortality. The inflection point was detected with the relationship being statistically significant only before the inflection point. To explore whether there were differences in the relationships among various subgroups, we conducted stratified analyses. To the best of our knowledge, this investigation represented the inaugural attempt to examine the association of CDAI with depression and all-cause mortality in a middle-aged and elderly population, and the most detailed subgroup analysis was performed.
The association between dietary antioxidants and depression and all-cause mortality has received increasing attention in recent years. Evidence suggested that only antioxidants derived from food sources, not dietary supplements, could offer protective benefits against depression^26^. Observational meta-analyses have shown that the intakes of vitamins A, C, and E were inversely related to the incidence of depression^27,28^. A cross-sectional study in the United States indicated that higher zinc intake was associated with a lower risk of depression^29^. Interestingly, a study from Brazilian Farmers showed a non-linear negative correlation between dietary selenium intake and depression^30^. Similarly, a study on the general American population found a non-linear negative relationship between CDAI and depression^21^. However, both our study and the study of Iranian adolescent girls revealed that the relationship between CDAI and depression was linearly negative^31^. Moreover, the findings on the relationship between dietary antioxidants and all-cause mortality were often inconsistent. A Korean study suggested that dietary zinc intake was associated with lower all-cause mortality^32^, contradicting a study in China, which found a positive correlation between zinc intake and all-cause mortality^33^. Additionally, studies in China and the United States have shown that selenium intake was linked to reduced all-cause mortality^34,35^. An elderly epidemiological study indicated that supplementing with vitamins C and E could lower the risk of all-cause mortality^36^. However, a cohort study from the UK Biobank found no significant association between antioxidant use and all-cause mortality^37^. In contrast, a cohort study of American cancer survivors revealed a significantly negative association between CDAI and the risk of mortality^38^. Our research identified a non-linear relationship between CDAI and all-cause mortality, whereas a study on the general US population indicated a linear relationship between CDAI and all-cause mortality^39^. Age and geographic differences may account for the inconsistent relationship of dietary antioxidants with depression and all-cause mortality. People in different geographical areas have different dietary habits, which leads to differences in antioxidant intake. In addition, middle-aged and elderly people tend to decline in physical function, which may affect the absorption and utilization of dietary antioxidants, consequently causing inconsistencies in the results of the studies.
Although the specific mechanisms linking CDAI to depression and all-cause mortality in middle-aged and elderly population are still not well understood, some possible molecular mechanisms have been suggested in some studies. The first is oxidative stress. Depressed people often experience oxidative stress, characterized by an imbalance between oxygen free radicals and antioxidant substances in the body^40^. Oxygen free radicals are harmful molecules that interact with other molecules in the body and cause oxidative damage to cells and tissues^41^. Consuming a diet rich in antioxidants has been shown to lower oxidative stress and protect cells from damage caused by free radicals,thereby alleviating symptoms of depression^42^. Studies have shown that vitamins C and E can trap free radicals and protect molecules such as membrane fatty acids, cholesterol, and proteins from oxidative damage, thus reducing the risk of developing chronic diseases such as cancer, cardiovascular disease, and diabetes^43,44^. Additionally, appropriate exogenous antioxidants can decrease the risk of mortality in diabetic population by balancing oxidative stress reactions^45^. The second is chronic inflammation: Strong evidence suggests that neuroinflammation can promote the emergence and development of depression^46,47^. The antioxidant properties of the diet are capable of diminishing the neuroinflammatory response by modulating the levels of inflammatory factors. Some studies have shown that dietary zinc, vitamin A, and E can lower levels of inflammatory factors such as interleukin-6 (IL-6), tumor necrosis factor-alpha (TNF-α), and interferon-gamma (IFN-γ), consequently reducing the impact of neuroinflammation on depression^48^. Other studies have shown that chronic inflammation is strongly associated with the development and progression of a variety of diseases, including cardiovascular disease, diabetes, obesity, and cancer, as well as being associated with an increased risk of all-cause mortality^49,50^. Antioxidant diets could significantly reduce inflammatory markers, improve chronic disease states, and reduce mortality risk^51–53^. The third is neuroplasticity. Depressed patients often experience impaired neuroplasticity and reduced levels of brain-derived neurotrophic factor (BDNF). BDNF is known to be essential for the growth, differentiation, and survival of nerve cells, and BDNF also promotes neuronal connectivity and the formation of neural networks, which is a key factor in neuroplasticity^54^. Antioxidant diets can affect the production and release of neurotrophic factors such as neurotrophic factor (NGF) and BDNF^55^. These neurotrophic factors promote neuronal proliferation and synaptic plasticity, helping to maintain and enhance neurological health and thus improving depressive symptoms^56^. The fourth is neurotransmitters. Neurotransmitters such as serotonin, dopamine, and norepinephrine, are critical in regulating mood and depression^57^. Antioxidants contribute to the protection of nerve cells from damage and improve neurotransmitter function, which can help prevent and treat depression. Specifically, the antioxidant vitamin C has been found to promote the release of neurotransmitters such as dopamine, norepinephrine, and 5-hydroxytryptamine from neurons, increasing the levels of neurotransmitters that influence communication between neurons^58^. The fifth is the gut microbiota. Imbalances in the gut microbiota have been shown to be strongly associated with the development of depression and adverse outcomes of various diseases^59^. Compared with healthy individuals, the gut microbial composition of depressed patients changed, particularly in microbial diversity and relative abundance of specific bacterial taxa^60,61^. In hemodialysis patients, the microbial diversity of non-survivors was significantly lower than that of survivors, especially in terms of amber fungi and anaerobic bacteria^62^. Studies have indicated that dietary antioxidant micronutrients can alleviate depressive symptoms and extend the life span of patients by modulating the abundance of the gut microbiota^63,64^.
Subgroup analyses were conducted to better explore differences among subgroups. Notably, in stratified analyses incorporating demographic characteristics, lifestyle factors, and comorbidities, a statistically significant interaction emerged specifically regarding smoking status. This finding indicated that those who had never smoked benefited more from an antioxidant-rich diet than those who had smoked and were still smoking. Studies have shown that smoking can lead to an increase in lipid peroxidation products and extracellular matrix protein degradation products, chemotaxis of activated neutrophils and macrophages, increased levels of circulating pro-inflammatory markers and oxidative stress markers, including reactive oxygen species (ROS) levels, superoxide dismutase (SOD), and glutathione peroxidase (GPx), along with a decrease in antioxidant levels^65–68^. Abnormal levels of inflammation and antioxidants can exacerbate the onset of depression and death^69,70^. Thus, in people who have never smoked, an antioxidant diet may better reduce the risk of depression and all-cause mortality.
Our study has several strengths. First, NHANES used standardized methods for data collection and analysis, coupled with stringent quality control of the data to ensure accuracy and reliability. Second, NHANES censuses thousands of participants from all over the country each year, enabling a large sample size and representativeness that provide a wide range of data on the health status of the US population. Third, we performed restricted cubic spline analyses to assess the dose–response relationship between CDAI and the risk of depression and all-cause mortality. Fourth, as global aging increases, it is important to study a large sample of data on middle-aged and elderly adults for health guidance and public health policy development in older populations. Fifth, a more comprehensive inclusion of risk factors affecting depression and all-cause mortality makes the study results more credible. There are also some limitations to this study. First, the observational study designs could only indicate that higher CDAI was associated with a lower risk of depression and all-cause mortality in middle-aged and older populations, whereas no conclusions about causality could be drawn. Second, given that the dietary data were obtained through follow-up interviews, and considering potential memory loss in the middle-aged and elderly population with depressive disorders, recall bias was an unavoidable limitation. Third, the dietary data were extracted from only two follow-up visits and therefore may not accurately reflect the typical dietary patterns of the subjects. Fourth, since this study was conducted on a middle-aged and older population in the United States, this limits the applicability of the findings to other demographics, and future research is necessary to examine the relevance of these findings in different international contexts.
Conclusion
In this study of middle-aged and elderly Americans, CDAI was linearly negatively associated with depression and non-linearly negatively associated with all-cause mortality. The stratified analysis revealed differences between populations with different smoking statuses, and these findings may help public health authorities tailor policies to prevent and improve people's emotional states and increase longevity. Further basic research will be required to discover the molecular biological mechanisms underpinning these associations.
The reference list from the paper itself. Each links out to its DOI / PubMed record.
- 1Smith K Mental health: A world of depression Nature 201451518110.1038/515180 a 25391942 · doi ↗ · pubmed ↗
- 2Monroe SM Harkness KL Major depression and its recurrences: Life course matters Annu. Rev. Clin. Psychol.20221832935710.1146/annurev-clinpsy-072220-02144035216520 · doi ↗ · pubmed ↗
- 3Douglas KM Porter RJ Knight RG Maruff P Neuropsychological changes and treatment response in severe depression Br. J. Psychiatry 201119811512210.1192/bjp.bp.110.08071321282781 · doi ↗ · pubmed ↗
- 4Mc Carron RM Shapiro B Rawles J Luo J Depression Ann. Intern. Med.2021174658010.7326/AITC 20210518033971098 · doi ↗ · pubmed ↗
- 5Kessler RC Anxious and non-anxious major depressive disorder in the World Health Organization World Mental Health Surveys Epidemiol. Psychiatr. Sci.20152421022610.1017/S 204579601500018925720357 PMC 5129607 · doi ↗ · pubmed ↗
- 6O'Leary K Global increase in depression and anxiety Nat. Med.202110.1038/d 41591-021-00064-y 34675435 · doi ↗ · pubmed ↗
- 7Kosciuszko M Steptoe A Ajnakina O Genetic propensity, socioeconomic status, and trajectories of depression over a course of 14 years in older adults Transl. Psychiatry 2023136810.1038/s 41398-023-02367-936823133 PMC 9950051 · doi ↗ · pubmed ↗
- 8Leone M Genetic and environmental contribution to the co-occurrence of endocrine-metabolic disorders and depression: A Nationwide Swedish Study of Siblings Am. J. Psychiatry 202217982483210.1176/appi.ajp.2109095436128682 · doi ↗ · pubmed ↗