Role of RelA-synthesized (p)ppGpp and ROS-induced mutagenesis in de novo acquisition of antibiotic resistance in E. coli
Wenxi Qi, Martijs J. Jonker, Wim de Leeuw, Stanley Brul, Benno H. ter Kuile

TL;DR
This study shows how the bacterial response to stress, involving (p)ppGpp and ROS, helps E. coli develop antibiotic resistance, and how blocking these processes could reduce resistance.
Contribution
The study reveals a novel mechanism linking (p)ppGpp and ROS to the de novo acquisition of antibiotic resistance in E. coli.
Findings
Deletion of relA or rpoS slows the development of resistance to bactericidal antibiotics.
Resistant strains show mutations in genes related to antibiotic resistance and stress responses.
Knockout of relA reduces ROS and DNA damage, weakening DNA repair in resistant strains.
Abstract
The stringent response of bacteria to starvation and stress also fulfills a role in addressing the threat of antibiotics. Within this stringent response, (p)ppGpp, synthesized by RelA or SpoT, functions as a global alarmone. However, the effect of this (p)ppGpp on resistance development is poorly understood. Here, we show that knockout of relA or rpoS curtails resistance development against bactericidal antibiotics. The emergence of mutated genes associated with starvation and (p)ppGpp, among others, indicates the activation of stringent responses. The growth rate is decreased in ΔrelA-resistant strains due to the reduced ability to synthesize (p)ppGpp and the persistence of deacylated tRNA impeding protein synthesis. Sluggish cellular activity causes decreased production of reactive oxygen species (ROS), thereby reducing oxidative damage, leading to weakened DNA mismatch repair,…
Genes, proteins, chemicals, diseases, species, mutations and cell lines named across the full text — each resolved to its canonical identifier and authoritative record.
Click any figure to enlarge with its caption.
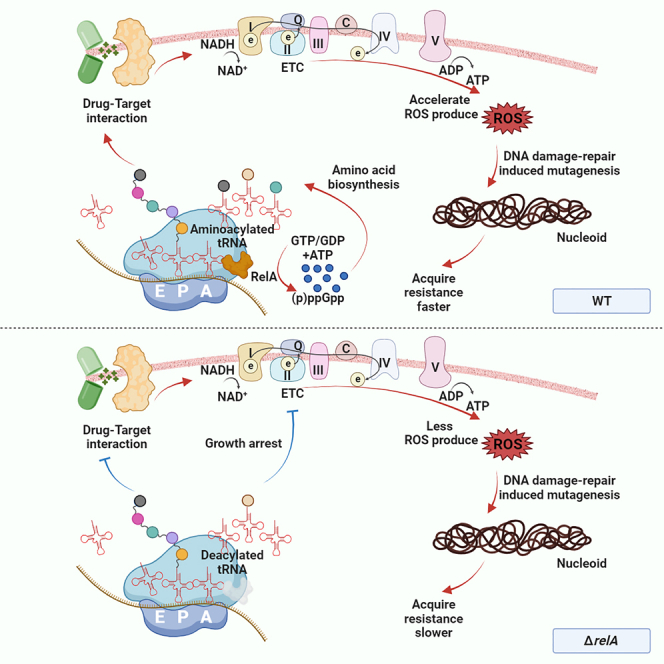 Figure 1
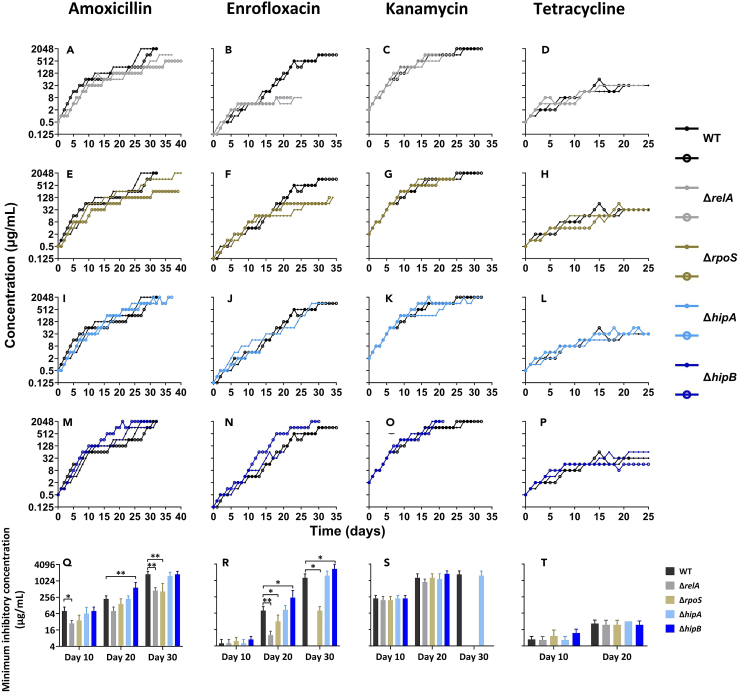 Figure 2
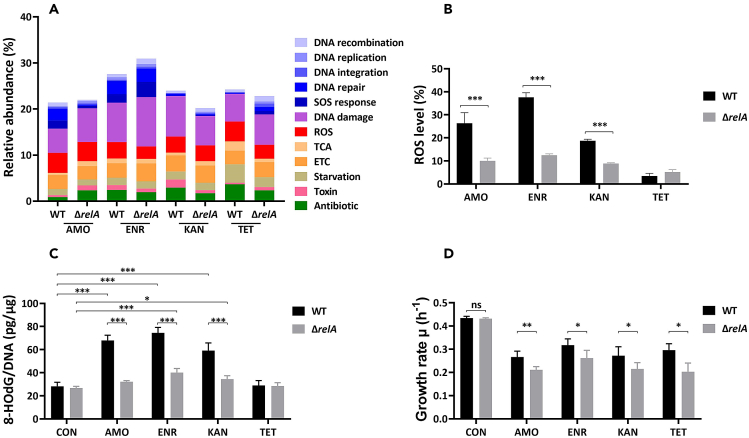 Figure 3
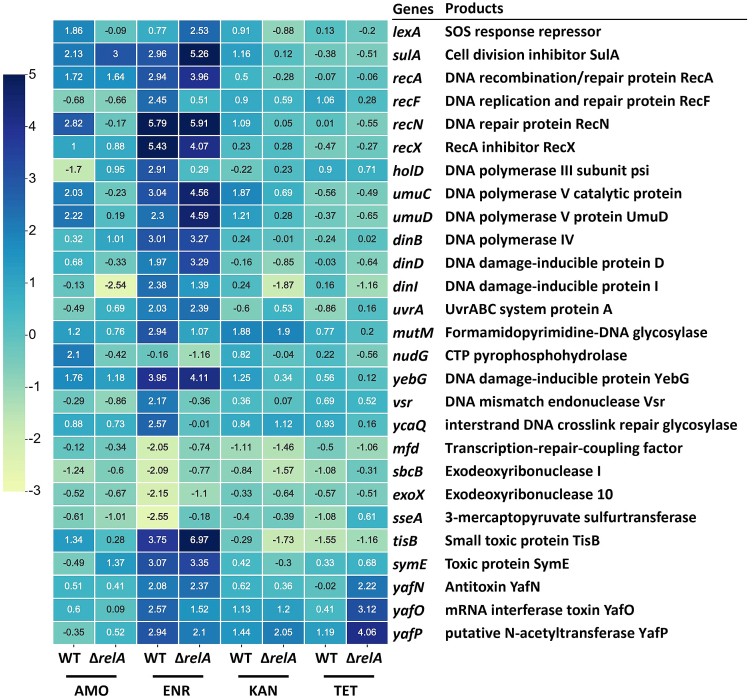 Figure 4
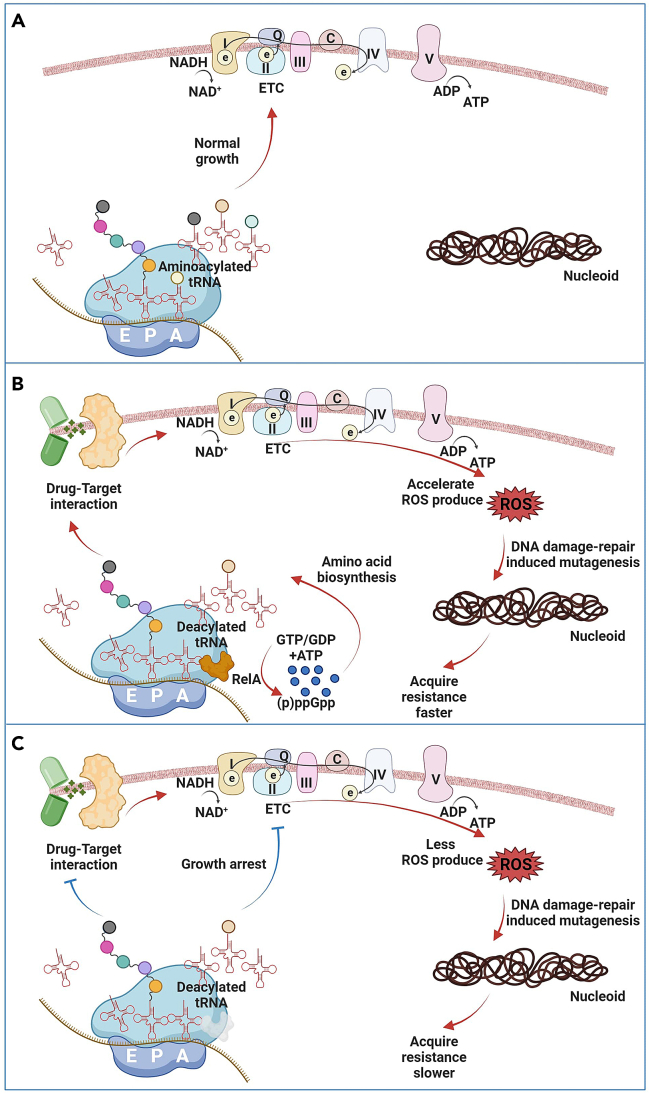 Figure 5
Peer Reviews
No public reviews on file for this paper yet. If you reviewed it on a platform where reviews are public (OpenReview, ICLR, NeurIPS, ICML), you can paste yours below so the community can read it here.
Videos
No videos yet. Explain this paper in a talk, walkthrough, or lecture? Add one.
Taxonomy
TopicsGranular flow and fluidized beds · Geotechnical and Geomechanical Engineering · Tunneling and Rock Mechanics
Introduction
The spectrum of bacterial defense mechanisms against antimicrobials encompasses, but is not confined to, target alterations, upregulation of efflux pumps, reduction of cellular permeability, and modification of antibiotics.1 Such complicated mechanisms necessitate specific physiological activity within the cells. Stress caused by exposure to antibiotics and the subsequent increased protein synthesis triggers in bacteria the same stringent response as during nutrient starvation. This response is mediated by the synthesis of the signaling nucleotides guanosine tetraphosphate (ppGpp) and guanosine pentaphosphate (pppGpp), collectively termed (p)ppGpp.2^,^3 Bacterial resistance to antibiotics is caused by cellular adaptation in combination with genomic DNA mutations or acquisition of exogenous DNA.4 There is evidence indicating that molecular alterations seen as a result of the stringent response are related to the development of resistance mutations in both ways.5
The enzyme GDP/GTP pyrophosphokinase RelA plays a crucial role in the stringent response by catalyzing the synthesis of (p)ppGpp.6 Hence it is hypothesized that the knockout of relA results in the suppression of (p)ppGpp synthesis. Deletion of relA in E. coli results in reduced mutation rates in multiple amino acid auxotrophic strains, and a direct correlation has been established between the concentration of (p)ppGpp and the mutation rate.7^,^8 Furthermore, the involvement of (p)ppGpp extends to the regulatory control of class 1 integron integrases which enable bacteria to express and capture antibiotic resistance gene cassettes under starvation-induced stringent response in biofilms.9
The regulatory impact of (p)ppGpp, accomplished through its direct interaction with RNA polymerase, manifests itself in the modulation of transcription initiation at specific gene promoters. Additionally, (p)ppGpp is involved in modulating the production and activity of the RNA polymerase sigma factor RpoS, which serves as the master transcriptional regulator of the general stress response.10 HipA and HipB are components of a type II toxin-antitoxin (TA) system. It has been demonstrated that HipA expression activates ppGpp synthesis mediated by RelA.11 On the other hand, HipB functions as an antitoxin, counteracting the toxic effects of the cognate toxin HipA.12 Consequently, the knockout of hipB may potentially result in an elevated level of ppGpp. This study addresses the role of stringent response mediated stress responses on antibiotic resistance development upon long-term exposure to sub-lethal levels of antibiotics, by means of evolution experiments on four (p)ppGpp associated E. coli knockout strains ΔrelA, ΔrpoS, ΔhipA, and ΔhipB.
Reactive oxygen species (ROS) produced upon exposure to sublethal levels of bactericidal antibiotics affect development of resistance according to a hormesis mechanism.13^,^14 That is, high levels of ROS kill cells, while sub-lethal levels of ROS affect cellular DNA inducing mutations that may be beneficial in promoting the formation of antibiotic resistance.15 Besides their specific antibiotic-target interactions, bactericidal antibiotics, such as β-lactams, quinolones, and aminoglycosides, stimulate oxidation of NADH via the electron transport chain.16 As a consequence, superoxide formation is also enhanced, which in turn promotes hydroxyl radical formation via the Fenton reaction.17^,^18 These byproducts, collectively called ROS, are very reactive with cellular components, especially DNA, for example by oxidizing guanine to 8-hydroxy-2′-deoxyguanosine (8-HOdG), which may increase mutation rates.19 The oxidative response induced by ROS and the stringent response triggered by (p)ppGpp are both metabolic feedback loops by which cells respond to various stresses. The connection between these two stress responses and their implications for acquisition of resistance under antibiotic exposure remain to be elucidated.
In this investigation, we quantified the ROS levels during antibiotic resistance development within (p)ppGpp-synthesis mutant strains, simultaneously assessing the inflicted damage due to ROS and the subsequent repair processes. We propose a mechanism for the interplay between the stringent stress response and oxidative stress responses and corroborate the association between ROS-mediated hormesis and the evolution of antimicrobial resistance, particularly at relatively moderate ROS levels.
Results
Lower rates of resistance development in relA or rpoS knockout strains
To investigate the effect of (p)ppGpp on the acquisition of de novo antibiotic resistance, we exposed fully susceptible E. coli wild-type and four single-gene knockout strains ΔrelA, ΔrpoS, ΔhipA, and ΔhipB to stepwise-increasing sub-lethal concentrations of four antibiotics (Figure 1). The resistance evolution experiments started at one-quarter of the minimum inhibitory concentration (MIC) for amoxicillin (0.5 μg/mL), enrofloxacin (0.125 μg/mL), kanamycin (2 μg/mL), and tetracycline (0.5 μg/mL).Figure 1. Effect of relA, rpoS, hipA, and hipB knockouts on antibiotics resistance development(A–P) Antibiotic resistance development was evaluated in E. coli wild-type MG1655 (WT) and single gene knockout strains ΔrelA, ΔrpoS, ΔhipA, and ΔhipB against amoxicillin (A, E, I, and M), enrofloxacin (B, F, J, and N), kanamycin (C, G, K, and O), and tetracycline (D, H, L, and P). The x axis represents the duration of evolution in days, while the y axis represents the concentration of acquired resistance. (Q–T) Comparison of minimum inhibitory concentration (MIC) at day 10, day 20, and day 30 for each strain (WT, ΔrelA, ΔrpoS, ΔhipA, and ΔhipB) against amoxicillin (Q), enrofloxacin (R), kanamycin (S), and tetracycline (T) during the process of antibiotic resistance acquisition. Data are presented as means ± SD, statistical significance was determined using a one-way ANOVA, n ≥ 3, ∗p < 0.05, ∗∗p < 0.01.
During the early stages of exposure to amoxicillin, the resistance acquisition rate of the ΔrelA was lower than that of the WT strains (Figure 1A). At day 10 the MIC of the ΔrelA strain made resistant to amoxicillin was significantly lower than that of the WT (Figure 1Q). The final resistance concentrations of the ΔrelA were in two independent experiments 512 μg/mL and 1,024 μg/mL, respectively, versus 2,048 μg/mL for the wild-type strains (Figure 1A). Similar to the ΔrelA, the MIC of the ΔrpoS at day 30 was significantly lower than that of the wild-type strains (Figure 1Q). The maximum resistance concentration of one replicate of the ΔrpoS was 256 μg/mL, and both replicates reached their final resistance concentrations later than the WT-resistant strain (Figure 1E). There were no apparent differences observed in the development of amoxicillin resistance between the wild-type and ΔhipA strains (Figure 1I). Resistance development of ΔhipB progressed at a higher rate than that of the wild-type strains during the middle stages, but the final level equaled that of the wild-type (Figure 1M). The MIC of the ΔhipB at day 20 was higher than that of the WT strain (Figure 1Q).
During enrofloxacin exposure, clear differences between the strains could be observed after day 10 (Figures 1B–1F, 1J, and 1N). At day 20, the MIC of the ΔrelA-resistant strain and ΔrpoS-resistant strain were significantly lower than the WT-resistant strain, and all these strains exhibited lower MIC values compared to the ΔhipB-resistant strain (Figure 1R). The final resistance concentrations of ΔrelA and ΔrpoS were 8 μg/mL and 128 μg/mL, respectively, considerably lower than the wild-type strains’ concentration of 1,024 μg/mL (Figures 1B and 1F). One replicate of the ΔhipA ceased to grow at day 13, but the other one exhibited a similar resistance acquisition rate and MIC as the wild-type strains (Figures 1J and 1R). Similarly, resistance of one replicate of the ΔhipB stopped increasing at day 20 of 64 μg/mL. However, the other replicate showed a higher resistance acquisition rate than the wild-type strains, and its final resistance concentrations were double those of the WT-resistant strains (Figures 1N and 1R).
During kanamycin exposure, the rate of resistance acquisition and the MIC at days 10 and 20 were relatively consistent across all strains (Figures 1C–1G, 1K, 1O, and 1S). However, the maximum resistance concentrations of ΔrelA and ΔrpoS were both 1,024 μg/mL, which was half that observed in the WT-resistant strains (Figures 1C and 1G). The hipA knockout had no meaningful effect on the resistance development (Figure 1K). Remarkably, the ΔhipB reached kanamycin resistance concentrations of 2,048 μg/mL at day 20, which was faster than the wild-type strains (Figure 1O).
In the case of the bacteriostatic antibiotic tetracycline, the strains reached their final resistance concentrations at 32 μg/mL, which was low compared to the bactericidal antibiotics (Figures 1D–1H, 1L, and 1P). Additionally, the resistance acquisition rate, and MIC at day 10 or day 20 were all roughly the same in each strain (Figure 1T).
Mutations in stress response genes accompany antibiotic resistance
At the end of the antibiotic resistance evolution experiments, the genomic DNA of the final resistant strains was sequenced entirely to identify mutations that may influence development of resistance. The mutations that accompanied antibiotic resistance were clustered into different groups according to their functions as defined by the Comprehensive Antibiotic Resistance Database and UniProt (Tables 1, 2, 3, 4, and 5).20^,^21 The mutations that relate to metabolism or that are functionally unknown are given in the appendix (Table S1).Table 1. Mutations associated with resistance development after amoxicillin exposureFunctionsGenesWTΔrelA1ΔrelA2Δ*rpoS1ΔrpoS2ΔhipA_1ΔhipA_2ΔhipB_1ΔhipB_2Antibiotic inactivationampC* (promoter)a34_32dela73_72insAa38C>Aa70C>Ta38C>Aa70C>Ta30G>Ta77G>Ta81dupTa37G>Ca40C>Ga25C>Aa83dupAa38C>Ga75dupCa38delCa70C>Ta70C>Ta91T>AReduced permeabilityenvZA175VV241GI86SR397CI19delT15PA175EompCQ171stopD39fsY74stopD33fs10_91delD134dupQ258stopEfflux pumpsacrBS608LS135RF628LsoxRL149fscpxAQ202stop16_17insLA19_20 insVLML16_17delD162NTarget alterationftsIV545IA513SP311AV545ImrdAA586VrpoAS299YV257LL234duprpoB469_470 delinsGrpoCN341TrpoDD445AD445AD445VA444VOMPompXa98G>Aa99delTAntitoxinchpSdelToxinghoTL34SA37TA37GDNA protectiondpsa134C>AElongationtufAA183fsChaperoningroL540_541 insMGGRegulatorslyAG6fsSIMhfqN48KOMP, outer membrane protein; SIM, stress-induced mutagenesis.aUpstream mutation.Table 2. Copy numbers of gene amplification regions including ampC after amoxicillin exposureStrainsLength (kb)Copy numbers (times)Upstream geneDownstream geneWT2.617frdD**ecnBΔrelA111.518mscM**epmBΔrelA211.510mscM**epmBΔ*rpoS18316hflXphnIΔhipA_16715frdArpiBΔhipA_210.5116yjeMyjeJΔhipB_19100yjeNecnAΔhipB_28.5150frdA**yjeIIn the table, the size of the fragment, the amplification factor, and upstream and downstream of the genes contained in the fragment are listed for each strain tested.Table 3. Mutations associated with resistance development after enrofloxacin exposureFunctionsGenesWTΔrelA_1ΔrelA_2ΔrpoS1ΔrpoS_2ΔhipA_1ΔhipA_2ΔhipB_1ΔhipB_2Target alterationgyrAD87NS83LG81CS83LD87YS83LD87GS83AD82GD87YD87GS83LgyrBS464FS464FparCS80RS80ID79VK278MK278stopK277NS80IparEI437FE460KrpoAA230duprpsAN236dupEfflux pumpsacrRa30T>CQ78KF119fsR105fs43_45delQ78KE103fsE104fsacrAa95delTphoQE233delsoxRa25delAAD137GS128delR127delDNA repairdinGA29fsyoaAM554fs(p)ppGpp synthasespoT114_121 dupDNA protectiondpsM65ISOS stresssulAa22A>GElongationlepAN417YOxidative stressoxyRA213fsA288fsaUpstream mutation.Table 4. Mutations associated with resistance development after kanamycin exposureFunctionsGenesWTΔrelA_1ΔrelA_2ΔrpoS_1ΔrpoS_2ΔhipA_1ΔhipA_2ΔhipB_1ΔhipB_2Reduced permeabilitysbmAF6fsW53stopL21stopG256stop18_19 insT314_316 delV207fstrkHL80QEfflux pumpskdpD660_662 delD460VcpxAD245YTarget alterationpgsAV75EP6LfusAT393IT393IT393IR146CR59CP610LT393IP121RT393IrplFY157CrplL44_49dupV41EATP synthaseatpGK248fsQ240dupM244fs240_245 delatpBA267fsOligopeptide transportoppBW166fsS196PE199GL2fsoppDV203fsM70fsA221fsoppFQ202KV204del(p)ppGpp synthasespoTG315STable 5Mutations associated with resistance development after tetracycline exposureFunctionsGenesWTΔrelA_1ΔrelA_2ΔrpoS_1ΔrpoS_2ΔhipA_1ΔhipA_2ΔhipB_1ΔhipB_2Reduced permeabilityenvZ167_168 insMLLAIL88FompFQ225stopL240fsTarget protectionrpsJV57LV57LV57LV57LEfflux pumpsacrBQ569LM573IacrRS31Ya41delAS31Yrob246_247 delinsSmarRV84EmprA53_54insTTarget alterationrpoB30_31insPIrpoC215_220delrpoDT459AOMPmlaA44_45del44_45del44_45del44_45del(p)ppGpp synthasespoTG315SG315SAnti-sigma factorrseB*D171fsOMP, outer membrane protein.aUpstream mutation.
Amoxicillin-resistant strains displayed shared mutations within the ampC promoter region (Table 1). These mutations likely contribute to an upregulation in the levels of the β-lactamase AmpC.22^,^23 Additionally, all amoxicillin-resistant strains except the ΔrpoS_2 contained ampC amplification regions, varying in size and copy numbers, consistent with our previous findings (Table 2).24^,^25^,^26 Mutations in envZ and ompC, which encode the sensor histidine kinase EnvZ (OmpB) and outer membrane porin OmpC, respectively, were frequently observed.27 These mutations may result in reduced antibiotic entry into the cells.28 Occasional mutations were also observed in genes associated with efflux pumps or target alterations, albeit less frequently. Notably, a chpS deletion mutation was identified in one replicate of the ΔrelA strain, and an upstream mutation in the dps gene occurred in another replicate. The antitoxin coding gene chpS together with the toxin gene chpB belong to a type II toxin-antitoxin (TA) system, potentially involved in the regulation of cell growth.29 dps codes for a DNA protection protein for starvation response, it protects DNA against multiple stresses, including oxidative stress.30 Among the ΔhipA_2-resistant strain, three missense variations were found in the toxin coding gene ghoT. Together with the antitoxin gene ghoS, this type V TA system plays a role in limiting cell growth during antibacterial stress.31 In the ΔhipB_2-resistant strain, a mutation was observed in the hfq gene, which encodes an RNA-binding protein. Hfq is part of a gene network that facilitates stress-induced mutagenesis (SIM) in E. coli.32
Enrofloxacin targets DNA gyrase and topoisomerase IV thereby inhibiting bacterial DNA synthesis.33 The shared mutations occurring in the DNA gyrase subunit A coding gene, gyrA (Table 3), and located on the quinolone resistance-determining region (QRDR), result in reduced affinity for quinolones.34 Resistant strains of the WT, ΔhipA_1, and ΔhipB_2 acquired mutations in parC, gyrB, or parE, enhancing their resistance and enabling them to reach higher concentrations of enrofloxacin resistance compared to other strains (Figures 1J and 1N). Another resistance mechanism these strains evolved operated through efflux pumps that expel the antibiotic. The main mutated gene associated with this mechanism was acrR, which encodes the HTH-type transcriptional regulator AcrR, known as a repressor of the AcrAB-TolC multidrug efflux complex.35 In the WT-resistant strain, DNA repair-related DNA helicase coding genes dinG and yoaA were mutated.36^,^37 Interestingly, the (p)ppGpp synthase/hydrolase coding gene spoT exhibited a mutation in the ΔrelA_2, possibly activating the stringent response in these cells.38 The dps mutation found in the amoxicillin-resistant ΔrelA_2 appeared again but in a different position in the enrofloxacin-resistant strain ΔrpoS_1. In the ΔhipA_1 strain, a mutation occurred in the cell division inhibitor SulA, a component of the SOS system.39 Furthermore, two mutations were identified in the hydrogen peroxide-inducible gene activator coding gene oxyR in the ΔhipB_2 resistant strain, suggesting that the strain is under oxidative stress caused by ROS.40
The gene mutated in each of the kanamycin-resistant strains was fusA, with the predominant mutation being T393I (Table 4). The fusA gene encodes the elongation factor G, which plays a crucial role in ribosomal translocation during translation elongation.41 These mutations in fusA may contribute to the reduced binding efficiency of kanamycin. Another frequently mutated gene, sbmA, encodes an inner-membrane transport protein that in mutated form has been proven to impede the uptake of antimicrobial peptides.42^,^43 While the function remains unknown, mutations in the oligopeptide transport protein genes oppB, oppD, or oppF have been implicated in kanamycin resistance.44^,^45 Interestingly, a mutation in the bifunctional (p)ppGpp synthase/hydrolase spoT gene was also identified in the kanamycin-resistant strain ΔrelA_2.
There was no shared mutated gene observed among all tetracycline-resistant strains (Table 5). However, a V57L mutation in the ribosomal subunit coding gene rpsJ was observed in the WT, ΔrelA_2, ΔhipB_1, and ΔhipB_2 strains. This mutation may protect the antibiotic target. Furthermore, a 44_45del mutation within the outer membrane lipoprotein coding gene mlaA was observed in the ΔrelA and ΔhipA resistant strains. A G315S mutation in the spoT gene that codes for a key enzyme of the stringent response was observed both in the kanamycin-resistant strain ΔrelA_2 and in the tetracycline-resistant ΔrelA strains (Table 4). The tetracycline-resistant strains shared several common mutated genes compared to other antibiotic-resistant strains. Mutations in the envZ gene and the RNA polymerase subunit coding genes rpoBCD were observed under both amoxicillin and tetracycline treatment. These mutations may cause reduced antibiotic permeability, and alterations in antibiotic targets, respectively (Table 1). Mutations were also detected in the efflux pump regulator gene acrR and the multidrug efflux pump subunit coding gene acrB under tetracycline exposure, while an acrA mutation was identified during enrofloxacin treatment (Table 3). These findings suggest that these mutations may not be specific to a particular antibiotic.
Reduced oxidative stress and DNA damage in ΔrelA-resistant strains during exposure to bactericidal antibiotics
In these de novo antibiotic resistant strains, mutations were observed not only in genes directly associated with drug resistance but also in a variety of genes involved in regulating cellular stress responses (Tables 1, 2, 3, 4, and 5). These stress responses, including oxidative stress response, stringent response, and SOS stress response, have been documented in relation to the development of antibiotic resistance.5^,^15^,^46^,^47^,^48 To further investigate that notion, we performed RNA differential quantification on the ΔrelA-resistant strains that exhibited a slower evolution rate compared to the WT-resistant strains during bactericidal antibiotic treatment. (Figures 1A–1D). The differentially expressed genes associated with these stress responses were categorized according to the Gene Ontology Biological Process (GO-BP), with a log_2_ fold change cutoff of 2 applied to select the relevant genes (Figure 2A). Notably, a substantial proportion of the differentially expressed genes were related to the response to oxidative stress and DNA damage (Figure 2A). Therefore, we measured the ROS production levels and oxidation-mediated DNA damage characteristic 8-HOdG level in these strains (Figures 2B and 2C).Figure 2. Differential oxidative stress and DNA damage in ΔrelA resistant strains during bactericidal antibiotics exposure(A) Transcriptomic analysis of E. coli resistant WT and ΔrelA strains after antibiotics exposure, revealing the relative abundance of regulated genes. Functional cluster according to the Gene Ontology Biological Process (GO-BP) and based on log_2_ fold change values higher than 2 and lower than −2. The selected clusters refer to whole genome sequencing results and are depicted in the scale bar. The abundance shows the percentage of genes within each selected cluster relative to the total number of upregulated and downregulated genes with a log_2_ fold change cutoff higher than 2. ROS, reactive oxygen species; TCA, citric acid cycle; ETC, electron transport chain; AMO, amoxicillin-treated; ENR, enrofloxacin-treated; KAN, kanamycin-treated; TET, tetracycline-treated.(B) Assessment of ROS production levels in resistant E. coli WT and ΔrelA strains following exposure to maximum concentrations of each antibiotic. The Y axis represents the percentage of ROS-producing cells within each population. Data are presented as means ± SD. Statistical significance was determined using a one-way ANOVA, N = 3, ∗p < 0.05, ∗∗p < 0.01, ∗∗∗p < 0.001.(C) Evaluation of 8-HOdG production levels in resistant E. coli WT and ΔrelA strains after treatment with maximum antibiotic concentrations. The Y axis represents the 8-HOdG concentrations divided to DNA concentrations. Data are presented as means ± SD. Statistical significance was determined using a one-way ANOVA, N = 3, ∗p < 0.05, ∗∗p < 0.01, ∗∗∗p < 0.001. CON, untreated naive cells.(D) Growth rate of resistant E. coli WT and ΔrelA strains after treatment with maximum antibiotic concentrations. Data are presented as means ± SD. Statistical significance was determined using a one-way ANOVA, N = 3, ∗p < 0.05, ∗∗p < 0.01, ns, not significant. CON, naive cells without antibiotics.
Among all the ΔrelA and WT final resistant strains, the ROS production levels in cells exposed to bactericidal antibiotics were higher than in cells exposed to the bacteriostatic antibiotic tetracycline (Figure 2B). In addition, significantly lower ROS production levels were detected in the ΔrelA-resistant strains compared to WT-resistant strains under exposure to bactericidal antibiotics amoxicillin, enrofloxacin, and kanamycin (Figure 2B). Moreover, the 8-HOdG production level was significantly increased in the WT-resistant strains exposed to the maximum concentrations of bactericidal antibiotics compared to the untreated naive cells (Figure 2C). In the ΔrelA-resistant strains, enrofloxacin or kanamycin treatment caused clearly higher 8-HOdG production levels. Similar to the ROS production level, the 8-HOdG production level in ΔrelA-resistant strains was significantly lower than in WT-resistant strains under bactericidal antibiotics treatment.
We assumed that ROS levels decreased as a result of the growth rate reduction caused by the knockout of the (p)ppGpp synthesis gene, relA. This lower growth rate would lead to a decline in respiratory chain activity, subsequently resulting in reduced ROS production. To verify this hypothesis, we measured the growth rates of the WT and ΔrelA final resistant strains under maximum antibiotic concentrations (Figure 2D). There was no difference in growth rates between the WT and ΔrelA naive strains without antibiotic in the medium. However, the growth rate of the ΔrelA-resistant strains was significantly decreased compared to that of the WT-resistant strains when exposed to each antibiotic. In summary, our study findings indicate that the ΔrelA-resistant strains exhibit reduced DNA damage caused by ROS during exposure to bactericidal antibiotics, primarily due to the decreased growth rate induced by the relA knockout.
Knockout of relA resulted in decreased transcription levels of DNA repair genes during exposure to bactericidal antibiotics
In response to DNA damage, cells activate various mechanisms to detect and repair that damage. To identify the differentially expressed genes involved in DNA damage repair, we focused on the WT and ΔrelA-resistant strains under maximum concentrations of antibiotics (Figure 2A). The ΔrelA mutant was chosen for comparison with the WT as it lacks a key enzyme of the stringent response. Genes associated with DNA repair with a log_2_ fold change greater than 2 compared to untreated naive cells were selected and are represented in a heatmap (Figure 3).Figure 3. Gene transcription levels of DNA damage-repair-associated genesThe heatmap represents the log_2_ fold change values of gene expression, with blue color indicating upregulated genes and yellow color indicating downregulated genes. Genes associated with DNA damage-repair were selected based on a log_2_ fold change cutoff greater than 2 in any treatment group. The right column provides information on the regulated genes and their corresponding functions.
During amoxicillin treatment, both the WT and ΔrelA-resistant strains exhibited upregulation of sulA and recA, with similar expression levels. Transcription levels of lexA, recN, umuC, umuD, mutM, nudG, yebG, and tisB were upregulated in the WT but attenuated in the ΔrelA-resistant strain. Enrofloxacin treatment induced the highest number of differentially expressed genes, including sulA, recANX, umuCD, dinBDI, uvrA, yebG, tisB, symE, and yafNOP, and caused the highest upregulation levels in both the WT and ΔrelA-resistant strains. The transcription levels of recF, holD, mutM, vsr, and ycaQ were lower in the ΔrelA-resistant strain, while lexA exhibited higher expression compared to the WT during exposure to enrofloxacin. Kanamycin treatment resulted in minor differences between the WT and ΔrelA-resistant strains. Even so, the transcription level of lexA, sulA, recN, umuCD, and yebG were higher in the WT. Under tetracycline treatment, recF exhibited higher upregulation level in the WT compared to ΔrelA, whereas in yafNOP displayed the opposite trend. Other genes showed relatively similar expression levels between the two tetracycline-resistant strains.
Discussion
In this experimental design, the single gene knockout of relA or rpoS decelerated the acquisition of resistance upon exposure to bactericidal antibiotics. This slowdown may be attributed to the regulatory function of (p)ppGpp and the mutagenic effect of ROS (Figure 4). Under normal conditions without antibiotic exposure, the growth rate of the naive wild-type and ΔrelA cells was roughly the same (Figure 2D). Bacteria can intrinsically synthesize various amino acids even in a minimal medium, ensuring sufficient aminoacylated tRNAs for translation elongation and maintaining normal growth and reproductive functions (Figure 4A). Bacteria employ multiple strategies to respond to antibiotics, including the synthesis of enzymes to degrade antibiotics, reducing drug entry, increasing drug efflux, and enhancing target modification.49 This increased synthesis of corresponding proteins leads to higher levels of emerging deacylated tRNA. Binding of deacylated tRNAs to the A site of the ribosome leads to an interruption of the translation elongation process.50 However, RelA can recognize deacylated tRNAs bound to ribosomes and then synthesize (p)ppGpp, temporarily redirecting transcription from growth-related genes to genes involved in stress resistance and starvation survival.51^,^52 In addition, (p)ppGpp can also increase the amount of aminoacylated tRNAs through amino acid synthesis and proteolysis, thereby ensuring an effective bacterial antibiotic stress response.53 During exposure to bactericidal antibiotics, the drug-target interactions stimulate the acceleration of the electron transport chain, resulting in the formation of by-product ROS.17^,^54 ROS-induced DNA damage and cell repair will elevate the mutation rate, thereby creating a larger window of opportunity for beneficial mutations to arise, thus accelerating the formation of antimicrobial resistance during prolonged antibiotic exposure13^,^15^,^46 (Figure 4B). When the relA gene is knocked out, the absence of RelA-induced (p)ppGpp synthesis can lead to the persistence of deacylated tRNAs.55 Due to the hysteresis intrinsic synthesis of amino acids in minimal media, this reduces the cell’s ability to respond effectively to antibiotics, impairs its capacity to sustain growth, and weakens activity of the electron transport chain. Consequently, ROS production falls below a tipping point that is beneficial for increased non-lethal mutation rates, thus hindering drug resistance formation (Figure 4C).Figure 4. Model depicting the role of RelA synthesized (p)ppGpp on de novo acquisition of antibiotic resistance(A) Aminoacylated tRNA is provided to synthesize proteins during translation elongation to maintain normal growth and reproduction.(B) In response to antibiotics, cells synthesize additional proteins, which leads to insufficient aminoacylated tRNAs. Deacylated tRNAs binding to ribosome triggers (p)ppGpp to regulate amino acid synthesis, thereby reacting to antibiotics. Bactericidal antibiotics and the cell target interactions generate sub-lethal levels of ROS as a by-product through the accelerated operation of the ETC. Mutagenesis by ROS contributes to the development of drug resistance.(C) Knockout of relA results in sustained amino acid starvation. Cellular responses to antibiotics and production of ROS will be reduced. The development of drug resistance is slowed down.
As a global regulator, (p)ppGpp interacts with the DnaK repressor (DksA) by directly binding RNA polymerase and influencing the transcription of specific genes.56 In addition, (p)ppGpp modulates several sigma factors, such as the RNA polymerase sigma factor RpoS, which guides RNA polymerase transcription in response to specific stress conditions.52 RpoS serves as the master transcriptional regulator of the general stress response, being involved not only in starvation response but also in various other responses, including pH changes, oxidative stress, high temperature, and osmotic pressure.57 Importantly, RpoS promotes the generation of SIM, enabling cells to improve their environmental adaptability through evolution.58 Upon exposure to antibiotics, RpoS enhances the transcription of low-fidelity DNA polymerases in response to DNA damage.59 This increases the mutation rate during the repair process, potentially contributing to the formation of antimicrobial resistance.46^,^47 The resistance evolutions of the rpoS knockout strain were slower than that of the wild type, which aligns with the aforementioned theory (Figures 1E–1H). HipA and HipB belong to the type II TA system.11 HipA can phosphorylate the glutamate (Glu) tRNA ligase (GltX), which results in the accumulation of uncharged tRNA (Glu), subsequently triggering the synthesis of (p)pp(G)pp by RelA.60 HipB serves as a transcriptional repressor that counteracts the actions of HipA, thus inhibiting the formation of high-persister cells induced by HipA in response to antibiotics.12^,^61 The resistance acquisition rates of the wild-type and ΔhipA strains exhibited similar patterns (Figures 1I–1L). However, the resistance evolution rate of the ΔhipB strains was faster than that of the wild type upon exposure to bactericidal antibiotics (Figures 1M–1P). These observations suggest that the deletion of the hipA gene does not affect the acquisition of resistance, whereas the absence of hipB weakens the neutralization of HipA, and the subsequently induced (p)ppGpp appears to accelerate the development of antibiotic resistance. Upon phosphorylation of GltX by HipA, the accumulation of uncharged tRNAs leads to the upregulation of overall amino acid synthesis induced by (p)ppGpp, thereby enhancing the cells’ tolerance to antibiotics. This contrasts with the deceleration of resistance acquisition observed in the ΔrelA strains, yet ultimately underscores the correlation between (p)ppGpp and resistance acquisition.
Resistant cells exhibited common target-specific mutations in response to the three bactericidal antibiotics.13^,^26^,^44 For instance, mutations in the ampC gene were observed under amoxicillin treatment, gyrA gene mutations occurred under enrofloxacin treatment, and fusA gene mutations were detected under kanamycin treatment (Tables 1, 2, 3, and 4). Additionally, non-target-specific mutations in genes related to efflux pumps and antibiotic permeability reduction were also involved in the development of antibiotic resistance. Furthermore, certain genetic mutations not directly associated with antibiotic resistance drew our attention. For example, in ΔrelA-resistant strains, frequent mutations in the spoT gene strongly suggested that these strains were under stringent stress. These spoT gene mutations may serve as compensatory evolution to regulate the synthesis of (p)ppGpp.62 Moreover, dps mutations appeared in both ΔrelA and ΔrpoS resistant strains following amoxicillin or enrofloxacin exposure (Tables 1 and 3). This DNA protection during starvation protein, Dps, binds to the chromosome forming a DNA-protein crystal that protects DNA from oxidative damage.63^,^64^,^65 However, this in turn reduces the mutagenic responses by ROS-induced DNA damage repair. In contrast, the SIM coding gene hfq, SOS system coding gene sulA, and oxidative stress inducible gene oxyR found in ΔhipA and ΔhipB resistant strains predicted the emergence of damage-repair-inducing mutations.
The role of ROS as a secondary killing mechanism of bactericidal antibiotics has been elucidated in recent years.17^,^19^,^66 ROS-induced stress is involved in de novo antimicrobial resistance acquisition according to the principle of hormesis.67^,^68 Knockout of ROS-removing genes accelerated resistance development, whereas the ROS scavenger thiourea attenuated it.13 Similarly, in this study, we observed that the knockout of relA resulted in reduced ROS production in resistant strains, leading to decreased production of the signaling molecule 8-HOdG associated with ROS-induced damage (Figures 2B and 2C). As one of the possible oxidative base damages, 8-HOdG arises from guanine hydroxylation at the nucleotide pool or genomic DNA level.69 It induces guanine-to-thymine mutations during replication as it prefers to pair with adenine instead of cytosine.70^,^71 Bacteria engage several DNA repair genes through the SOS stress system to respond to the ROS-caused DNA damage. ROS-induced DNA oxidative damage is primarily repaired through the DNA base excision repair (BER) pathway.72 Formamidopyrimidine-DNA glycosylase MutM is involved in the BER of DNA damaged by oxidation, it recognizes lesions such as 8-HOdG or thymine glycol and removes them.73 We found that the transcription levels of mutM were lower in ΔrelA-resistant strains compared to WT-resistant strains after exposure to amoxicillin or enrofloxacin (Figure 3). Additionally, the error-prone DNA polymerase coding genes umuCD exhibited a lower transcription level in ΔrelA-resistant strains after exposure to amoxicillin or kanamycin. This low-fidelity polymerase V lacks intrinsic 3′–5′ exonuclease proofreading activity, and thus easily induces mutations during DNA repair.74 This appears to act as a protective mechanism by increasing the generation of resistance-associated mutations, which were reduced after the knockout of relA. Changes in the expression levels of genes related to DNA repair were found upon exposure to non-DNA-specific targeting antibiotics, such as amoxicillin and kanamycin. This observation further underscores that a shared mutagenic pathway is attributable to ROS.
Limitations of the study
Our research connects the stringent stress response together with the oxidative stress response, suggesting, but not decisively proving that RelA-synthesized (p)ppGpp plays a crucial role in antimicrobial resistance development by regulating bacterial growth rate and ROS formation. This study shows that although high levels of ROS are lethal, moderate levels of ROS enhance the rate of resistance acquisition by increasing damage-induced mutagenesis. Therefore, the principle of hormesis applies: high levels of stress caused by exposure to high concentrations of antibiotics are lethal, but low-level exposure induces resistance mutations, making the cell resistant, which is beneficial. The intracellular mechanism is inactive when the synthesis of (p)ppGpp is limited, the production of by-product ROS is reduced, ultimately slowing down the development of antibiotic resistance. These results suggest potential strategies to reduce resistance development, such as the design of (p)ppGpp inhibitor relacin and its analogs.75^,^76 However, the specific ROS level that reduces the development of resistance needs to be further elucidated.
STAR★Methods
Key resources table
REAGENT or RESOURCESOURCEIDENTIFIERBacterial and virus strainsE. coli K12 MG1655Lab collectionN/AE. coli K12 ΔrelACGSCJW2755E. coli K12 ΔrpoSCGSCBW28465E. coli K12 ΔhipACGSCJW1500-2E. coli K12 ΔhipBCGSCJW1501-1Chemicals, peptides, and recombinant proteinsSodium phosphate monobasic dihydrateSigma-Aldrich71500Potassium chlorideSigma-AldrichP5405Magnesium chloride hexahydrateSigma-AldrichM2393Ammonium chlorideSigma-AldrichA9434Sodium sulfateMerck1.06649Titriplex IMerck1.08416GlucoseSigma-AldrichD9434AmoxicillinSigma-AldrichA8523EnrofloxacinSigma-Aldrich17849KanamycinDuchefa BiochemieK0126TetracyclineSigma-AldrichT3258HPFInvitrogenH36004Critical commercial assaysDNeasy Blood & Tissue KitsQiagen69504NEBNext Ultra II FS DNA Library Prep KitNew England BioLabsE7805LNEBNext Multiplex OligosNew England BioLabsE7335LRNeasy Protect Bacteria KitQiagen74524NEBNext rRNA Depletion KitNew England BioLabsE7850LNEBNext Ultra II Directional RNA Library Prep KitNew England BioLabsE7760SDNA Damage Competitive ELISA KitInvitrogenEIADNADDeposited dataWhole gene sequencing raw dataThis studyBioProject PRJNA954686, PRJNA1019139, PRJNA1019238, PRJNA1019265, PRJNA1019295RNA-seq raw dataThis studyBioProject PRJNA988039,PRJNA1019310Recombinant DNApCP20Datsenko & Wanner77N/ASoftware and algorithmsImageJNIHhttps://imagej.nih.govPrism 9GraphPad softwarehttps://www.graphpad.com/Bowtie2Langmead & Salzberg78http://bowtie-bio.sourceforge.net/bowtie2/index.shtmlFreebayesGarrison & Marth79https://github.com/freebayes/freebayesLofreqWilm et al.80https://sourceforge.net/projects/lofreq/SnpeffCingolani et al.81https://pcingola.github.io/SnpEff/IGVRobinson et al.82https://igv.org/cn.MOPSKlambauer et al.83http://www.bioinf.jku.at/software/cnmops/HTSeqAnders et al.84https://pypi.org/project/HTSeq/DESeq2Love et al.85http://www.bioconductor.org/packages/release/bioc/html/DESeq2.htmlOtherNextSeq 550 SystemIlluminahttps://emea.illumina.com/systems/sequencing-platforms/nextseq.html
Resource availability
Lead contact
Further information and requests for resources and reagents should be directed to and will be fulfilled by the lead contact, Benno ter Kuile ([email protected]).
Materials availability
All antibiotic resistance strains generated in this study can be requested from the lead contact.
Data and code availability
- •The binary alignment/map (BAM) files of the whole gene sequencing and RNA sequencing raw data have been archived in the NCBI database and are available for access through the BioProject PRJNA954686 (WT), PRJNA1019139 (ΔrelA), PRJNA1019238 (ΔrpoS), PRJNA1019265 (ΔhipA), PRJNA1019295 (ΔhipB), and PRJNA988039 & PRJNA1019310 (RNAseq).
- •This paper does not report original code.
- •Any additional information required to reanalyze the data reported in this paper is available from the lead contact upon request.
Experimental model and subject details
Bacterial strains, growth media, and culture conditions
The antibiotic-sensitive single-gene-knockout E. coli K12 strains ΔrelA, ΔrpoS, ΔhipA, and ΔhipB, and the wild-type MG1655 were cultured in a phosphate buffered (100 mM NaH_2_PO_4_ · 2H_2_O) defined minimal Evans medium supplemented with 55mM glucose (pH 6.9).86 The kanamycin resistance cassette in knockout strains was substituted with temperature-sensitive pCP20 plasmid.77 The cultures were incubated in 10 mL tubes at a temperature of 37°C and constantly shaken at 200 rpm.
Method details
Evolution experiments and MIC determination
De novo resistance acquisition evolution experiments were executed following established protocols.87 In brief, a single clone of each strain was cultured in tube contained Evans medium overnight, and an appropriate volume of each culture was inoculated into a fresh medium resulting in an initial optical density (OD) at 600 nm of 0.1. Antibiotics were added to the respective cultures at a concentration of one-fourth of the MIC and incubated overnight. A control group without antibiotics was also maintained. If, on a subsequent day, the OD_600_ of the antibiotic-treated culture exceeded 75% of the antibiotic-free culture, a portion of this culture was transferred to a fresh medium at an OD_600_ of 0.1. The antibiotic concentration was then doubled and maintained in two separate tubes. On the third day, if the OD_600_ of the high-concentration antibiotic-treated culture surpassed 75% of the low-concentration antibiotic culture, a portion of the high-concentration culture was transferred to a fresh medium. Otherwise, the low-concentration antibiotic culture was chosen. This process continued with an incremental doubling of the antibiotic concentration until stable resistant strains were established. Cultures without antibiotics were continuously incubated daily throughout the evolution experiment as a control. Each strain's evolution experiment was independently replicated at least twice.
MIC testing was performed three times a week using a spectrophotometer plate reader (Thermo Fisher Scientific) to monitor resistance development. Cultures with an initial OD_600_ of 0.05 were incubated in 150 μL of medium within a 96-well plate. Antibiotic concentrations ranged from 0.5 to 2048 μg/mL, with two-fold increment steps. Following overnight incubation, the MIC was defined as the lowest concentration with a final OD_600_ below 0.2. MIC values at day 10, day 20, and day 30 for each strain against antibiotics were documented during the evolution experiments. Each biological replicate contains three technical replicates. The data were presented as means ± SD, statistical significance was determined using a one-way ANOVA, ∗p < 0.05, ∗∗p < 0.01.
Whole genome sequencing
Genomic DNA from each final resistant strain and its corresponding antibiotic-free strains was extracted using the DNeasy Blood and Tissue Kit (Qiagen). Subsequently, whole-genome sequencing was executed utilizing the NextSeq 550 next-generation sequencing system (Illumina). Sequencing analysis followed established protocols,13 encompassing the alignment of reads to reference genomes via Bowtie2. Variant calling utilized Freebayes and Lofreq, while Snpeff facilitated variant annotation. Shared mutations between resistant strains and their antibiotic-free strains were excluded. Specific single nucleotide polymorphisms (SNPs) and small insertions/deletions (indels) were documented. ampC amplification regions were identified through copy number analysis using cn.MOPS.83
RNA sequencing
Messenger RNA from the wild-type and ΔrelA resistant strains was extracted using the RNeasy Protect Bacteria Kit (Qiagen). The RNA sequencing and data analysis were according to the previous protocols.13 Similar to whole genome sequencing, reads were aligned to reference genomes using Bowtie2. To assess differential gene expression, normalized gene expression Log_2_ fold change values were calculated using HTSeq and DESeq2 by comparing resistant strains to antibiotic-free controls. Log_2_ fold change values greater than 2 in each treatment group were selected and clustered according to the Gene Ontology Biological Process (GO-BP). Clustered genes were summarized into relative abundance results based on whole genome sequencing results, and genes related to DNA repair were represented in a heat map.
ROS measurements
The fluorescent dye HPF (Sigma) was employed to quantify the level of ROS production.88 Strains treated with antibiotics were cultivated to the early-log-phase and subsequently inoculated 10 μM HPF into culture for 40 minutes. The detection of ROS-positive populations was conducted using the BD FACSAria™ III Sorter. Each high-resistant sample was independently replicated three times.
8-HOdG measurements
Measurement of the 8-HOdG level was carried out using the DNA Damage Competitive ELISA Kit, following established protocols.13 Briefly, experimental strains were grown to the early-log-phase and subsequently pelleted in 0.3 mL of lysis buffer (containing 10 mM Tris-HCl, 2 mM EDTA, 1% SDS). A five-fold dilution of each sample was loaded onto the antibody-coated 96-well plate, followed by incubation as recommended. The absorbance at OD_450_ was measured using a spectrophotometer plate reader (Thermo Fisher Scientific). A standard curve was constructed to determine the 8-HOdG level of each sample. DNA concentration was detected using a microvolume spectrophotometer (DeNovix) and utilized for normalization. Each measurement on high-resistant samples was independently replicated three times.
Growth rate measurements
The wild-type and ΔrelA final resistant strains were treated with the maximum concentrations of each antibiotic at which they could still grow and cultured overnight in a 96-well plate. Growth curves were generated using a spectrophotometer plate reader and absorbance was recorded at 10-minute intervals. Growth rates were calculated by the Growthrates-in-R (https://github.com/Pimutje/Growthrates-in-R/releases/tag/Growthrates). Measurements on each high-resistant sample were independently replicated three times.
Quantification and statistical analysis
Statistical analysis was performed using IBM SPSS statistical software. Details on the statistical methods employed for each experiment can be found in the figure legends and the corresponding methods.
The reference list from the paper itself. Each links out to its DOI / PubMed record.
- 1Smith W.P.J.Wucher B.R.Nadell C.D.Foster K.R.Bacterial defences: mechanisms, evolution and antimicrobial resistance Nat. Rev. Microbiol.21202351953410.1038/s 41579-023-00877-337095190 · doi ↗ · pubmed ↗
- 2Das B.Bhadra R.K.(p)pp Gpp Metabolism and Antimicrobial Resistance in Bacterial Pathogens Front. Microbiol.11202056394410.3389/FMICB.2020.563944 PMC 758186633162948 · doi ↗ · pubmed ↗
- 3Irving S.E.Choudhury N.R.Corrigan R.M.The stringent response and physiological roles of (pp)p Gpp in bacteria Nat. Rev. Microbiol.19202125627110.1038/s 41579-020-00470-y 33149273 · doi ↗ · pubmed ↗
- 4Munita J.M.Arias C.A.Mechanisms of Antibiotic Resistance Microbiol. Spectr.42016 VMBF-0016-201510.1128/MICROBIOLSPEC.VMBF-0016-2015 PMC 488880127227291 · doi ↗ · pubmed ↗
- 5Hobbs J.K.Boraston A.B.(p)pp Gpp and the Stringent Response: An Emerging Threat to Antibiotic Therapy ACS Infect. Dis.520191505151710.1021/acsinfecdis.9b 0020431287287 · doi ↗ · pubmed ↗
- 6Sinha A.K.Winther K.S.The Rel A hydrolase domain acts as a molecular switch for (p)pp Gpp synthesis Commun. Biol.4202143410.1038/S 42003-021-01963-Z 33790389 PMC 8012599 · doi ↗ · pubmed ↗
- 7Wright B.E.The effect of the stringent response on mutation rates in Escherichia coli K-12Mol. Microbiol.19199621321910.1046/J.1365-2958.1996.367892.X 8825767 · doi ↗ · pubmed ↗
- 8Wright B.E.Minnick M.F.Reversion rates in a leu B auxotroph of Escherichia coli K-12 correlate with pp Gpp levels during exponential growth Microbiology 143199784785410.1099/00221287-143-3-8479084168 · doi ↗ · pubmed ↗