Influence of initial misdiagnosis on mortality in patients with bacteraemia: propensity score matching and propensity score weighting analyses
Anna M. Eikenboom, Merel M. C. Lambregts, Mark G. J. de Boer, Saskia le Cessie

TL;DR
This study shows that misdiagnosing the source of infection in patients with bacteraemia significantly increases their 14-day mortality risk.
Contribution
The study uses propensity score methods to estimate the effect of initial misdiagnosis on mortality in bacteraemia patients.
Findings
Misdiagnosed patients had a 14.6% higher 14-day mortality rate compared to correctly diagnosed patients.
Propensity score reweighting estimated a 13.3% higher mortality risk for misdiagnosed patients.
Some patients had propensity scores near one, indicating a high likelihood of misdiagnosis.
Abstract
The diagnostic process is a key element of medicine but it is complex and prone to errors. Infectious diseases are one of the three categories of diseases in which diagnostic errors can be most harmful to patients. In this study we aimed to estimate the effect of initial misdiagnosis of the source of infection in patients with bacteraemia on 14 day mortality using propensity score methods to adjust for confounding. Data from a previously described longitudinal cohort of patients diagnosed with monobacterial bloodstream infection (BSI) at the Leiden University Medical Centre (LUMC) between 2013 and 2015 were used. Propensity score matching and inversed probability of treatment weighting (IPTW) were applied to correct for confounding. The average treatment effect on the treated (ATT), which in this study was the average effect of initial misdiagnosis on the misdiagnosed (AEMM), was…
Genes, proteins, chemicals, diseases, species, mutations and cell lines named across the full text — each resolved to its canonical identifier and authoritative record.
Click any figure to enlarge with its caption.
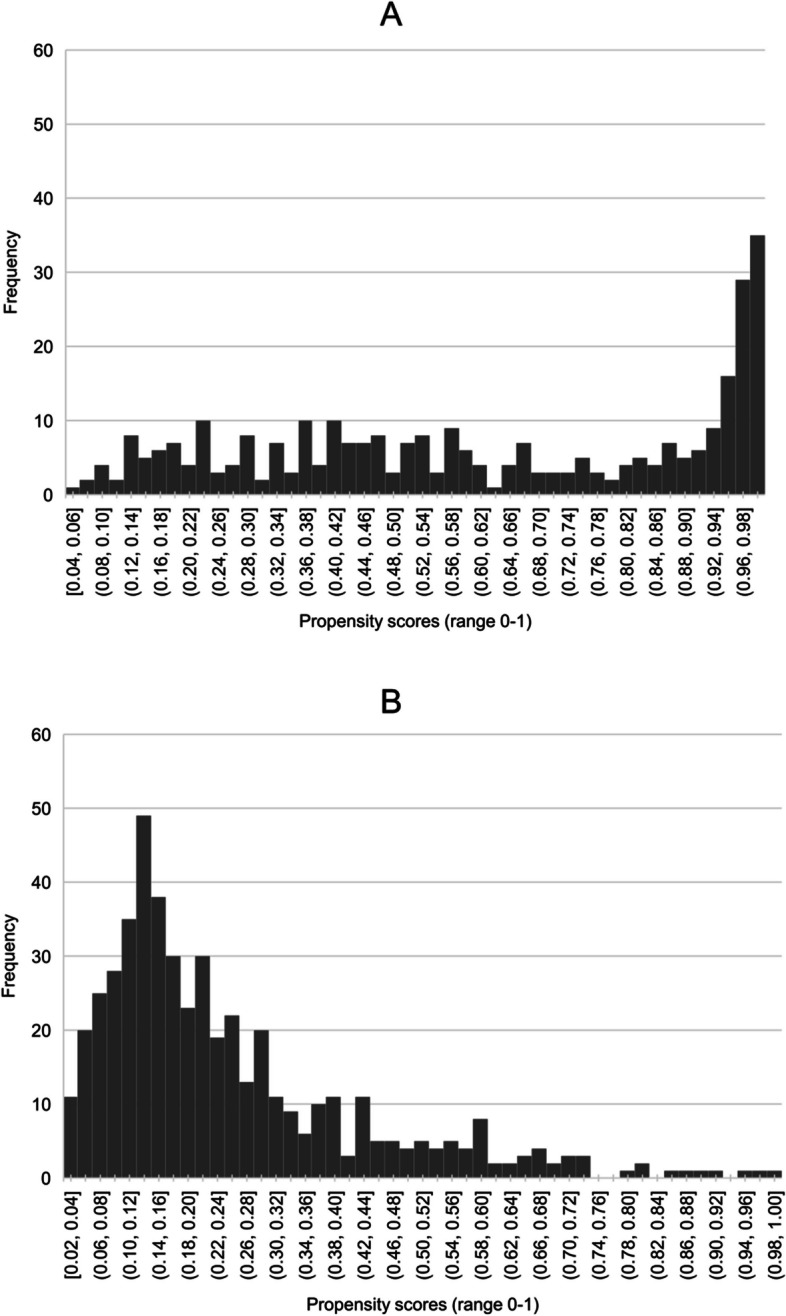 Figure 1
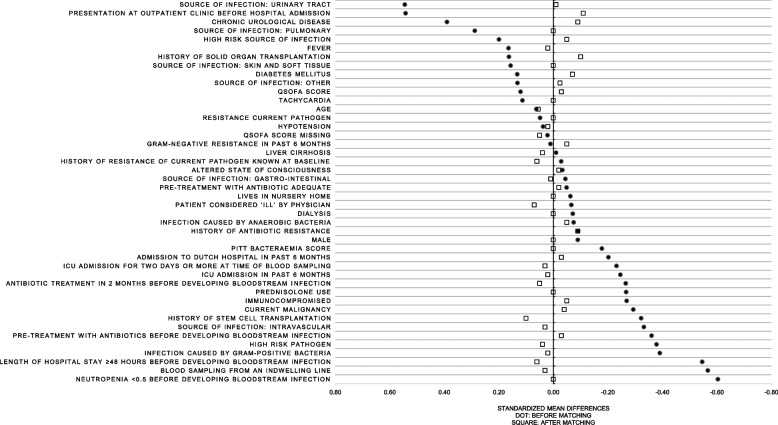 Figure 2
Peer Reviews
No public reviews on file for this paper yet. If you reviewed it on a platform where reviews are public (OpenReview, ICLR, NeurIPS, ICML), you can paste yours below so the community can read it here.
Videos
No videos yet. Explain this paper in a talk, walkthrough, or lecture? Add one.
Taxonomy
TopicsClinical Reasoning and Diagnostic Skills · Meta-analysis and systematic reviews · Reliability and Agreement in Measurement
Background
The diagnostic process is a key element of medicine but it is a complex process that is prone to errors. According to ‘Improving diagnosis in health care’ most people will experience misdiagnosis at least once in their life [1]. A previous study reported that the rate of disease-specific diagnostic errors ranged between 2.2 and 62.1% [2]. Infectious diseases are one of the three categories of diseases in which diagnostic errors can be most harmful to patients [3]. According to Abe et al. initial misdiagnosis of patients with infectious diseases was associated with an increase of in-hospital mortality of more than 10% [4].
However, investigating the relationship between initial misdiagnosis and mortality is challenging, as this relation can only be studied in observational data, where there is a high risk of confounding. The gold standard for investigating the effect of a treatment, or in this case a specific exposure, is a randomized controlled trial (RCT) [5]. For some interventions however- such as incorrect or correct diagnosis- it is impossible to conduct a RCT. Since it would be unethical to randomize the exposure ‘incorrect initial diagnosis’, a comparative observational study design is the only option. Propensity score methods, which have become increasingly popular over the past 15 years, can be applied to account for confounding [6–8]. However, these methods should be applied and reported carefully. In particular, the underlying assumptions of the propensity score methods should be likely to hold [9–13].
The aim of this study was to investigate the influence of initial misdiagnosis of the source of infection on 14 day mortality in a cohort of patients with bloodstream infection, using propensity score methods to address confounding.
Methods
Cohort description
Data from a previously described longitudinal cohort of patients diagnosed with monobacterial bloodstream infection (BSI) at the Leiden University Medical Centre (LUMC) between 2013 and 2015 were used [14]. Eligibility criteria of the current study were an episode of monobacterial BSI and an age of at least 18 years. Patients were excluded if all blood cultures were contaminated. All blood cultures with coagulase-negative staphylococci (CoNS) were classified as contaminated, because the probability of these cultures being contaminated is high [15, 16]. For other bacteria, the differentiation between contamination or true bacteraemia was made by the attending infectious diseases consultancy team at the time the blood culture results were reported. The infectious diseases consultancy team consisted of infectious diseases specialists and medical microbiologists. Standard empiric treatment for bacteraemia with unknown source of infection in the study centre was a second-generation cephalosporin, combined with gentamicin [14, 17].
Data collection
Clinical and demographic data were retrieved from electronic patient files [17]. Clinical data consisted of medical history, source of infection, treatment received for bloodstream infection, clinical parameters such as fever and blood pressure, and scores indicating severity of illness. Severity of illness was expressed in PITT bacteraemia score (PBS) and the quick sequential organ failure assessment (qSOFA) score [18, 19]. Data from blood cultures were retrieved from the database of the Department of Medical Microbiology of the LUMC.
Definition of exposure and outcomes
The exposure of interest was initial misdiagnosis. A patient was considered initially misdiagnosed if the suspected source of infection when a patient presented with fever did not match the final diagnosis of the source of infection or if the source of infection remained unidentified. The final diagnosis was made by the attending medical team after performing diagnostic tests such as blood sampling for cultures and imaging. Follow-up started at the day of blood sampling that resulted in a positive blood culture [17]. The outcome was 14 day mortality. Given that bloodstream infection is an acute condition it was expected that mortality related to initial misdiagnosis was most likely to occur within 2 weeks after diagnosis of bloodstream infection. A more long-term endpoint such as 30 day mortality would be more difficult to interpret because of competing causes of death [20, 21]. A short-term endpoint such as 7 day mortality would be too short to expect an effect of initial misdiagnosis on mortality.
Confounders
Potential confounders to include in the propensity score model were selected based on prior clinical knowledge [22, 23]. Therefore all variables that were present at baseline and that were thought to be related to the exposure (initial misdiagnosis) and the outcome (14 day mortality) or the outcome only were identified [24, 25]. When variables were very similar (for example temperature and fever) we used the variable which was clinically most relevant, to prevent multicollinearity issues. The variables blood sampling from indwelling line and qSOFA score had a substantial number of missing values. For blood sampling from indwelling line it was assumed that a missing value indicated that a patient did not have an indwelling line. In case of qSOFA, missingness was handled by adding an indicator variable for missingness to the propensity model, as the reasons for missingness were less obvious. Thereafter complete case analysis was used which will yield valid treatment effects when treatment heterogeneity is absent [26].
Baseline comparisons of exposure groups
Categorical variables were reported as numbers and percentages and continuous variables as means with standard deviations (SD) or medians with interquartile range (IQR), in case of skewed distributions. Demographic and clinical variables were compared between both exposure groups by calculating standardized mean differences (SMD).
Propensity score analysis
In propensity score analysis, the target of estimation (the estimand) should be clearly defined, as this determines how propensity score methods should be conducted [27]. In this study we aimed to estimate the absolute decrease in 14 day mortality risk if all patients currently being initially misdiagnosed would have been correctly diagnosed. This is often called the average treatment effect on the treated (ATT). This is a risk difference and can be expressed as a difference in percentage points. For the purpose of this study we refer to it as the average effect of initial misdiagnosis on the misdiagnosed (AEMM). We estimated the AEMM by matching each patient being initially misdiagnosed to a patient with correct diagnosis using propensity score matching and by inverse probability weighting using propensity scores. Logistic regression models, with incorrect initial diagnosis (yes/no) as dependent variable were used to estimate propensity scores. The variables identified as potential confounders were entered in the propensity score model. Using the estimated propensity score, patients who were initially misdiagnosed were matched to patients with a correct initial diagnosis using nearest neighbour matching with a caliper of 0.02 and ratio of 1:1 without replacement. Balance between the matched groups was checked by calculating standardized mean differences (SMD) of variables included in the propensity score model. A variable was considered to be well balanced between the groups if the SMD < 0.10.
The distributions of the propensity scores in both exposure groups were visualized to evaluate whether the positivity assumption was violated.
In both matched subgroups, the percentage of patients who died within 14 days was calculated, together with the difference between the two percentages. The 95% confidence interval around the difference was calculated using robust standard errors.
Inverse probability of treatment weighting (IPTW) was performed as an alternative analysis. The same propensity score model was used. Weights were adjusted to estimate an AEMM (or ATT). Weights were truncated at the 99th percentile, to prevent extremely large weights, which may be very influential in the analysis. The average treatment effect of initial misdiagnosis on the misdiagnosed was calculated in the weighted cohort. The analysis was repeated with adjustment for all variables which showed some disbalance (SMD ≥ 0.10) in the propensity score [28]. Confidence intervals were calculated using robust standard errors.
STATA16.1 was used for analyses. The PSmatch package was used to perform propensity score matching in STATA16.1.
Dealing with propensity scores close to 0 or 1 (non-positivity)
Additional sensitivity analyses were performed to gain insight in the influence of extreme propensity scores on the propensity score matching and weighting analyses. The additional analyses consisted of repeating the matching analysis varying the caliper and repeating the weighted analysis varying the cut-off values for truncation. Furthermore, clinical and demographic characteristics were compared between patients with propensity scores ≥0.95 and patients with propensity scores < 0.95 to explore which characteristics may be associated with an extremely high probability to get initially misdiagnosed.
Unmeasured confounding
As propensity score methods rely on the ‘no unmeasured confounding’ assumption, the e-value was estimated for the point estimate of the primary propensity score matching analysis and for the lower limit of the corresponding confidence interval. The e-value represents the minimum strength of association of an unmeasured confounder with both the exposure as well as the outcome on the risk ratio scale to fully explain the observed effect of the exposure. The e-value was estimated using the e-value calculator provided by Mathur et al. and Van der Weele et al. [29, 30].
The STrengthening the Reporting of Observational studies in Epidemiology (STROBE) guidelines were followed for reporting results [31].
Results
The database consisted of 893 patients with BSI. Six patients were excluded as data on whether or not first diagnosis was correct was missing. Thus, data of 887 patients were included in this study. A total of 341 patients (38.4%) received an incorrect first diagnosis. In total 95 (10.7%) patients died within 14 days; 65 (19.1%) of the patients who were initially misdiagnosed and 30 (5.5%) in the group of correctly diagnosed patients died within 14 days. Table 1 shows the demographic and clinical characteristics of the cohort. In Table 1 the variable high risk pathogen is included. In supplementary material S1 it is specified which bacteria were considered pathogens with a high risk of unfavourable clinical outcome [17]. Supplementary material S1 also includes a list of the causative pathogens that were included in the database. Table 1. Clinical and demographic characteristics at baselineFirst diagnosis incorrect (N = 341)First diagnosis correct (N = 546)Number of missing values^1^Standard mean difference (SMD)Median (IQR) or N (%)Median (IQR) or N (%)N (%)Age64 (54;72)66 (54;73)0.06Male213 (62.5)317 (58.1)−0.09Blood sampling from an indwelling line56 (16.4)12 (2.2)185 (20.9)−0.57Infection caused by anaerobic bacteria17 (5.0)19 (3.5)−0.07High risk pathogen209 (61.3)233 (42.7)−0.38Infection caused by gram-positive bacteria187 (54.8)195 (35.7)−0.39Presentation at outpatient clinic before hospital admission137 (40.2)362 (66.3)0.54Length of hospital stay ≥48 hours before developing bloodstream infection162 (47.5)122 (22.3)−0.55Pre-treatment with antibiotics before developing bloodstream infection135 (39.8)127 (23.3)3 (0.3)−0.36Pre-treatment with antibiotic adequate33 (9.7)45 (8.2)5 (0.6)−0.05Source of infection:• Urinary tract42 (12.3)189 (34.6)0.54• Gastro-intestinal98 (28.7)146 (26.7)−0.04• Pulmonary17 (5.0)72 (13.2)0.29• Intravascular66 (19.4)44 (8.1)−0.33• Skin and soft tissue18 (5.3)51 (9.3)0.16• Other15 (4.4)41 (7.5)0.13• Unknown82 (24.0)2 (0.4)− 0.77High risk source of infection156 (45.8)304 (55.7)0.20Antibiotic treatment in 2 months before developing bloodstream infection194 (58.3)238 (45.1)26 (2.9)−0.27History of antibiotic resistance57 (16.7)73 (13.4)19 (2.1)−0.09Infection caused by resistant gram-negative bacteria in past 6 months21 (6.2)35 (6.4)0.01ICU admission in past 6 months47 (13.8)35 (6.4)−0.25Admission to Dutch hospital in past 6 months188 (55.1)246 (45.1)−0.20Chronic urological disease23 (6.8)107 (19.9)13 (1.5)0.39Lives in nursery home14 (4.3)16 (3.1)38 (4.3)−0.06Immunocompromised209 (61.3)262 (48.0)−0.27Prednisolone use131 (38.4)142 (26.0)−0.27Diabetes mellitus60 (17.6)125 (22.9)0.13Neutropenia < 0.5 before developing bloodstream infection87 (25.5)26 (4.8)−0.60History of stem cell transplantation46 (13.5)24 (4.4)−0.32History of solid organ transplantation33 (9.7)82 (15.0)0.16Liver cirrhosis8 (2.3)12 (2.2)−0.01Current malignancy129 (37.8)133 (24.4)−0.29Dialysis10 (2.9)10 (1.8)2 (0.2)−0.07Fever187 (56.7)346 (64.7)22 (2.5)0.16Hypotension57 (16.7)99 (18.1)0.04Tachycardia170 (49.9)303 (55.5)0.11Altered state of consciousness (includes somnolence and confusion)56 (16.4)83 (15.2)−0.03Patient considered ‘ill’ by physician91 (26.7)130 (23.8)−0.07PITT bacteraemia score1 (0;2)1 (0;2)−0.18qSOFA score1 (0;2)1 (0;2)84 (9.5)0.12qSOFA score missing31 (9.1)53 (9.7)0.02Resistance current pathogen58 (17.0)103 (18.9)0.05History of resistance of current pathogen and history of resistance known at baseline21 (6.2)30 (5.5)1 (0.1)−0.03ICU admission for two days or more at time of blood sampling31 (9.01)19 (3.5)1 (0.1)−0.23ICU Intensive care unit, PITT score PITT bacteremia score, qSOFA score Quick sequential organ failure assessment score, SMD Standardized mean differenceMore details on the variables included in the propensity score model are presented in supplement S3^1^When nothing is reported there were no missing values
Building the propensity score model
The final propensity score model included the following variables: age in years, sex, blood sampling from indwelling line, infection caused by gram-positive bacteria, infection caused by anaerobic bacteria, infection caused by a high risk pathogen, presentation at outpatient clinic before hospital admission, length of hospital stay ≥48 hours before developing bloodstream infection (i.e. hospital acquired infection), intensive care unit (ICU) admission for 2 days or more at time of blood sampling (i.e. ICU acquired infection), pre-treatment with antibiotics before developing bloodstream infection, pre-treatment adequate, source of infection: urinary tract (yes/no), source of infection: gastro-intestinal, source of infection: pulmonary, source of infection: intravascular, source of infection: skin and soft tissue, other source of infection, source of infection with high risk of unfavourable clinical outcome, antibiotic treatment in 2 months before developing bloodstream infection, history of antibiotic resistance, infection by resistant gram-negative bacteria in past 6 months, ICU admission in past 6 months, admission to Dutch hospital in past 6 months, chronic urological disease, lives in nursery home, immunocompromised, prednisolone use, diabetes mellitus, neutropenia, history of stem cell transplantation, history of solid organ transplantation, liver cirrhosis, current malignancy, dialysis, fever, hypotension, tachycardia, altered state of consciousness, PITT bacteraemia score, qSOFA score, qSOFA missing value (yes/no), history of resistance of current pathogen and history of resistance known at baseline, resistance current pathogen and patient considered ‘ill’ by physician.
All identified potential confounders and the subset of variables used to prevent multicollinearity can be found in supplementary material S2A and S2B. The variable hospital admission abroad before admission for bloodstream infection was excluded from the propensity score model because only five patients had been admitted abroad and this variable predicted incorrect diagnosis perfectly. Additional explanatory notes on the variables included in the propensity score model are presented in the supplementary material S3.
For 806 patients (90.9%) the final propensity score was calculated, 81 patients with missing values in one of the variables of the model were excluded from further analyses. In supplementary material S2B missing data of all variables that were used to build the propensity score model are shown. Propensity scores ranged between 0.015 and 0.999 (Fig. 1). In total 27 patients (3.3%) had a propensity score below 0.05 and 80 patients (9.9%) had a propensity score > 0.95. Figure 1 shows that there was some degree of overlap in propensity scores between treatment groups.Fig. 1. Distribution of propensity scores for incorrect and correct initial diagnosis 1A. Distribution of propensity scores in patients who received incorrect initial diagnosis 1B. Distribution of propensity scores in patients who received correct initial diagnosis
Propensity score matching
Of 806 patients 171 misdiagnosed patients were matched to 171 correctly diagnosed patients. Propensity scores in the matched cohort ranged from 0.043 to 0.986. The distribution of baseline characteristics after matching is shown in Table 2. Nearly all standardized mean differences of variables included in the propensity score model were < 0.10 after matching. In Fig. 2 the standardized mean differences before and after matching are depicted. After matching some disbalance (SMD ≥ 0.10) was observed for presentation at outpatient clinic (SMD = 0.11), history of stem cell transplantation (0.10) and solid organ transplantation (0.10). Table 2. Clinical and demographic characteristics after matchingFirst diagnosis incorrect (N = 171)First diagnosis correct (N = 171)Standard mean difference (SMD)Median (IQR) or N (%)Median (IQR) or N (%)Age65 (54;74)67 (54;75)0.06Male107 (62.6)107 (62.6)0.00Blood sampling from an indwelling line8 (4.7)9 (5.3)0.03Infection caused by anaerobic bacteria11 (6.4)9 (5.3)−0.05High risk pathogen89 (52.1)92 (53.8)0.04Infection caused by gram-positive bacteria78 (45.6)80 (46.8)0.02Presentation at outpatient clinic before hospital admission92 (53.8)83 (48.5)− 0.11Length of hospital stay ≥48 hours before developing bloodstream infection56 (32.8)61 (35.7)0.06Pre-treatment with antibiotics before developing bloodstream infection50 (29.3)48 (28.1)−0.03Pre-treatment with antibiotic adequate15 (8.8)14 (8.2)−0.02Source of infection:• Urinary tract36 (21.1)35 (20.5)−0.01• Gastro-intestinal59 (34.5)60 (35.1)0.01• Pulmonary14 (8.2)14 (8.2)0.00• Intravascular34 (19.9)32 (18.7)0.03• Skin and soft tissue14 (8.2)14 (8.2)0.00• Other12 (7.0)11 (6.4)−0.02• Unknown4 (2.3)2 (1.2)−0.09High risk source of infection66 (38.6)62 (36.3)−0.05Antibiotic treatment in 2 months before developing bloodstream infection84 (49.1)88 (51.5)0.05History of antibiotic resistance21 (12.3)16 (9.4)−0.09Infection caused by resistant gram-negative bacteria in past 6 months10 (5.9)8 (4.7)−0.05ICU admission in past 6 months16 (9.4)17 (9.9)0.02Admission to Dutch hospital in past 6 months86 (50.3)83 (48.5)−0.03Chronic urological disease15 (8.8)11 (6.4)−0.09Lives in nursery home6 (3.5)6 (3.5)0.00Immunocompromised88 (51.5)84 (49.1)−0.05Prednisolone use51 (29.8)51 (29.8)0.00Diabetes mellitus35 (20.5)30 (17.5)−0.07Neutropenia < 0.5 before developing bloodstream infection22 (12.9)22 (12.9)0.00History of stem cell transplantation7 (4.1)11 (6.4)0.10History of solid organ transplantation20 (11.7)15 (8.8)−0.10Liver cirrhosis4 (2.3)5 (2.9)0.04Current malignancy59 (34.5)56 (32.8)−0.04Dialysis5 (2.9)5 (2.9)0.00Fever99 (57.9)101 (59.1)0.02Hypotension25 (14.6)26 (15.2)0.02Tachycardia89 (52.1)89 (52.1)0.00Altered state of consciousness (includes somnolence and confusion)24 (14.0)23 (13.5)−0.02Patient considered ‘ill’ by physician43 (25.2)48 (28.1)0.07PITT bacteraemia score1 (0;2)1 (0;2)0.00qSOFA score1 (0;2)1 (0;1)−0.03qSOFA score missing8 (4.7)10 (5.9)0.05Resistance current pathogen30 (17.5)30 (17.5)0.00History of resistance of current pathogen and history of resistance known at baseline7 (4.1)9 (5.3)0.06ICU admission for two days or more at time of blood sampling6 (3.5)7 (4.1)0.03ICU Intensive care unit, PITT score PITT bacteremia score, qSOFA score Quick sequential organ failure assessment score, SMD Standardized mean differenceMore details on the variables included in the propensity score model are presented in supplement S3Fig. 2Standardized mean differences before and after matching. QSOFA score: quick sequential organ failure assessment score
In Table 3 results of all matching and IPTW analyses are presented. Of the 171 misdiagnosed matched patients, 35 patients died (20.5%) while of the 171 correctly diagnosed patients 10 patients died (5.8%). This yielded an estimated effect of initial misdiagnosis on mortality of 14.6% (7.6%;21.6%). Table 3. Propensity score analysis of influence of initial misdiagnosis on 14 day mortalityType of analysisAEMM% (95%CI)AEMM% (95%CI) Double adjusted^2^N matched pairsMatching, caliper 0.0214.6 (7.6;21.6)Not applicable171 Additional^1^: Matching, caliper 0.213.5 (6.5;20.4)Not applicable171 Additional: Matching, caliper 0.513.5 (7.0;20.0)Not applicable192IPTW truncated (weights >99th percentile)13.3 (6.9;19.6)13.7 (7.4;19.9)Not applicable Additional: IPTW truncated (weights > 10)11.8 (3.0;20.6)12.3 (4.1;20.6)Not applicable Additional: IPTW untruncated−4.2 (−36.1;27.7)− 0.1 (−23.8;23.5)Not applicableAEMM Average effect of initial misdiagnosis on the misdiagnosed, CI Confidence interval, IPTW Inversed probability of treatment weighting^1^Additional analyses were performed after primary analyses to gain insight in the influence of extreme propensity scores on results^2^Results of IPTW adjusted for presentation at outpatient clinic before hospital admission, history of stem cell transplantation and history of solid organ transplantation in final outcome analysis
Propensity score weighting
Propensity score weights for the AEMM analysis ranged between 0.016 and 71. Three weights were larger than 10 respectively 15, 26 and 71, which were truncated to 4.2 (cut-off value for truncation at 99th percentile).
The observed percentage of patients with an initial misdiagnosis that died within 14 days was 19.8% while their estimated probability of dying would have been 6.5%, if they had been correctly diagnosed. This yielded an AEMM of 13.3% (6.9%; 19.6%). After adjustment for presentation at outpatient clinic before hospital admission, history of stem cell transplantation and history of solid organ transplantation an AEMM of 13.7% (7.4%; 19.9%) was estimated.
Propensity scores close to 0 or 1 (non-positivity)
As propensity scores close to 1 were observed, the matching analysis was repeated varying the caliper (Table 3) in the matched analyses. When caliper was widened to 0.2 a total of 171 initially misdiagnosed patients were matched to 171 correctly diagnosed patients. An AEMM of 13.5% (6.5%; 20.4%) was estimated. Matched analysis with caliper of 0.5 yielded 192 matched pairs and an AEMM of 13.5% (7.0%; 20.0%).
The IPTW analysis was repeated using varying truncation cut-off points. When the cut-off value for truncation was set on the absolute value of 10 the AEMM was 11.8% (3.0%; 20.6%) and 12.3% (4.1%; 20.6%) after double adjustment. Using the original weights, (not truncated) yielded unstable results with large 95% confidence intervals, AEMM: − 4.2% (− 36.1%; 27.7%).
Table 4 shows the distribution of clinical and demographic characteristics in patients with extremely high propensity scores (≥0.95) and patients with propensity scores < 0.95. Patients with propensity scores close to one were relatively frequently infected by a high risk pathogen and were more frequently infected by a gram-positive pathogen. They also had more frequently hospital acquired infection, had more frequently ICU acquired infection, had more often been admitted to an ICU in the past 6 months, had more frequently a malignancy, were more frequently immunocompromised or neutropenic, had more often a history of stem cell transplantation and were more frequently prednisolone users. Furthermore, in patients with extremely high propensity scores the source of infection remained unclear in most (87.5%) patients. Patients with propensity scores < 0.95 had more often a history of chronic urological disease and were more frequently admitted to the hospital from an outpatient clinic. Table 4. Clinical and demographic characteristics of patients with propensity scores of ≥0.95 versus < 0.95Propensity score 0.95 or higher (N = 80)Propensity score < 0.95 (N = 726)Standard mean difference (SMD)Median (IQR) or N (%)Median (IQR) or N (%)Age66 (56;74)66 (54;73)0.00Male55 (68.8)427 (58.8)−0.21Blood sampling from an indwelling line21 (26.3)43 (5.9)−0.57Infection caused by anaerobic bacteria2 (2.5)32 (4.4)0.10High risk pathogen59 (73.8)340 (46.8)−0.57Infection caused by gram-positive bacteria51 (63.8)291 (40.1)−0.49Presentation at outpatient clinic before hospital admission24 (30.0)438 (60.3)0.64Length of hospital stay ≥48 hours before developing bloodstream infection47 (58.8)202 (27.8)−0.65Pre-treatment with antibiotics before developing bloodstream infection35 (43.8)198 (27.3)−0.35Pre-treatment with antibiotic adequate8 (10.0)61 (8.4)−0.06Source of infection:• Urinary tract0214 (29.5)0.91• Gastro-intestinal3 (3.8)224 (30.9)0.77• Pulmonary081 (11.2)0.50• Intravascular7 (8.8)89 (12.3)0.11• Skin and soft tissue061 (8.4)0.43• Other044 (6.1)0.36• Unknown70 (87.5)9 (1.2)−3.48High risk source of infection70 (87.5)348 (47.9)−0.93Antibiotic treatment in 2 months before developing bloodstream infection46 (57.5)350 (48.2)−0.19History of antibiotic resistance17 (21.3)101 (13.9)−0.19Infection caused by resistant gram-negative bacteria in past 6 months7 (8.8)45 (6.2)−0.10ICU admission in past 6 months18 (22.5)54 (7.4)−0.43Admission to Dutch hospital in past 6 months45 (56.3)346 (47.7)−0.17Chronic urological disease1 (1.3)119 (16.4)0.55Lives in nursery home4 (5.0)25 (3.4)−0.08Immunocompromised52 (65.0)368 (50.7)−0.29Prednisolone use36 (45.0)202 (27.8)−0.36Diabetes mellitus12 (15.0)150 (20.7)0.15Neutropenia < 0.5 before developing bloodstream infection29 (36.3)75 (10.3)−0.64History of stem cell transplantation13 (16.3)45 (6.2)−0.32History of solid organ transplantation7 (8.8)99 (13.5)0.15Liver cirrhosis2 (2.5)15 (2.1)−0.03Current malignancy36 (45.0)206 (28.4)−0.35Dialysis2 (2.5)13 (1.8)−0.05Fever41 (51.3)455 (62.7)0.23Hypotension17 (21.3)125 (17.2)−0.10Tachycardia35 (43.8)382 (52.6)0.18Altered state of consciousness (includes somnolence and confusion)19 (23.8)107 (14.7)−0.23Patient considered ‘ill’ by physician19 (23.8)169 (23.3)−0.01PITT bacteraemia score1 (0;2)1 (0;2)−0.35qSOFA score1 (0;2)1 (0;2)−0.04qSOFA score missing8 (10.0)55 (7.6)−0.09Resistance current pathogen11 (13.8)136 (18.7)0.13History of resistance of current pathogen and history of resistance known at baseline9 (11.3)37 (5.1)−0.23ICU admission for two days or more at time of blood sampling10 (12.5)27 (3.7)−0.32ICU Intensive care unit, PITT score PITT bacteremia score, qSOFA score Quick sequential organ failure assessment score, SMD Standardized mean differenceMore details on the variables included in the propensity score model are presented in supplement S3
Unmeasured confounding
An e-value of 6.46 was estimated for the point estimate of the primary propensity score matching analysis and an e-value of 3.29 was estimated for the under bound of the corresponding 95% confidence interval.
Discussion
In this study the influence of initial misdiagnosis in patients who developed bloodstream infection on 14 day mortality was investigated using propensity score matching and weighting. We estimated that in patients who were initially misdiagnosed 14 day mortality was substantially higher (difference 14.6% matching and 13.7% weighting) than what the mortality risk would have been if these patients had been correctly diagnosed. Sensitivity analyses consisting of changing caliper and truncation of the weights did not substantially change the results. Performing weighted analyses without truncation yielded very unstable results.
Impact of misdiagnosis on mortality
In previous studies, infections, vascular events and cancers have been identified as the big three diseases that account for the majority of mortality and morbidity due to misdiagnosis [2]. In 2019 Abe et al. published an article on the effect of initial misdiagnosis of site of infection in patients with infection on in-hospital mortality [4]. Initial misdiagnosis occurred in 11.6% of patients, versus 38.4% in our population. It was reported that mortality was increased with > 10% in patients who were misdiagnosed at admission, which is a similar result to what was observed in this study. It would be rational to assume that the increased 14 day mortality in the group of misdiagnosed patients was due to delayed adequate antibiotic treatment. In several previous studies, it was observed that delayed adequate antibiotic treatment was associated with increased mortality [32, 33]. However, the association between delayed adequate antibiotic treatment and mortality can only be investigated in observational studies as it would be unethical to conduct a randomized controlled trial. Therefore, studies in which the effect of delayed appropriate antibiotic treatment on mortality is investigated are at risk for confounding. In 2020 Lambregts et al. investigated the effect of initial inadequate empirical treatment on 14 day mortality in the BSI cohort that was also used in this study, using propensity score matching and IPTW to adjust for confounding [17]. It was estimated that delayed adequate antibiotic treatment did not statistically significantly influence 14 day mortality. Thus, it seems that the influence of initial misdiagnosis on mortality can at least not entirely be explained by a delay of appropriate antibiotic treatment. An alternative partial explanation for increased mortality in initially misdiagnosed patients could be inadequate source control. For example, Tellor et al. showed that in patients with intra-abdominal sepsis and associated bacteraemia inadequate source control was a determinant for mortality, independent from inadequate antibiotic therapy [34].
Issues encountered in propensity score matching and propensity score weighting
In this study several patients received propensity scores extremely close to one, meaning that there was a group of patients that had an extremely high probability to be misdiagnosed. We explored which clinical and demographic variables were associated with extremely high propensity scores. In the group of patients with propensity scores extremely close to one we observed, among other things, more patients who had a malignancy, more patients who were immunocompromised, more recent ICU admissions, more hospital acquired bacteraemia and more infections caused by high risk pathogens. Moreover, most of the patients with extremely high propensity scores never received a correct diagnosis. In order to be able to identify high risk patients at admission in the future, it is important to take into account clinical and demographic characteristics that are associated with an extremely high probability to be initially misdiagnosed.
Furthermore, propensity scores close to one give rise to methodological issues. Patients with extreme propensity values are difficult to match. One could decide to make close matches (small caliper), leading to discarding a large part of the observations, including some of the mis-diagnosed patients with very high propensity values. In that case, a different effect is estimated: the average effect of initial misdiagnosis on the misdiagnosed which were matchable. Using less strict matches, may also result in biased estimate of the AEMM due to residual confounding. For inverse probability weighing, very high weights may occur. By varying truncation cut-off points in IPTW analyses we illustrated that including extremely large propensity scores weights yielded unstable results with a large variance. Using truncated weights reduced the variance substantial.
Strengths and limitations
A strength of this study is that propensity score matching and weighting were applied to adjust for confounding, which allowed us to balance possible confounders between the two exposure groups. Another strength of the study was that because two different propensity score methods were used and additional analyses were performed after propensity score matching and weighting, we gained better understanding of the influence of both propensity score methods on the results. Therefore we were able to draw conclusions more carefully.
A limitation of the study is that the analysed data were derived from a cohort study that was conducted between 2013 and 2015 because more recent data were not available. However, the standard empiric treatment of bloodstream infection of unknown origin between 2013 and 2015 consisted of a second-generation cephalosporin combined with gentamicin, which still is the standard empiric treatment in the study centre. Another limitation of this study is that 81 patients (9.1%) of the initial cohort were excluded from analyses due to missing values in variables included in the propensity score model. However, this percentage is relatively small and in none of the variables in the final propensity score model the percentage of missing values was larger than 5% except for qSOFA score. Furthermore, because several patients received a propensity score close to one, a certain degree of non-positivity existed. For propensity score matching this meant that many patients could not be matched. In this study 50.1% of patients who received incorrect first diagnosis were matched. In IPTW analyses all patients for whom a propensity score was calculated (90.9%) were used in analysis. Another limitation is that propensity score methods are based on the underlying assumption that there is no unmeasured confounding. It is impossible to be sure that there are no unmeasured confounders. However, the estimated e-value for the point estimate and for the under bound of the 95% CI for the matching analysis were large, meaning that unmeasured confounding had to be substantial to explain the increased mortality after initial misdiagnosis [30]. Furthermore, we are quite convinced that the most relevant possible confounders were included in the propensity score model, because the list of possible confounders was extensive and consisted of 94 variables.
Conclusions
From this propensity score matched and weighted study it can be concluded that an incorrect first diagnosis of site of infection in patients with BSI increased 14 day mortality with 14.6%. Initial misdiagnosis can therefore be seen as a marker of poor prognosis. Moreover, several patients received a propensity score extremely close to one, meaning that several patients were almost sure to be misdiagnosed. These results stress the importance of a correct initial diagnosis of the site of infection despite of the use of broad spectrum antibiotics as empirical therapy for BSI. To mitigate future mortality, it is imperative to develop strategies aimed at expediting and enhancing the diagnostic process, particularly in cases where the source of infection remains unknown. One potential intervention involves convening a multi-disciplinary consultation within 24 hours of hospital admission when the source of infection persists unclear, or adopting a lower threshold for diagnostic imaging, especially for patients with a markedly high likelihood of initial misdiagnosis. To avert misdiagnoses and consequent mortality in the future, a deeper understanding of patients with BSI that at baseline have an extremely high probability to be misdiagnosed is essential.
Supplementary Information
Supplementary Material 1.
The reference list from the paper itself. Each links out to its DOI / PubMed record.
- 1Committee on Diagnostic Error in Health C, Board on Health Care S, Institute of M Balogh EP Miller BT Ball JR The National Academies of sciences E, medicine Improving diagnosis in health care 2015 edn Washington (DC)National Academies Press (US)26803862 · pubmed ↗
- 2Newman-Toker DE Wang Z Zhu Y Nassery N Saber Tehrani AS Schaffer AC Yu-Moe CW Clemens GD Fanai M Siegal D Rate of diagnostic errors and serious misdiagnosis-related harms for major vascular events, infections, and cancers: toward a national incidence estimate using the "big three"Diagnosis (Berl)202181678410.1515/dx-2019-010432412440 · doi ↗ · pubmed ↗
- 3Singh H Schiff GD Graber ML Onakpoya I Thompson MJ The global burden of diagnostic errors in primary care BMJ Qual Saf 201726648449410.1136/bmjqs-2016-00540127530239 PMC 5502242 · doi ↗ · pubmed ↗
- 4Abe T Tokuda Y Shiraishi A Fujishima S Mayumi T Sugiyama T Deshpande GA Shiino Y Hifumi T Otomo Y In-hospital mortality associated with the misdiagnosis or unidentified site of infection at admission Crit Care 201923120210.1186/s 13054-019-2475-931171006 PMC 6551884 · doi ↗ · pubmed ↗
- 5Evans I Thornton H Chalmers I Glasziou P Testing treatments: better research for better healthcare 2011 edn London Pinter & Martin 22171402 · pubmed ↗
- 6Beal SJ Kupzyk KA An introduction to propensity scores: what, when, and how J Early Adolesc 2013341669210.1177/0272431613503215 · doi ↗
- 7Ventola CL: The antibiotic resistance crisis: part 1: causes and threats. P T 2015;40(4):277–283.PMC 437852125859123 · pubmed ↗
- 8Michael CA Dominey-Howes D Labbate M The antimicrobial resistance crisis: causes, consequences, and management Front Public Health 2014214510.3389/fpubh.2014.0014525279369 PMC 4165128 · doi ↗ · pubmed ↗