GEO dataset mining analysis reveals novel Staphylococcus aureus virulence gene regulatory networks and diagnostic targets in mice
Guangyu Xu, Yue Yang, Yan Lin, Yu Bai

TL;DR
This study identifies key genes and regulatory networks in Staphylococcus aureus infections in mice, offering new insights for diagnosis and treatment.
Contribution
The study reveals novel virulence gene regulatory networks and potential diagnostic targets in S. aureus infections.
Findings
Identified 437 virulence genes and 15 transcription factors in S. aureus regulatory networks.
Screened seven key network nodes and four transcription factors linked to immune and inflammatory responses.
Highlighted the TNF signaling pathway and cytokine activity as central to S. aureus pathogenesis.
Abstract
Staphylococcus (S.) aureus infection is a serious, worldwide health concern, particularly in many communities and hospitals. Understanding the S. aureus pathogenetic regulatory network will provide significant insights into diagnostic target screening to improve clinical treatment of diseases caused by S. aureus. We screened differentially expressed genes between normal mice and S. aureus-infected mice. We used the Gene Expression Omnibus (GEO) DataSets database for functional analysis (GO-analysis) and the DAVID and KEGG databases for signaling pathway analyses. We next integrated the gene and pathway analyses with Transcriptional Regulatory Element Database (TRED) to build an antimicrobial resistance gene regulatory network of S. aureus. We performed association analysis of network genes and diseases using DAVID online annotation tools. We identified a total of 437 virulence genes and…
Genes, proteins, chemicals, diseases, species, mutations and cell lines named across the full text — each resolved to its canonical identifier and authoritative record.
Click any figure to enlarge with its caption.
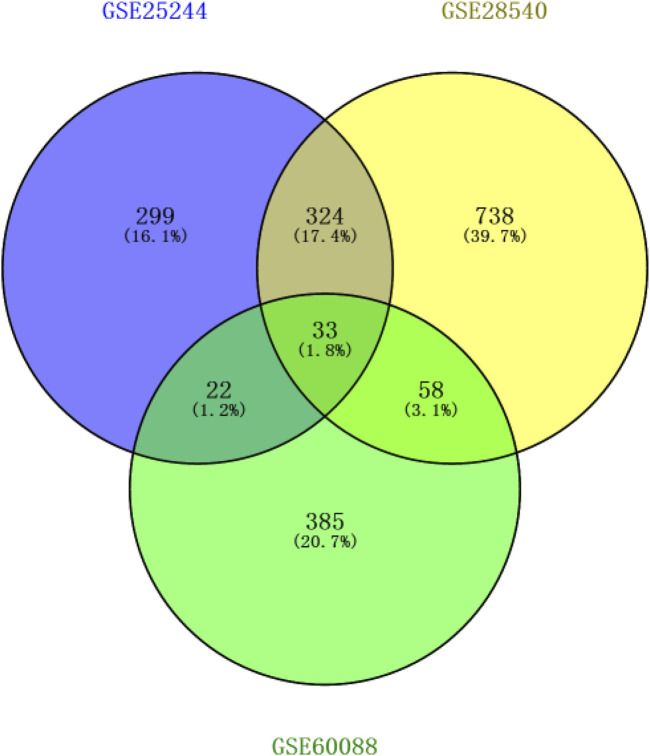 FIGURE 1
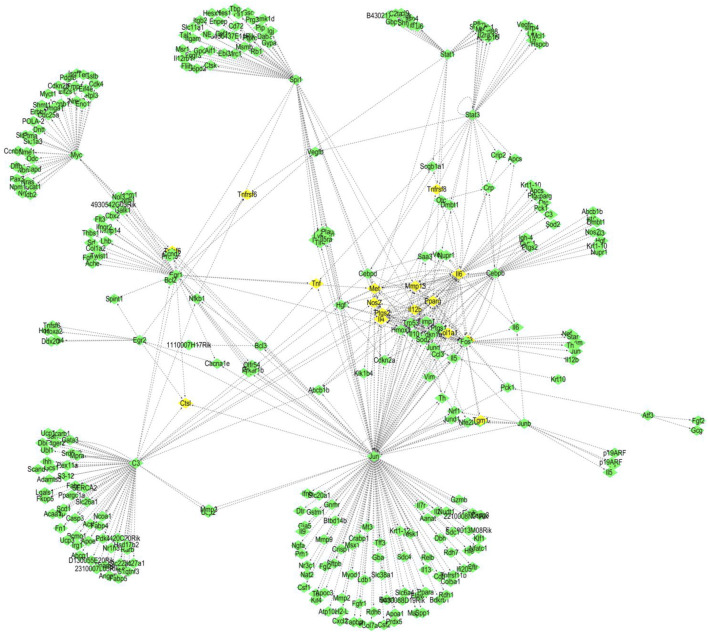 FIGURE 2
| Dataset ID | Sample ID | Sample number | Platforms | Organism | Organ | Manufacturer |
|---|---|---|---|---|---|---|
| 6 |
| kidney | Affymetrix | |||
| 10 |
| kidney | Affymetrix | |||
| 8 |
| kidney | Affymetrix | |||
| TF | Target gene NO. | Gene ID | Description |
|---|---|---|---|
| Jun | 120 | 16476 | jun proto-oncogene |
| C3 | 62 | 12266 | complement component 3 |
| Spi1 | 49 | 20375 | spleen focus forming virus (SFFV) proviral integration oncogene |
| Myc | 38 | 17869 | Myelocytomatosis oncogene |
| Egr1 | 31 | 13653 | early growth response 1 |
| Il6 | 30 | 16193 | interleukin 6 receptor, alpha |
| Stat3 | 26 | 20848 | signal transducer and activator of transcription 3 |
| Stat1 | 21 | 20846 | signal transducer and activator of transcription 1 |
| Cebpb | 20 | 12608 | CCAAT/enhancer binding protein (C/EBP), beta |
| Fos | 15 | 14281 | FBJ osteosarcoma oncogene |
| Junb | 11 | 16477 | jun B proto-oncogene |
| Egr2 | 9 | 13654 | early growth response 2 |
| Cebpd | 6 | 12609 | CCAAT/enhancer binding protein (C/EBP), delta |
| Atf3 | 3 | 11910 | activating transcription factor 3 |
| Bcl3 | 3 | 12051 | B cell leukemia/lymphoma 3 |
| Target genes regulated by TFs | TFs regulating target genes | Regulated TFs |
|---|---|---|
| Met | 5 | Cebpb, Egr1, Il6, Jun, Spi1 |
| Mmp13 | 4 | Cebpb, Il6, Jun, Spi1 |
| Il12b | 4 | Il6, Jun, Junb, Spi1 |
| Il4 | 4 | C3, Fos, Jun, Spi1 |
| Tnf | 4 | Bcl3, Egr1, Jun, Stat3 |
| Ptgs2 | 4 | C3, Cebpd, Jun, Spi1 |
| Ctsl | 4 | C3, Egr1, Egr2, Jun |
| Tgm1 | 3 | Fos, Jun, Junb |
| Col1a1 | 3 | Cebpb, Il6, Jun |
| Il6 | 3 | Fos, Cebpb, Junb |
| Tnfrsf8 | 3 | Jun, Stat1, Stat3 |
| Tnfrsf6 | 3 | Egr1, Egr2, Stat1 |
| Tnfsf6 | 3 | Egr1, Jun, Myc |
| Pparg | 3 | Cebpb, Cebpd, Stat1 |
| p53 | 3 | Cebpb, Il6, Jun |
| Nos2 | 3 | C3, Jun, Stat1 |
| Gene | Network node | TFs regulating target gene |
|---|---|---|
| Ptgs2 | 19 | 4 |
| Trp53 | 18 | |
| Mmp13 | 17 | 4 |
| Hmox1 | 17 | |
| Il4 | 16 | 4 |
| Pparg | 15 | 3 |
| Il12b | 14 | 4 |
| Timp1 | 14 | |
| Jund | 14 | |
| Met | 13 | 5 |
| Nos2 | 12 | 3 |
| Cdkn1a | 11 | |
| Il10 | 11 | |
| Ptgs1 | 11 |
| Pathway | Gene NO |
| Benjamin |
|---|---|---|---|
|
| 24 | 1.3E-21 | 2.7E-19 |
| Chemokine signaling pathway | 39 | 1.3E-19 | 1.4E-17 |
| TNF signaling pathway | 28 | 4.9E-17 | 3.5E-15 |
| Leishmaniasis | 22 | 3.2E-16 | 1.8E-14 |
| Rheumatoid arthritis | 23 | 7.8E-15 | 3.3E-13 |
| Tuberculosis | 30 | 3.3E-13 | 1.2E-11 |
| Phagosome | 27 | 6.0E-11 | 1.8E-9 |
| Pertussis | 18 | 1.5E-10 | 3.9E-9 |
| Osteoclast differentiation | 22 | 5.8E-10 | 1.4E-8 |
| Cytokine-cytokine receptor interaction | 30 | 1.4E-9 | 2.9E-8 |
Peer Reviews
No public reviews on file for this paper yet. If you reviewed it on a platform where reviews are public (OpenReview, ICLR, NeurIPS, ICML), you can paste yours below so the community can read it here.
Videos
No videos yet. Explain this paper in a talk, walkthrough, or lecture? Add one.
Taxonomy
TopicsAntimicrobial Resistance in Staphylococcus · Bioinformatics and Genomic Networks · NF-κB Signaling Pathways
1 Introduction
Infection caused by Staphylococcus (S.) aureus is an endemic health problem worldwide (Chen et al., 2022; Park et al., 2021; Miller et al., 2020). S. aureus is a common invasive bacterial pathogen that produces staphylococcal enterotoxin (SE), which causes intestinal tract dysfunction (Dicks et al., 2021; Omar et al., 2021) and is responsible for almost all staphylococcal food poisoning. Staphylococcal food poisoning results from food contamination by S. aureus enterotoxin, accounting for 33% of total bacterial foodborne infections in the United States (Haghi et al., 2021). More than 45% of foodborne diseases are caused by S. aureus in Canada (Greco et al., 2020). Therefore, S. aureus pathogenicity and its underlying virulence mechanisms have been a primary research focus. Staphylococcus aureus causes high mortality, which is associated with early excessive inflammation of unknown mechanisms (Wang et al., 2023). Staphylococcus aureus has a powerful virulence secretion system to evade the host’s immune response, and may even promote excessive inflammatory response (Mu et al., 2023); therefore, the host’s regulation of the immune response, especially the key mechanisms controlling inflammation, is crucial for successful resistance to Staphylococcus aureus.
A pathogenic gene permits a pathogen to cause disease (Kotnik et al., 2023). Understanding the role of virulence genes in disease has become a central focus of medical research for the purpose of developing preventive measures, diagnostic tools, treatment approaches, and therapeutic strategies (Jonas et al., 2020). Previous studies on S. aureus pathogenicity have been mainly focused on the expression and function of a single gene using gene knockout, gene silencing, RNA interference, and other genetic approaches (Kane et al., 2018; Scherr et al., 2015). However, these methods are typically laborious and time-consuming, inefficient, and require extensive training, leading to limited success in meeting the needs of clinical medicine. Advanced omics technologies, including gene chip and big data analytics (Giulieri et al., 2020) particularly CRISPR/CAS9 (Chen et al., 2017; Penewit et al., 2018), can simultaneously identify nearly one million sites in genomic DNA, which allows for association analysis between *S. aureus-*infected diseases and genetic variation. Thus, these technologies provide powerful tools to investigate pathogenic gene regulatory networks and diagnostic targets. However, scientists are challenged by the increasing amounts of transcriptomic data created by high-throughput techniques, including how best to handle and analyze the millions of data points identified by genetic studies of *S. aureus-*infected diseases with appropriate mathematical and statistical strategies.
The objective of this study was to identify novel S. aureus pathogenic gene regulatory networks and diagnostic targets using the NCBI GEO DataSets database and functional enrichment analysis. In the present study, the gene expression profiles of S. aureus-infected mice were selected from the NCBI GEO Datasets database to assess differentially expressed genes (DEG) using a combination of the linear models and empirical Bayesian methods in limma, an R software package (https://www.r-project.org/), with the traditional t-test. Gene function analysis (GO-analysis) and signal pathway analysis (Pathway-Analysis) were performed using DAVID (Database for Annotation, Visualization and Integrated Discovery) and KEGG (Kyoto Encyclopedia of Genes and Genomes) to select DEG sets that were integrated into TRED (Transcriptional Regulatory Element Database) to construct the S. aureus antimicrobial resistance gene regulatory network. Associations between a given disease and network genes were analyzed using the DAVID online annotation tool.
2 Experimental methods
2.1 Chip data
Chip data were pooled from the NCBI GEO DataSets database (https://www.ncbi.nlm.nih.gov/gds) using the keywords (Staphylococcus aureus) AND “Mus musculus” [porgn: txid9606], while data only from S aureus-infected mice and gene chips with Affymetrix CEL files were adopted (Davis et al., 2007).
2.2 Chip data processing
First, we performed background correction on the chip data, and then the probe fluorescence values were converted into gene expression values using the Expression Console™ software tool (Affymetrix, Santa Clara, California, United States) (www.affymetrix.com). The chip data were logged and normalized by Transcriptome Analysis Console (Affymetrix, Santa Clara, California, United States). Differentially expressed mRNAs were compared between the normal and S. aureus-infected mice using SAM (Significance Analysis of Microarray) (http://www-stat.stanford.edu/∼tibs/SAM/index.html). DEGs with fold change > 2.0 or fold change < −2.0 and a p-value < 0.05 were selected for further study. DEGs overlapping in two or more platforms were further screened with Venn diagrams to account for differences among the chip platforms (Lu et al., 2007).
2.3 Transcription factor (TF) and corresponding target gene screening
We first selected the “Search TF Target Genes” option in http://rulai.cshl.edu/TRED. Next, we selected Factor Name in the Type of search key option and entered the Gene symbol name. In the third step, we selected Mus musculus in Target Gene Organism and selected “all” at Promoter Quality and Binding Quality. At the final step, we searched for corresponding target genes (Zhao et al., 2005).
2.4 Gene co-expression network
We identified a total of 15 TFs and their predicted corresponding target genes. A total of 444 target genes were paired to analyze TF-to-target regulatory relationships. Differential co-expression correlations between gene pairs were estimated by differential co-expression analysis (DCEA) (Markus et al., 2017) and then mapped to mouse TF-to-target pairs to identify TF-gene transcriptional regulatory pairs that were visualized using Cytoscape software (Sun et al., 2017).
2.5 GO function annotation analysis
A set of 437 genes were submitted to the DAVID database (http://david.abcc.ncifcrf.gov/) for enrichment analysis (Huang et al., 2007) of DEG sets with the Functional Annotation Tool, where OFFICIAL_GENE_SYMBOL was selected and the whole genome of Mus musculus was used as the background genes.
2.6 Significance analysis of DEGs
DEGs were annotated based on the NCBI GO database (http://www.geneontology.org/). The significance level and misjudgment rate of each GO were estimated by Fisher’s exact test and chi-squared test (χ^2^), and the p-value was calibrated with the misjudgment rate to determine significance (p < 0.05) of GOs. The significant GOs (p < 0.05) were manually selected using the European Bioinformatics Institute (EBI) database (https://www.ebi.ac.uk/) (Ashburner et al., 2000).
3 Experimental results
3.1 Chip data
In the present study, chip data were pooled from the NCBI GEO DataSets database using both S aureus-infected mice and Affymetrix gene chips with CEL files as the selection criteria. Three platforms of gene chips were selected and the detailed information is listed in Table 1.
3.2 Chip data processing
After background correction of chip data, the probe fluorescence values were converted into gene expression values using the Expression Console™ software tool and then logged and normalized by Transcriptome Analysis Console. 299, 738, and 385 DEGs were respectively identified from the three platforms by SAM to compare differentially expressed miRNAs between the normal and S. aureus-infected mice. DEGs were then cross-screened; 33 DEGs overlapped in the three platforms, and 324, 22, and 58 DEGs co-existed in two platforms, respectively (Figure 1). Therefore, a total of 437 DEGs that overlapped in more than two platforms were used in subsequent analyses.
Screening results of genes overlapping in two or more platforms (blue circle represents GSE25244, yellow circle represents GSE28540, and green circle represents GSE60088).
3.3 TF regulatory networks
We used the TRED database to predict possible TFs for 437 DEGs. We identified 15 TFs and 444 corresponding target genes (Table 2). As shown in Figure 2, we visualized these TFs and genes using Cytoscape to develop S. aureus pathogenic gene TF regulatory networks. This analysis demonstrated that 16 target genes were co-regulated by at least three TFs (Table 3). Among these, me was regulated by five TFs, and mmp13, il12b, il4, tnf, ptgs2, and ctsl were regulated by four TFs.
TF regulatory networks of 15 S. aureus virulence genes (yellow represents TFs; green represents corresponding target proteins).
3.4 Analysis of network nodes in TF regulatory networks
As shown in Figure 2, we statistically recorded the network nodes in TF regulatory networks, finding 14 genes with more than 10 nodes. Among these genes, six (ptgs2, trp53, mmp13, hmox1, il4, and pparg) contained more than 15 nodes (Table 4). Met, ptgs2, and mmp13 were regulated by five, four, and four TFs, respectively, showing close association with S. aureus virulence genes.
3.5 Annotation analysis of GO functions of DEGs
437 DEGs were annotated for GO functions (http://www.geneontology.org/), from which the top 10 pathways with the highest p values were further analyzed (Table 5). Ten pathways were primarily associated with disease-related pathways, among which the S. aureus infection pathway ranked first.
4 Discussion
Staphylococcus aureus predominantly resides on the skin and in the nasopharynx of humans, and it is the most prevalent cause of nosocomial and community-acquired bloodstream infections, skin and soft tissue infections, and pneumonia in almost all geographic areas. Thus, S. aureus poses a serious threat to human health and global stability. Methicillin-resistant S. aureus is unresponsive to 60% of antibiotics (Mitevska et al., 2021; Paudel et al., 2021), which is a major underlying cause of several difficult-to-treat life-threatening infections. Therefore, there is an unmet need to understand S. aureus pathogenesis to develop effective prevention and treatment of infection. In the present study, we identified 437 DEGs, from which 15 TFs and their predicted corresponding target genes were used to develop a TF regulatory network. We found several key factors closely related to inflammation and the immune system that are regulated by S. aureus TF regulatory networks. Our findings provide new information and reference values for virulence genes in the transcriptional regulation of S. aureus infection.
We hypothesized that inflammatory and immune system diseases caused by S. aureus are likely regulated by three genes: jun, c3, and spil. Staphylococcus aureus is the most common pathogen that causes inflammatory and immune system diseases, including a variety of suppurative (pus-forming) infections (Carrel et al., 2017), pneumonia, pseudomembranous colitis, pericarditis, and even sepsis (Agarwal et al., 2018). Jun, c3, and spi1 are believed to be involved in inflammation and immune responses. Jun has been reported to inhibit inflammatory factors and participate in immune system regulation, which is supported by Xie et al. (2014) who showed that downregulation of jun decreased expression of pro-inflammatory cytokines such as tumor necrosis factor-α (TNF-α), interferon β (IFN-β), and interleukin 6 (IL-6), but upregulated expression of anti-inflammatory cytokines, including IL-10. Jun is also closely associated with systemic lupus erythematosus (SLE), an autoimmune disease involving multiple organs and systems (Maria et al., 2017). Doníz et al. (2011) reported that jun expression was significantly elevated in peripheral blood mononuclear cells (PBMC) in SLE patients compared to normal controls. C3, the most important molecule encoded by gene c3 in the complement system (Lu et al., 2018), is located at the intersection node of both classical and alternative complement activation pathways, as well as the mannose-binding lectin pathway, indicating that C3 plays an important regulatory role in the complement system, inflammation, and the immune system (Yuan et al., 2024). The complex and diverse C3 cleavage fragments and their binding proteins regulate the complement system via activating the complement cascade and through self-activation and cleavage, as well as by interacting with a variety of relevant factors that promote immune adhesion and pathogen phagocytosis (Fagan et al., 2017). Spi1 affects the immune system by regulating mature B cells in the spleen (Batista et al., 2017). In the present study, we first reported that jun (corresponding to 120 target genes), c3 (corresponding to 62 target genes), and spi1 (corresponding to 49 target genes) regulated most of the target genes, strengthening our hypothesis that jun, c3 and spi1 regulate inflammation and the immune system.
We further revealed that jun and spil are core genes in the S. aureus regulatory network, while c3 plus il6 are secondary core genes. Regulation of core genes in inflammation and immune system diseases is executed mainly by regulating target genes met, mmp13, il12b, il4, tnf, ptgs2, and ctsl. In the present study, we found that all of these genes were regulated by at least four TFs (Figure 2). Met, mmp13, il12b, il4, and ptgs2 were regulated by jun and spil. Met, mmp13, and il12b were simultaneously regulated by il6. Ctsl, ptgs2, and il4 were regulated by jun and c3. In addition to jun, c3, and spil, il6 was has been shown to be involved in inflammatory and immune system diseases, where il6 acted not only as a TF but also as a target gene regulated by a TF. A previous study revealed a close association of il6 with the immune system (Leal et al., 1999) by activating proinflammatory and other cytokines in B cells, hepatocytes, hybridoma cells, and plasma cells to improve the body’s resistance to S. aureus infection. However, it has also been reported that il6 inhibits the adverse effects of macrophages to IFN-γ responsiveness (Saleh et al., 2021). Met, mmp13, and ctsl are all related to cancer (Mo et al., 2017; Yang et al., 2017; Zhang et al., 2016). Further analysis should focus on understanding the molecular mechanism of the core genes that interact with TFs and their corresponding target genes in inflammation and the immune system (Gao et al., 2024).
This study provides evidence that immune functions, including immune response, cellular response to lipopolysaccharide, and the inflammatory response, are regulated by network nodes that contain ptgs2, mmp13, il12b, and met, together with TF jun. In the present study, we identified 14 genes in 10 nodes, of which only four genes (ptgs2, mmp13, il12b, and met) were regulated by four TFs (Table 4). In addition to met, which was regulated by most TFs, ptgs2, mmp13, and il12b significantly regulated TFs and network nodes. All network nodes were compared to previous studies (Kondo et al., 2000; Yamaguchi et al., 2005; Gokulnath et al., 2017; Utsugi et al., 2010; Cui et al., 2013) and we found that most of the network nodes were related on a certain level and strongly correlated with TF jun. The main GO terms of these network nodes are cytokine activity and growth factor activity, functioning immune response, cellular response to lipopolysaccharide, and inflammatory response. In addition, the most significant 10 pathways were associated with immune-related diseases, including S. aureus infection (Dusane et al., 2018), leishmaniasis (Jaton et al., 2016; Cui et al., 2017), rheumatoid arthritis (Insa et al., 2017), and tuberculosis (Ashtekar et al., 2016); however, immune-related TFs and information pathways, including the chemokine signaling (Joanna et al., 2017) and TNF signaling (Nandi et al., 2017) pathways, were closely associated with other diseases. Therefore, in general, these diseases and pathways were associated with immune function.
5 Conclusion
We successfully identified 437 DEGs from the GEO database to develop a TF regulatory network of S. aureus. We analyzed the genes met, mmp13, il12b, il4, tnf, ptgs2 and ctsl and transcription factors Jun, C3, Spil and il6 pathways, and found that most of these genes were on the TNF signaling pathway. At last, we hypothesized that met, mmp13, il12b, il4, tnf, and ptgs2 function together with TFs jun, c3, spil, and il6 to regulate inflammation and the immune system. The present study thus provides information and reference values for understanding the regulatory mechanisms of TFs and their network of S. aureus virulence genes.
The reference list from the paper itself. Each links out to its DOI / PubMed record.
- 1Agarwal R.Bartsch S. M.Kelly B. J.Prewitt M.Liu Y.Chen Y. (2018). Newer glycopeptide antibiotics for treatment of complicated skin and soft tissue infections: systematic review, network meta-analysis and cost analysis. Clin. Microbiol. Infect. 24, 361–368. 10.1016/j.cmi.2017.08.028 28882727 PMC 5925741 · doi ↗ · pubmed ↗
- 2Ashburner M.Ball C. A.Blake J. A.Botstein D.Butler H.Cherry J. M. (2000). Gene ontology: tool for the unification of biology. The Gene Ontology Consortium. Nat. Genet. 25, 25–29. 10.1038/75556 10802651 PMC 3037419 · doi ↗ · pubmed ↗
- 3Ashtekar R.Shah I. (2016). Tuberculosis in a case of hyper immunoglobulin Esyndrome. J. Fam. Med. Prim. Care 5, 871–872. 10.4103/2249-4863.201167 PMC 535383328349010 · doi ↗ · pubmed ↗
- 4Batista C. R.Li S. K. H.Xu L. S.Solomon L. A.De Kote R. P. (2017). PU.1 regulates ig light chain transcription and rearrangement in pre-B cells during B cell development. J. Immunol. 198, 1565–1574. 10.4049/jimmunol.1601709 28062693 · doi ↗ · pubmed ↗
- 5Carrel M.Zhao C.Thapaliya D.Bitterman P.Kates A. E.Hanson B. M. (2017). Assessing the potential for raw meat to influence human colonization with Staphylococcus aureus . Sci. Rep. 7, 10848. 10.1038/s 41598-017-11423-6 28883621 PMC 5589955 · doi ↗ · pubmed ↗
- 6Chen H. Q.Zhang J. Y.He Y.Lv Z. Y.Liang Z. T.Chen J. Z. (2022). Exploring the role of Staphylococcus aureus in inflammatory diseases. Toxins (Basel) 14, 464–474. 10.3390/toxins 14070464 35878202 PMC 9318596 · doi ↗ · pubmed ↗
- 7Chen W.Zhang Y.Yeo W. S.Bae T.Ji Q. (2017). Rapid and efficient genome editing in Staphylococcus aureus by using an engineered CRISPR/Cas 9 system. J. Am. Chem. Soc. 139, 3790–3795. 10.1021/jacs.6b 13317 28218837 · doi ↗ · pubmed ↗
- 8Cui G. H.Chen S. Y.Jiang B.Zhang Y.Qiu N. N.Satoh T. (2013). Synthesis and characterization of novel thermoresponsive fluorescence complexes based on copolymers with rare earth ions. Opt. Mater. 35 (12), 2250–2256. 10.1016/j.optmat.2013.06.010 · doi ↗