Livestock and environmental characterization of Colombian municipalities: study of vesicular stomatitis
Daniel Magalhães Lima, Diana Carolina Linares Chaparro, Viviana Marcela Mendez Mancera, Jenny Andrea Vela Merchán, Ana Clara Kohara Roman, Lia Puppim Buzanovsky, Ottorino Cosivi, Manuel José Sanchez-Vazquez

TL;DR
This study uses environmental and livestock data to understand the spread of vesicular stomatitis in Colombian municipalities.
Contribution
A novel approach combining PCA and clustering to characterize municipalities and assess VS risk in Colombia.
Findings
Four distinct municipal clusters were identified based on environmental and livestock data.
The 'Andino' cluster showed the highest risk for vesicular stomatitis occurrence.
The methodology improves disease surveillance and control strategies in animal health.
Abstract
Amid the surge in data volume generated across various fields of knowledge, there is an increasing necessity for advanced analytical methodologies to effectively process and utilize this information. Particularly in the field of animal health, this approach is pivotal for enhancing disease understanding, surveillance, and management. The main objective of the study was to conduct a comprehensive livestock and environmental characterization of Colombian municipalities and examine their relationship with the distribution of vesicular stomatitis (VS). Utilizing satellite imagery to delineate climatic and land use profiles, along with data from the Colombian Agricultural Institute (ICA) concerning animal populations and their movements, the research employed Principal Component Analysis (PCA) to explore the correlation between environmental and livestock-related variables. Additionally,…
Genes, proteins, chemicals, diseases, species, mutations and cell lines named across the full text — each resolved to its canonical identifier and authoritative record.
Click any figure to enlarge with its caption.
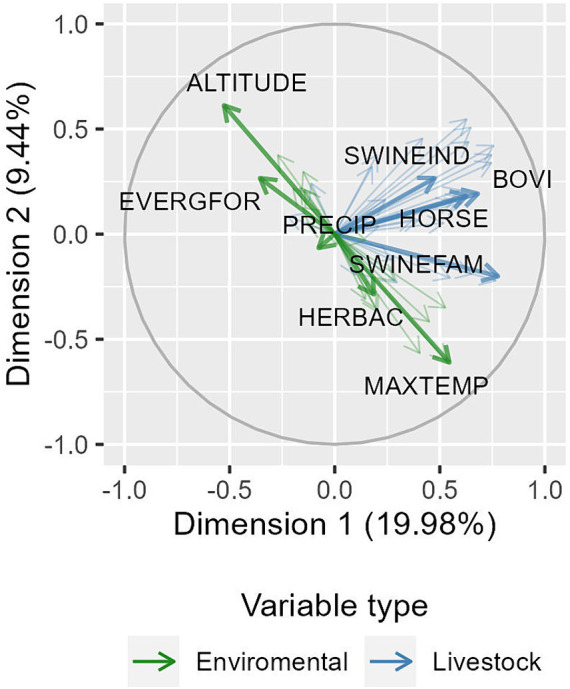 Figure 1
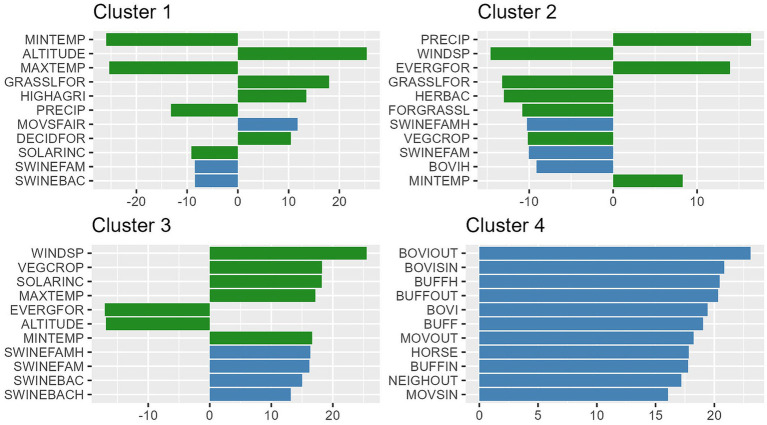 Figure 2
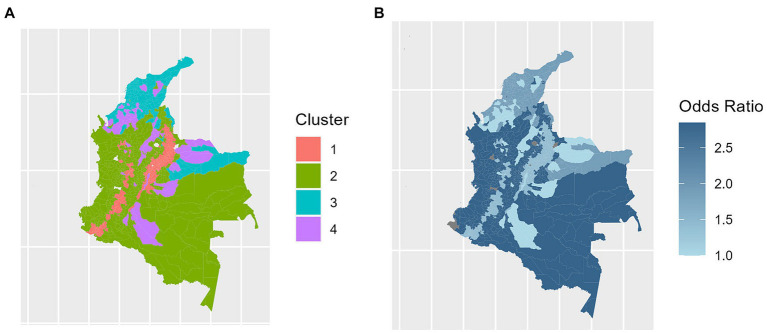 Figure 3
| Variable | Abbreviation | Unit | Time frame | Source |
|---|---|---|---|---|
| Altitude | ALTITUDE | meters | 2010–2018 | WorldClim ( |
| Minimum temperature | MINTEMP | °C | 2010–2018 | WorldClim ( |
| Maximum temperature | MAXTEMP | °C | 2010–2018 | WorldClim ( |
| Precipitation | PRECIP | mm/ | 2010–2018 | WorldClim ( |
| Solar incidence | SOLARINC | kJ m-2 day-1 | 2010–2018 | WorldClim ( |
| Wind speed | WINDSP | m s-1 | 2010–2018 | WorldClim ( |
| Highlands agriculture | HIGHAGRI | % of terrain | 2009 | ESA ( |
| Dry tropics agriculture | DRYAGRI | % of terrain | 2009 | ESA ( |
| Umid tropics agriculture | UMIDAGRI | % of terrain | 2009 | ESA ( |
| Water bodies | WATER | % of terrain | 2009 | ESA ( |
| Rainfed croplands | RAINFCROP | % of terrain | 2009 | ESA ( |
| Bare areas | BARE | % of terrain | 2009 | ESA ( |
| Forest regularly flooded | FLOODFOR | % of terrain | 2009 | ESA ( |
| Deciduos forest | DECIDFOR | % of terrain | 2009 | ESA ( |
| Evergreen forest | EVERGFOR | % of terrain | 2009 | ESA ( |
| Herbaceous vegetation | HERBAC | % of terrain | 2009 | ESA ( |
| Shurbland | SHURBL | % of terrain | 2009 | ESA ( |
| Mosaic Cropland/Vegetation | CROPLVEG | % of terrain | 2009 | ESA ( |
| Mosaic Forest/Grassland | GRASSLFOR | % of terrain | 2009 | ESA ( |
| Mosaic Grassland/Forest | FORGRASSL | % of terrain | 2009 | ESA ( |
| Mosaic Vegetation/Cropland | VEGCROP | % of terrain | 2009 | ESA ( |
| Grassland | GRASSLAN | % of terrain | 2009 | ESA ( |
| Variable | Abbreviation | Time frame | Unit | Source |
|---|---|---|---|---|
| Bovines | BOVI | 2021 | # per municipality | ICA |
| Bovine herds | BOVIH | 2021 | # per municipality | ICA |
| Buffaloes | BUFF | 2021 | # per municipality | ICA |
| Buffaloes herds | BUFFH | 2021 | # per municipality | ICA |
| Goats | GOAT | 2021 | # per municipality | ICA |
| Sheeps | SHEEP | 2021 | # per municipality | ICA |
| Horses | HORSE | 2021 | # per municipality | ICA |
| Swine (familiar production) | SWINEFAM | 2021 | # per municipality | ICA |
| Swine herds (familiar production) | SWINEFAMH | 2021 | # per municipality | ICA |
| Swine (industrial production) | SWINEIND | 2021 | # per municipality | ICA |
| Swine herds (industrial production) | SWINEINDH | 2021 | # per municipality | ICA |
| Swine (backyard production) | SWINEBAC | 2021 | # per municipality | ICA |
| Swine herds (backyard production) | SWINEBACH | 2021 | # per municipality | ICA |
| Outbound animal movements | MOVOUT | 2016–2018 | # per municipality | ICA |
| Outbound k-neighbors | NEIGHOUT | 2016–2018 | # per municipality | ICA |
| Bovines exported | BOVIOUT | 2016–2018 | # per municipality | ICA |
| Buffaloes exported | BUFFOUT | 2016–2018 | # per municipality | ICA |
| Swines exported | SWINEOUT | 2016–2018 | # per municipality | ICA |
| Sheeps exported | SHEEPOUT | 2016–2018 | # per municipality | ICA |
| Goats exported | GOATOUT | 2016–2018 | # per municipality | ICA |
| Animal movements to properties | MOVSPROP | 2016–2018 | # per municipality | ICA |
| Animal movements to fairs | MOVSFAIR | 2016–2018 | # per municipality | ICA |
| Animal movements to slaughterhouses | MOVSSLAUG | 2016–2018 | # per municipality | ICA |
| Animal movements to exportation | MOVSEXP | 2016–2018 | # per municipality | ICA |
| Inbound animal movements | MOVSIN | 2016–2018 | # per municipality | ICA |
| Inbound k-neighbors | NEIGHIN | 2016–2018 | # per municipality | ICA |
| Bovines imported | BOVISIN | 2016–2018 | # per municipality | ICA |
| Buffaloes imported | BUFFIN | 2016–2018 | # per municipality | ICA |
| Swines imported | SWINEIN | 2016–2018 | # per municipality | ICA |
| Sheeps imported | SHEEPIN | 2016–2018 | # per municipality | ICA |
| Goats imported | GOATIN | 2016–2018 | # per municipality | ICA |
| Cluster | Municipalities | Total herds | Affected herds | Odds ratio | |
|---|---|---|---|---|---|
| 1 | 303 | 231.570 | 690 | 1,40 (1,21-1,62) | <0.0001 |
| 2 | 570 | 289.296 | 1747 | 2,85 (2,5-3,27) | <0.0001 |
| 3 | 178 | 197.863 | 786 | 1,87 (1,62-2,16) | <0.0001 |
| 4 | 50 | 114.150 | 243 | – | – |
Peer Reviews
No public reviews on file for this paper yet. If you reviewed it on a platform where reviews are public (OpenReview, ICLR, NeurIPS, ICML), you can paste yours below so the community can read it here.
Videos
No videos yet. Explain this paper in a talk, walkthrough, or lecture? Add one.
Taxonomy
TopicsAnimal Disease Management and Epidemiology · Zoonotic diseases and public health · Wildlife Ecology and Conservation
Introduction
1
Different communities, population groups and regions have unique characteristics that directly impact the health and well-being of the individuals within them. Understanding and considering these particularities when planning and implementing health interventions is crucial for the success of health promotion actions. It’s essential to conduct analyses of the local context, considering factors such as demographics, socioeconomic conditions, culture, physical environment, and available healthcare infrastructure. This assessment will identify specific population needs, major health issues, and existing barriers (1, 2). In particular, within livestock populations, characterization has been useful to understand disease-risk differentiation, improve feeding strategies, and define production systems and their valor chain (3–6).
The increasing use of technologies for generating and storing information, including information systems, has led to an exponential rise in the availability of various types of data – environmental, economic, demographic, and epidemiological – in the field of veterinary and public health (7, 8). This growth, stemming from multiple sources and characterized by its vast volume and complexity, presents both new challenges and opportunities for research. In this context, the growing need to integrate advanced analytical techniques to efficiently process and analyze these data becomes increasingly apparent in Official Veterinary Services (OVS) (9). This approach highlights the rising importance of big data in transforming veterinary services, thus opening new pathways to improve health outcomes through well-informed and evidence-based decisions.
Techniques such as large-scale data analysis, machine learning, and data mining have become increasingly relevant. Among these techniques, multivariate analyses such as Principal Component Analysis and Hierarchical Clustering, which use dimension reduction to identify uncorrelated subgroups of variables, have gained prominence (10). These techniques extract valuable insights and support informed decision-making based on available data. Moreover, they play a fundamental role in pattern detection, identification of complex relationships, and generation of knowledge from large volumes of information (10).
VS is a disease caused by a vesiculovirus belonging to the Rhabdoviruses family (11). It affects mainly cattle, pigs, and horses and is characterized by ulcerative lesions in the tongue, palate, gums, lips, snout, coronary bands, interdigit, foreskin and teats, a similar clinical presentation to foot-and-mouth disease (FMD). Particularly affecting dairy cattle, VS leads to an average morbidity rate of 40% (12) and can cause direct economic losses due to decrease in production, control and prevention measures, estimated at USD 263, per outbreak per farm, in a study by Orrego et al. (13). Moreover, there may be indirect losses due to possible restrictions in animal trade (14) and because it cannot be clinically distinguished from FMD in the field (15).
The epidemiology of VS is not yet fully established (11). Some researchers suggest sandflies, black flies and biting midges may be potential vectors (16), or at least a stress factor that favors immunosuppression contributing for clinical appearance of the disease (15). However, there are clear indications that there are at least two distinct major components: the first concerns the disease’s relationship with the environment, particularly the presence of favorable climatic conditions for possible vector proliferation and its association with livestock (17–19); the second component involves animal to animal transmission, occurring both through direct contact and through indirect transmission, via fomites or animal movement (11, 19, 20).
VS is widely distributed in the Americas and its prevalence can vary due to factors such as climatic conditions, arthropod presence, and animal management practices (11, 21). In Colombia, it is common for the disease to peak at the end of the rainy season (21), probably due to an increase in vector population and to management practices of herds. Studies between the 1960s and 1980s identified interepidemic periods of 3 years in the country (12), which may occur due to the cumulation of non-exposed animals. One of these studies identified a region of higher incidence and cyclic breakouts - in valleys and specially in foothills and valleys between the Andes - and a region of lower incidence, with geographical and environmental characteristics that differ from the first region (22). Another study observed a significantly higher prevalence in the Aburrá Valley in comparison to highlands and coastal plains (23).
In Colombia, the disease was first reported in Huila, 1929, and Magdalena, 1933. In 1966, VS had been reported in most regions of the country and it has been increasing in numbers in recent years (15). Currently, the most affected departments are Antioquia, Boyacá, Santander, Meta, Nariño, Cauca, Cundinamarca, Casanare, Córdoba, Huila, Putumayo, Tolima y Valle (24). Colombia is a country with significant livestock production, ranking third in South America in terms of cattle population, behind Brazil and Argentina (25). At the same time, it is a country with various ecological areas (e.g., coastal areas, Andes mountains, plains, etc.), leading to different productive potential in each region (26). Understanding the nuances of livestock production becomes crucial when delving into the impact of VS.
The main objective of this study is to characterize Colombian municipalities from both ecological and productive perspectives. Additionally, in a secondary step, to study the association of clinical VS with this characterization.
Materials and methods
2
Variable selection and data sources
2.1
For the characterization of municipalities, which are the epidemiological units in this study, risk factors for VS associated with both environmental and livestock components were proposed. For environmental characterization, meteorological variables (27) such as precipitation, temperature, solar radiation, etc., and ecological variables (28), as land use and vegetation cover, were considered (Table 1).
To obtain information on livestock, data on farm registration by species, the number of rural properties of different types, and the volume of animal movements by municipality were collected, as shown in Table 2. These data were provided by the Colombian Agricultural Institute (ICA), covering the analysis period from 2009 to 2021. This information was extracted from Colombia’s Epidemiological Surveillance and Information System for Vesicular Diseases. This system is part of a national strategy that promotes timely disease detection in primary production, which is essential for the formulation of appropriate prevention, control, or eradication strategies. The system has a technical structure dedicated to the communication of disease suspicions. At the local level, disease notifications are promoted and verified, epidemiological monitoring is conducted, data and samples are collected, information is processed and analyzed, and communication with the regional level is established (25).
The information related to vesicular disease notifications used in the second part of this study on the association between the disease and risk factors, including positive cases of VS, was provided by the ICA.
Environmental data conversion
2.2
To obtain environmental data per municipality, geospatial processing of rasterized data, such as satellite images and statistical projections, was used. During this process, pixel values from each raster file were aggregated by municipality polygon, using measures like averages, to the meteorological variables provided by WorldClim (27), or percentage of municipality occupation, to summarize environmental variables provided by ESA (28). This approach allowed associating relevant information about the environmental characteristics of each municipality, providing a more specific view of the environmental factors present in each defined area. For this the “exactextractr” R package was used (29).
Statistical analysis
2.3
The initial stage of the characterization process involved using Principal Component Analysis (PCA) to group the previously mentioned variables. Based on the resulting PCA dimensions, Colombian municipalities were clustered using Hierarchical Clustering, fowling the methodology describe by Husson et al. (10). The goal was to form groups (clusters) composed of similar municipalities according to the factors studied while differentiating them from municipalities in other groups. Several numbers of group divisions were attempted to find the number that best described the variability while maintaining a parsimonious number of groups, seeking in that way a balance between the complexity of the results (regarding the number of groups) and the usefulness and easiness of its interpretation. Descriptive statistics were performed to present the variables that showed statistical significance in the V-test at a significance level (p-value <0.05). These analyses were performed using the “FactoMineR” package (30).
In a second step, a simple generalized linear model (GLM) assuming a binomial distribution, was used to assess the occurrence of VS against the groups resulting from the Hierarchical Clustering. Thus, the data on VS events reported versus the total population of farms at municipality level (i.e., epidemiological unit) was utilized as a response variable, while clustering results was modeled as the explanatory variable. Wald tests were used to examine and present the significance (p-value <0.05) of each cluster (versus its baseline) in the final model.
All data manipulation and visualization were performed using the ‘tidyverse’ package (31), and spatial data were managed using the ‘sf’ package (32) in the R software environment (33).
Results
3
After testing various cluster number combinations (ranging from 2 to 7), forming 4 clusters provided satisfactory differentiation while maintaining a reasonable number of groups. PCA revealed two main evaluation axes in the first two dimensions: one related to environmental characteristics and the other to livestock features. The behavior of these axes led the composition of the formed clusters. The first 5 components explained 74% of the dataset’s variability. In Figure 1, two principal axes of correlated variables can be observed: one axis describing environmental variables in green and another axis, perpendicular to the first, representing livestock variables in blue. For example, an inversely proportional relationship between altitude (ALTITUDE) and maximum temperatures (MAXTEMP) is evident, as well as a weaker inversely proportional relationship between precipitation (PRECIP) and the total number of pigs in industrial systems (SWINEIND). Perpendicular arrows represent the lack of correlation between variables.
First two dimensions resulting from Principal Component Analysis (axis X and Y respectively). The image presents distribution of all variables used at PCA, thin arrows, and highlights two main axes, one in green, containing mainly variables related to environmental characteristics, and another in blue, composed mainly of variables describing livestock features.
A different number of variables contributed to define each cluster; ranging from 36 variables significantly associated at the V-Test for Cluster 4, up to 48 significant variables for Cluster 2. Figure 2 presents the top 10 variables per cluster that contributed most to the distinction between groups. Details of the group characterization can be found in the Supplementary material.
Top 10 significant variables (y axis) in the V-Test (x axis) per cluster (panels). V-Test significance represents the difference between the cluster’s behavior compared to the total municipalities.
Cluster 1, denoted “Andean,” is characterized by high altitudes, low temperatures, and a significant density of properties, albeit being small-sized ones. Cluster 2, denoted “Amazonian,” stands out for high forest coverage, elevated precipitation levels, and less prominent livestock production. Cluster 3, known as “coastal/Caribbean” covers low-altitude areas with high average temperatures, hosting notable pig production, mainly family-based but with a considerable industrial component as well. Finally, Cluster 4, denoted as “net livestock” included municipalities with intensive livestock production across the entire national territory of Colombia, were identified, irrespective of their environmental characteristics. The spatial distribution of the clusters is shown in Figure 3.
Spatial distribution of the clustering groups (A) and relative risk of occurrence of clinical vesicular stomatitis (B) in the municipalities of Colombia.
The “Amazonian” cluster, in particular, is characterized by conditions conducive to mosquito proliferation, such as high precipitation, mild temperatures, and increased humidity. These factors contribute significantly to the epidemiology of diseases within this region. It is this cluster that has been identified with a notably higher incidence of affected herds, indicating a substantially elevated risk for the occurrence of disease, as detailed in Table 3.
Discussion
4
The main goal of this study was to characterize the livestock productive areas of Colombia through the application of a highly robust data analysis methodology, allowing to enhance the decision-making information process for ICA OVS. Thus, a livestock-environmental characterization was successfully carried out by integrating various available data sources, in line with the continuous technological evolution both globally and in the context of animal health. From this perspective, the methodological approach outlined in this study demonstrated its ability to handle extensive data sets, providing a thorough yet comprehensible characterization of Colombian municipalities from the OVS perspective.
These results allow for a clear, objective distinction between different eco-livestock clusters or zones. From the most livestock-focused zone with a high concentration of cattle and where environmental characteristics do not significantly influence, Cluster 4 – Net Livestock, to zones with low livestock density and extreme altitude and climate, Cluster 1 - Andean. This information is valuable when approaching surveillance or control programs by OVS, allowing for coherent actions based on regional characteristics (9).
This characterization, in fact, could facilitate ICA decision-makers in designing region-specific health strategies tailored to local singularities, including risk-based approached founded on a deep understanding of each region’s intrinsic characteristics. For example, as the Cluster 3 “coastal/Caribbean” stans up due to its relevance on pig production, any health intervention aiming at this population should be carefully targeting the municipalities of this cluster. In fact, a good opportunity is offered regarding the implementation of the ICA’s program to promote good practices on the use of swill feeding in pigs (24).
In the second part of this study, we aimed to test how this prior characterization could contribute to determining VS risk in a simple manner. The model successfully differentiated varying risk levels, with Cluster 2 “Amazonian” presenting the highest risk characterized by low altitudes, high precipitation, and low farm density per municipality. Similar ecological patterns, such as Amazonian and Andean areas, have been identified in Ecuador. The authors suggest that different ecosystems may favor distinct pathways of VS transmission. In Andean communities, due to the high degree of contact among different farms, transmission is facilitated primarily through animal movement and fomites. In areas such as the Amazon, due to climatic characteristics, transmission through vectors is favored (19, 34). Furthermore, other researchers point to a significant genetic similarity between strains found in Ecuador and those found in Colombia (19). Distinct results were observed in Costa Rica by Rodriguez (18), where moist highlands and dry lowlands areas have been identified as regions with a higher disease prevalence in Costa Rica, both in wildlife and livestock.
The utilization and implementation of satellite sources for environmental and climatic data in this study exemplify the utility of big data to improve risk characterization that enables decision-making in the realm of health, in this case, animal health. This methodology was previously applied to characterize aspects of socio-economic relevance affecting Leishmaniasis occurrence in humans (35). The result of this approach provides a deeper understanding of potential relationships between disease distribution patterns and environmental and geographical characteristics, among others. Additionally, it enables the generation of control, prevention, and monitoring measures through OVS in various geographical zones within a territory that share similar regional features. These features might be related to production systems, health culture, commercialization, and movement, among other factors (36).
Part of the information in this study was source upon the existing data available at ICA. Farm registers might encounter a number of potential drawbacks: imprecision (e.g., the number animals or species present at the farm), incomplete (e.g., some farm are not registered) or outdated (as the population of farms is dynamic). Any flaws regarding these data, however, were assumed to have equal chance to be present across the clusters; expecting, thus, no differential bias across them and minimizing the possibility that these errors might have contributed to a meaningful deviance in the results of clustering. Likewise, passive surveillance data originating from rural producers’ notifications might be imperfect, being potentially affected by a lack of sensitivity due to the underreporting. Besides, the underreporting might be unevenly distributed across the Colombian territory in base of the level of sensibilization of the producers. Therefore, these results should be interpreted in light of the potential limitations associated to the use of passive surveillance and should be regarded as of exploratory nature.
Conclusion
5
The technique used in this study proved to be helpful in spatially characterizing multiple factors and exploring relationships between environmental, livestock, and VS occurrence variables.
Data availability statement
The datasets presented in this article are not readily available because, while part of the data used in this research comes from spatial data extraction and analysis methodologies, and this information can be easily shared, part of the information used is property of the Instituto Colombiano Agropecuario and should be requested from them if necessary. Requests to access the datasets should be directed to [email protected].
Author contributions
DL: Conceptualization, Data curation, Formal analysis, Investigation, Methodology, Software, Visualization, Writing – original draft, Writing – review & editing. DC: Data curation, Investigation, Validation, Writing – review & editing. VM: Data curation, Investigation, Validation, Writing – review & editing. JM: Data curation, Investigation, Validation, Writing – review & editing. AR: Conceptualization, Investigation, Writing – review & editing. LB: Conceptualization, Data curation, Formal analysis, Methodology, Writing – review & editing. OC: Funding acquisition, Project administration, Writing – review & editing. MS-V: Conceptualization, Investigation, Methodology, Supervision, Validation, Visualization, Writing – original draft, Writing – review & editing.
The reference list from the paper itself. Each links out to its DOI / PubMed record.
- 1Rogers L De Brún A Mc Auliffe E. Defining and assessing context in healthcare implementation studies: a systematic review. BMC Health Serv Res. (2020) 20:591. doi: 10.1186/s 12913-020-05212-7, PMID: 32600396 PMC 7322847 · doi ↗ · pubmed ↗
- 2World Health Organization (WHO). A guide to tailoring health programmes: using behavioural and cultural insights to tailor health policies, services and communications to the needs and circumstances of people and communities. Copenhagen: WHO Regional Office for Europe. (2023). 102 p.
- 3Karege C Murera A Mukakalisa C Uwimana G. Characterisation of livestock production systems and potential for enhancing productivity through improved feeding in Nyanza district, southern Rwanda. Nairobi, Kenya: ILRI (2019).
- 4Martínez-López B Perez AMSánchez-Vizcaíno JM. Combined application of social network and cluster detection analyses for temporal-spatial characterization of animal movements in Salamanca, Spain. Prev Vet Med. (2009) 91:29–38. doi: 10.1016/j.prevetmed.2009.05.007, PMID: 19500865 · doi ↗ · pubmed ↗
- 5Raizman EA Wells SJ Godden SM Fetrow J Friendshuh K Michael Oakes J. Characterization of Minnesota dairy herds participating in a Johne’s disease control program and evaluation of the program risk assessment tool. Prev Vet Med. (2006) 75:22–33. doi: 10.1016/j.prevetmed.2006.01.012, PMID: 16504319 · doi ↗ · pubmed ↗
- 6Wabacha JK Maribei JM Mulei CM Kyule MN Zessin KH Oluoch-Kosura W. Characterisation of smallholder pig production in kikuyu division, Central Kenya. Prev Vet Med. (2004) 63:183–95. doi: 10.1016/j.prevetmed.2004.02.007, PMID: 15158570 · doi ↗ · pubmed ↗
- 7El Idrissi AH Dhingra M Larfaoui F Johnson A Pinto J Sumption K. Digital technologies and implications for veterinary services. Rev Sci Tech. (2021) 40:455–68. doi: 10.20506/rst.40.2.3237, PMID: 34542102 · doi ↗ · pubmed ↗
- 8World Organization of Animal Health (WOAH) (2018) Manual 6: Animal health information systems. Available at: https://rr-asia.woah.org/wp-content/uploads/2020/02/seacfmd-manual-6.pdf