Association between Metabolic Score for Visceral Fat and the risk of hypertension in different ethnic groups: a prospective cohort study in Southwest China
Fuyan Zhang, Yiying Wang, Jie Zhou, Lisha Yu, Ziyun Wang, Tao Liu, Yangwen Yu

TL;DR
This study found that a new score for visceral fat is linked to higher hypertension risk, especially in Han Chinese people in Southwest China.
Contribution
The study introduces METS-VF as a new indicator and shows its ethnic-specific association with hypertension risk.
Findings
Higher METS-VF values were associated with a 29.9% to 61.5% increased risk of hypertension.
The association was significant in Han Chinese but not in ethnic minorities.
Each 1 unit increase in METS-VF advanced hypertension onset by 0.653 years in Han Chinese.
Abstract
Visceral adipose tissue assessment holds significant importance in hypertension prevention. This study aimed to explore the association between the Metabolic Score for Visceral Fat (METS-VF), a new indicator based on laboratory and anthropometry measures, and hypertension risk and to further investigate the association between the METS-VF and the risk of hypertension in different ethnic groups. In this study, a total of 9,280 people from 48 townships in 12 districts (counties) of Guizhou Province were selected for the survey using a multistage cluster random sampling method, and 5,127 cases were finally included in the analysis after excluding those with missing relevant data, losing visits, dying at follow-up, those who suffered from hypertension at baseline, and those whose information on the outcome of hypertension was not clear. Cox proportional hazard models were used to estimate…
Genes, proteins, chemicals, diseases, species, mutations and cell lines named across the full text — each resolved to its canonical identifier and authoritative record.
Click any figure to enlarge with its caption.
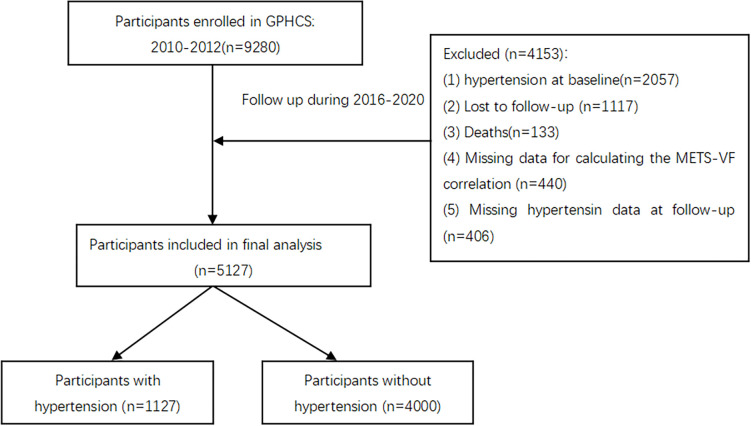 Figure 1
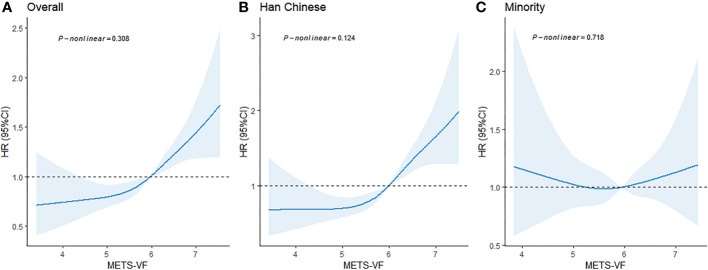 Figure 2
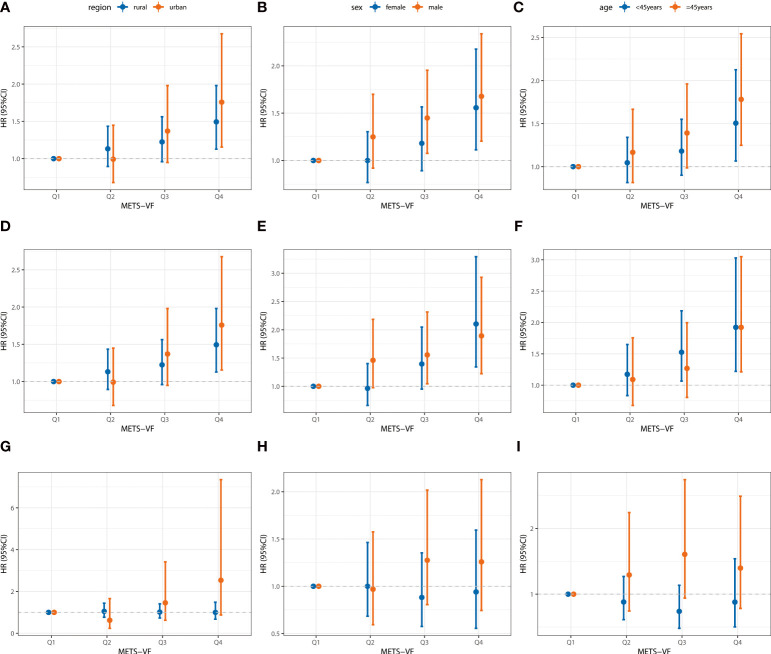 Figure 3
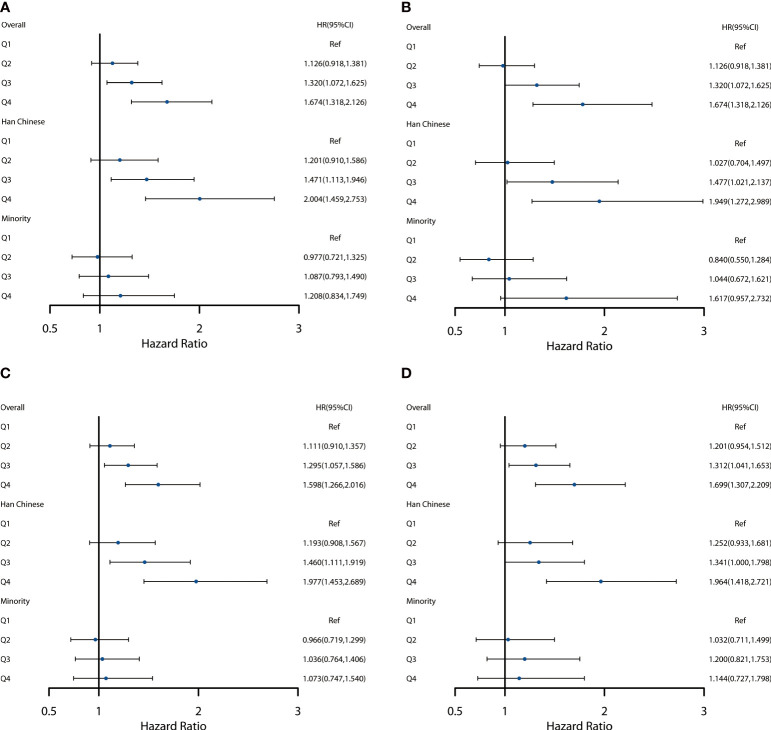 Figure 4
| Characteristics | Subgroups | Participants ( | Total | Han Chinese | Minority | ||||||
|---|---|---|---|---|---|---|---|---|---|---|---|
| Hypertension | Nonhypertension | Hypertension | Nonhypertension | Hypertension | Nonhypertension | ||||||
| Region | Urban | 1,814 (35.38) | 365 (20.12) | 1,449 (79.88) | 0.017 | 1,202 (79.97) | 301 (20.03) | < 0.001 | 247 (79.42) | 64 (20.58) | 0.949 |
| Rural | 3,313 (64.62) | 762 (23.00) | 2,551 (77.00) | 1,091 (74.17) | 380 (25.83) | 1,460 (79.26) | 382 (20.74) | ||||
| Sex | Male | 2,353 (45.89) | 550 (23.37) | 1,803 (76.63) | 0.027 | 1,033 (75.07) | 343 (24.93) | 0.015 | 770 (78.81) | 207 (21.19) | 0.622 |
| Female | 2,774 (54.11) | 577 (20.80) | 2,197 (79.20) | 1,260 (78.85) | 338 (21.15) | 937 (79.68) | 239 (20.32) | ||||
| Ethnic | Minority | 2,153 (41.99) | 446 (20.72) | 1,707 (79.28) | 0.062 | – | – | – | – | – | – |
| Ethnic Han | 2,974 (58.01) | 681 (22.90) | 2,293 (77.10) | – | – | – | – | ||||
| Age | 18 years~ | 3,152 (61.48) | 517 (16.40) | 2,635 (83.60) | < 0.001 | 1,550 (83.92) | 297 (16.08) | < 0.001 | 1,085 (83.14) | 220 (16.86) | < 0.001 |
| 45 years~ | 1,407 (27.44) | 396 (28.14) | 1,011 (71.86) | 552 (69) | 248 (31) | 459 (75.62) | 148 (24.38) | ||||
| 60 years~ | 568 (11.08) | 214 (37.68) | 354 (62.32) | 191 (58.41) | 136 (41.59) | 163 (67.63) | 78 (32.37) | ||||
| Educational level | Below primary | 1,697 (33.10) | 478 (28.17) | 1,219 (71.83) | < 0.001 | 567 (66.16) | 290 (33.84) | < 0.001 | 652 (77.62) | 188 (22.38) | 0.077 |
| Primary | 1,027 (20.03) | 231 (22.49) | 796 (77.51) | 455 (77.38) | 133 (22.62) | 341 (77.68) | 98 (22.32) | ||||
| Junior | 1,621 (31.62) | 295 (18.20) | 1,326 (81.8) | 830 (81.69) | 186 (18.31) | 496 (81.98) | 109 (18.02) | ||||
| High/technical | 518 (10.10) | 82 (15.83) | 436 (84.17) | 283 (84.23) | 53 (15.77) | 153 (84.07) | 29 (15.93) | ||||
| College/above | 264 (5.15) | 41 (15.53) | 223 (84.47) | 158 (89.27) | 19 (10.73) | 65 (74.71) | 22 (25.29) | ||||
| Marital status | Single | 588 (11.47) | 74 (12.59) | 514 (87.41) | < 0.001 | 311 (86.87) | 47 (13.13) | < 0.001 | 203 (88.26) | 27 (11.74) | < 0.001 |
| Married/cohabitation | 4,102 (80.01) | 928 (22.62) | 3,174 (77.38) | 1,849 (76.40) | 571 (23.60) | 1,325 (78.78) | 357 (21.22) | ||||
| Divorce/widowed/separation | 419 (8.17) | 117 (27.92) | 302 (72.08) | 127 (67.91) | 60 (32.09) | 175 (75.43) | 57 (24.57) | ||||
| Other | 18 (0.35) | 8 (44.44) | 10 (55.56) | 6 (66.67) | 3 (33.33) | 4 (44.44) | 5 (55.56) | ||||
| Family history of hypertension | Yes | 520 (10.14) | 98 (18.85) | 422 (81.15) | 0.053 | 311 (83.38) | 62 (16.62) | 0.005 | 111 (75.51) | 36 (24.49) | 0.183 |
| No | 3,257 (63.53) | 707 (21.71) | 2,550 (78.29) | 1,463 (76.76) | 443 (23.24) | 1,087 (80.46) | 264 (19.54) | ||||
| Unclear | 1,350 (26.33) | 322 (23.85) | 1,028 (76.15) | 519 (74.68) | 176 (25.32) | 509 (77.71) | 146 (22.29) | ||||
| History of diabetes | No | 4,813 (93.88) | 1,049 (21.80) | 3,764 (78.20) | 0.207 | 2,180 (77.58) | 630 (22.42) | 0.010 | 1,584 (79.08) | 419 (20.92) | 0.395 |
| Yes | 314 (6.12) | 78 (24.84) | 236 (75.16) | 113 (68.90) | 51 (31.10) | 123 (82.00) | 27 (18.00) | ||||
| History of dyslipidemia | No | 2,437 (47.53) | 517 (21.21) | 1,920 (78.79) | 0.207 | 1,027 (76.64) | 313 (23.36) | 0.589 | 893 (81.40) | 204 (18.60) | 0.013 |
| Yes | 2,690 (52.47) | 610 (22.68) | 2,080 (77.32) | 1,266 (77.48) | 368 (22.52) | 814 (77.08) | 242 (22.92) | ||||
| BMI | Lightweight | 322 (6.29) | 62 (19.25) | 260 (80.75) | 0.001 | 152 (81.72) | 34 (18.28) | 0.003 | 108 (79.41) | 28 (20.59) | 0.210 |
| Normal | 3,381 (66.02) | 707 (20.91) | 2,674 (79.09) | 1,468 (78.13) | 411 (21.87) | 1,206 (80.29) | 296 (19.71) | ||||
| Overweight | 1,177 (22.98) | 284 (24.13) | 893 (75.87) | 573 (75.30) | 188 (24.70) | 320 (76.92) | 96 (23.08) | ||||
| Obesity | 241 (4.71) | 74 (30.71) | 167 (69.29) | 96 (66.67) | 48 (33.33) | 71 (73.20) | 26 (26.80) | ||||
| Smoking | No | 3,751 (73.16) | 785 (20.93) | 2,966 (79.07) | 0.003 | 1,650 (78.53) | 451 (21.47) | 0.004 | 1,316 (79.76) | 334 (20.24) | 0.327 |
| Yes | 1,376 (26.84) | 342 (24.85) | 1,034 (75.15) | 643 (73.65) | 230 (26.35) | 391 (77.73) | 112 (22.27) | ||||
| Never drink | No | 1,579 (30.80) | 357 (22.61) | 1,222 (77.39) | 0.469 | 651 (76.05) | 205 (23.95) | 0.386 | 571 (78.98) | 152 (21.02) | 0.802 |
| Yes | 3,548 (69.20) | 770 (21.70) | 2,778 (78.30) | 1,642 (77.53) | 476 (22.47) | 1,136 (79.44) | 294 (20.56) | ||||
| Oil intake | < 25 | 1,474 (28.99) | 284 (19.27) | 1,190 (80.73) | 0.003 | 668 (79.52) | 172 (20.48) | 0.044 | 522 (82.33) | 112 (17.67) | 0.024 |
| ≥ 25 | 3,610 (71.01) | 835 (23.13) | 2,775 (76.87) | 1,602 (76.07) | 504 (23.93) | 1,173 (77.99) | 331 (22.01) | ||||
| Salt intake (g/day) | < 5 | 915 (17.85) | 185 (20.22) | 730 (79.78) | 0.155 | 473 (80.44) | 115 (19.56) | 0.031 | 257 (78.59) | 70 (21.41) | 0.738 |
| ≥ 5 | 4,212 (82.15) | 942 (22.36) | 3,270 (77.64) | 1,820 (76.28) | 566 (23.72) | 1,450 (79.41) | 376 (20.59) | ||||
| Sleep time (h/day) | < 7/> 9 | 1,087 (21.20) | 255 (23.46) | 832 (76.54) | 0.185 | 496 (74.92) | 166 (25.08) | 0.131 | 336 (79.06) | 89 (20.94) | 0.898 |
| 7–9 | 4,040 (78.80) | 872 (21.58) | 3,168 (78.42) | 1,797 (77.72) | 515 (22.28) | 1,371 (79.34) | 357 (20.66) | ||||
| Sedentary time (h/day) | < 6 | 586 (11.43) | 105 (17.92) | 481 (82.08) | 0.012 | 332 (82.79) | 69 (17.21) | 0.004 | 149 (80.54) | 36 (19.46) | 0.659 |
| ≥ 6 | 4,541 (88.57) | 1,022 (22.51) | 3,519 (77.49) | 1,961 (76.21) | 612 (23.79) | 1,558 (79.17) | 410 (20.83) | ||||
| METS-VF | – | 5.97 (5.46, 6.43) | 5.91 (5.41, 6.38) | 6.17 (5.67, 6.61) | < 0.001 | 5.91 (5.38, 6.38) | 6.26 (5.77, 6.68) | < 0.001 | 5.92 (5.44, 6.36) | 6.05 (5.57,6.51) | < 0.001 |
| Cases ( | Incidence density (1,000 PYs) | Model 1 | Model 2 | Model 3 | ||||
|---|---|---|---|---|---|---|---|---|
| HR (95% CI) | HR (95% CI) | HR (95% CI) | ||||||
| METS-VF level | 1,127 | 31.14 | 1.638 (1.504, 1.784) | < 0.001 | 1.361 (1.243, 1.490) | < 0.001 | 1.323 (1.167, 1.500) | < 0.001 |
| METS-VF group | ||||||||
| Q1 | 198 | 21.44 | 1.000 | 1.000 | 1.000 | |||
| Q2 | 238 | 25.98 | 1.282 (1.062, 1.549) | 0.010 | 1.171 (0.969, 1.417) | 0.103 | 1.108 (0.907, 1.353) | 0.316 |
| Q3 | 297 | 33.02 | 1.693 (1.414, 2.027) | < 0.001 | 1.390 (1.155, 1.672) | < 0.001 | 1.299 (1.061, 1.590) | 0.011 |
| Q4 | 394 | 44.78 | 2.432 (2.049, 2.886) | < 0.001 | 1.741 (1.451, 2.090) | < 0.001 | 1.615 (1.280, 2.036) | < 0.001 |
| < 0.001 | < 0.001 | < 0.001 | ||||||
| Han Chinese | 681 | 32.11 | 1.831 (1.642, 2.042) | < 0.001 | 1.449 (1.288, 1.631) | < 0.001 | 1.493 (1.265, 1.761) | < 0.001 |
| METS-VF | ||||||||
| Q1 | 106 | 19.25 | 1.000 | 1.000 | 1.000 | |||
| Q2 | 132 | 25.58 | 1.444 (1.118, 1.866) | 0.005 | 1.291 (0.998, 1.671) | 0.052 | 1.183 (0.901, 1.554) | 0.226 |
| Q3 | 178 | 34.51 | 2.041 (1.604, 2.597) | < 0.001 | 1.592 (1.242, 2.041) | < 0.001 | 1.459 (1.111, 1.917) | 0.007 |
| Q4 | 265 | 49.28 | 3.053 (2.436, 3.828) | < 0.001 | 1.999 (1.566, 2.552) | < 0.001 | 1.999 (1.471, 2.718) | < 0.001 |
| < 0.001 | < 0.001 | < 0.001 | ||||||
| Minority | 446 | 29.76 | 1.318 (1.144, 1.518) | < 0.001 | 1.172 (1.013, 1.356) | 0.033 | 1.038 (0.851, 1.265) | 0.713 |
| METS-VF | ||||||||
| Q1 | 92 | 24.67 | 1.000 | 1.000 | 1.000 | |||
| Q2 | 106 | 26.49 | 1.037 (0.785, 1.372) | 0.796 | 0.986 (0.744, 1.306) | 0.921 | 0.965 (0.717, 1.297) | 0.812 |
| Q3 | 119 | 31.01 | 1.250 (0.952, 1.641) | 0.108 | 1.105 (0.837, 1.458) | 0.481 | 1.046 (0.771, 1.418) | 0.774 |
| Q4 | 129 | 37.72 | 1.623 (1.242, 2.121) | < 0.001 | 1.323 (1.001, 1.748) | 0.049 | 1.073 (0.747, 1.541) | 0.703 |
| < 0.001 | < 0.001 | 0.656 | ||||||
| variable | Overall | Han Chinese | Minority | |||
|---|---|---|---|---|---|---|
| β (95%CI) | β (95%CI) | β (95%CI) | ||||
| METS-VF level | −0.425 (−0.630, −0.220) | < 0.001 | −0.653 (−0.930, −0.375) | < 0.001 | −0.015 (−0.315, 0.285) | 0.923 |
| METS-VF group | ||||||
| Q1 | 1 | 1 | 1 | |||
| Q2 | −0.107 (−0.423, 0.208) | 0.505 | −0.267 (−0.705, 0.170) | 0.232 | 0.121 (−0.317, 0.560) | 0.586 |
| Q3 | −0.350 (−0.671, −0.029) | 0.033 | −0.601 (−1.043, −0.159) | 0.007 | 0.025 (−0.428, 0.477) | 0.915 |
| Q4 | −0.693 (−1.071, −0.315) | < 0.001 | −1.090 (−1.603, −0.577) | < 0.001 | −0.040 (−0.589, 0.508) | 0.885 |
Peer Reviews
No public reviews on file for this paper yet. If you reviewed it on a platform where reviews are public (OpenReview, ICLR, NeurIPS, ICML), you can paste yours below so the community can read it here.
Videos
No videos yet. Explain this paper in a talk, walkthrough, or lecture? Add one.
Taxonomy
TopicsHealthcare Policy and Management · Primary Care and Health Outcomes
Introduction
1
Hypertension is one of the most important risk factors for cardiovascular and cerebrovascular diseases, chronic kidney disease, and dementia. Elevated blood pressure is a major preventable risk factor for cardiovascular death and the global burden of disease in most regions of the world (1). It is estimated that hypertension will affect more than 1.5 billion people worldwide by 2025, and the estimated number of deaths related to blood pressure has increased to 49%, to 10.4 million each year (2). Hypertension has become a major public health problem facing the world, and curbing hypertension effectively has become a consensus (3, 4). In recent years, studies have found that the accumulation of visceral adipose tissue (VAT) is associated with insulin resistance (IR) and the risk of hypertension (5–8). The Metabolic Score for Visceral Fat (METS-VF) (9), which combines the Metabolic Index of Insulin Resistance (METS-IR), waist-to-height ratio, age, and gender to estimate visceral and subcutaneous fat, is mostly used to predict chronic diseases such as hypertension and diabetes mellitus (10–13). One study found that high METS-VF is significantly associated with increased risk of hypertension in rural Chinese populations but did not examine it in urban populations (13). Published studies assessing the association between METS-VF and the risk of hypertension based on cohort studies are rare. In particular, it has not been reported on the differences between different ethnic groups. Guizhou, located in southwest China, is a multiethnic province, with more than 36.44% of the whole province’s population being ethnic minorities, including the Miao, Buyi, Dong, and so forth (14). Therefore, this study aims to explore the association between METS-VF and the ethnic differences in hypertension based on a prospective cohort study.
Methods
2
Study population
2.1
The data were obtained from the Guizhou Population Health Cohort Study (GPHCS), a large population database that aimed to investigate the prevalence of chronic diseases and risk factors. In 2010, a baseline survey was conducted on 9,280 adult permanent residents in 12 districts (counties) of Guizhou Province using a multistage cluster random sampling method. From 2016 to 2020, 8,163 individuals completed the follow-up survey. During the follow-up, information was updated on the status of major chronic diseases and vital status, with a response rate of 88.00% (15). This study was approved by the Institutional Review Board of Guizhou Province Centre for Disease Control and Prevention (No. s2017-02), and written informed consent was signed by all subjects.
To explore the relationship between METS-VF and hypertension, we excluded participants with missing data (n = 440), loss to follow-up (n = 1,117), follow-up deaths (n = 133), baseline hypertension (n = 2,057), and unclear information on hypertension outcomes (n = 406). Finally, a total of 5,127 participants were included in this study (Figure 1). All deaths were confirmed through the death registration information system and the basic public health service system.
The flow chart of the study.
Data collection
2.2
Baseline information included sociodemographic characteristics (age, gender, ethnicity, education attainment, residence, marital status, and occupation), lifestyle (tobacco and alcohol consumption, physical activity), and medical history of chronic noncommunicable diseases (hypertension, dyslipidemia, diabetes mellitus, and cardiovascular diseases), which was collected by trained investigators through structured questionnaires via face-to-face interview.
Physical examination data, including height, weight, waist circumference, and blood pressure, were collected by trained investigators through standard procedures. Standing height was measured without shoes using a unified height meter (accuracy is 0.1 cm). Weight was measured using an electronic weight scale (accuracy is 0.1 kg). WC was measured using a waist ruler (accuracy is 0.1 cm) at the midpoint between the lowest rib cage and the iliac crest. Blood pressure data were taken as the average of three consecutive measurements. Venous blood samples were obtained in the early morning for fasting blood glucose, total cholesterol, high-density lipoprotein cholesterol, low-density lipoprotein cholesterol, and triglyceride levels after the participants had fasted for at least 8 h.
The above methods for data collection were identical in the baseline and follow-up studies.
Assessment of hypertension and METS-VF
2.3
Participants were diagnosed with hypertension if they met either of the following two criteria: self-reported diagnosis of hypertension or antihypertensive treatment by physicians; or systolic blood pressure (SBP) ≥ 140 mmHg and/or diastolic blood pressure (DBP) ≥ 90 mmHg (16). The blood pressure was measured with the same type of electronic sphygmomanometer (accuracy is 0.1 mmHg). Before measuring blood pressure, one should take a proper rest for 3–5 minutes and avoid strenuous exercise, eating, smoking, and drinking stimulant beverages, such as coffee, strong tea, wine, etc. If the difference in the three measurements did not exceed 10 mmHg, the average of the three measurements was taken as the final reading; if the difference between the three measurements was large, the average of the two similar measurements was taken as the final reading; if only one measurement was taken, the final reading was taken directly.
(9)
(17)
Assessment of covariates
2.4
Diabetes was defined as meeting one of the following conditions: having been diagnosed with diabetes by township or community and above hospitals, fasting plasma glucose (FPG) ≥ 7.0 mmol/L (126 mg/dL), 2-h postmeal blood glucose ≥ 11.1 mmol/L (200 mg/dL) (18). Dyslipidemia was diagnosed as meeting one of the following conditions: total cholesterol (TC) ≥ 6.22 mmol/L; triglycerides (TG) ≥ 2.26 mmol/L; high-density lipoprotein cholesterol (HDL-C) < 1.04 mmol/L; low-density lipoprotein cholesterol (LDL-C) ≥ 4.14 mmol/L; self-reported physician dyslipidemia diagnosis or having received lipid-lowering treatment (19). Cardiovascular disease (CVD) was defined as meeting one of the following conditions: self-reported diagnosis by a physician; death based on myocardial infarction/cerebral hemorrhage/cerebral infarction, etc. Body mass index (BMI) was calculated as weight in kg divided by height in m squared, low weight: BMI kg/m^2^ < 18.5, normal weight: 18.5 kg/m^2^ ≤ BMI < 24 kg/m^2^, overweight: 24 kg/m^2^ ≤ BMI < 28 kg/m^2^, and obesity: BMI ≥ 28 kg/m^2^ (20). Smoking was defined as still smoking at the time of the survey, including daily smoking and occasional smoking at the time of the survey.
Statistical analysis
2.5
The Statistical Package for the Social Sciences (Version 26.0; IBM Corporation, Armonk, NY, USA) and R software (Version 4.2.3; R Foundation for Statistical Computing, Vienna, Austria) were used to perform statistical analyses. The continuous variables that do not obey the normal distribution are expressed as medians (second quartile, third quartile), and categorical variables are described by frequencies and percentages. Baseline characteristics were compared using the Wilcoxon rank sum test or the Chi-square test. Person-years were used as the time variable. The person-years were calculated from the baseline survey to the onset of hypertension or the end of follow-up, and the incidence density of different METS-VF groups was calculated.
The METS-VF values were divided into four groups by quartiles, ≤ 5.15 (Q1), 5.165.64 (Q2), 5.656.06 (Q3), and ≥ 6.07 (Q4), with Q1 as the reference level. We fitted three Cox proportional hazard regression models to estimate the hazard ratio (HR), the adjusted HR (aHR), and corresponding 95% confidence interval to determine the association between METS-VF and the risk of hypertension and performed the subgroup analysis according to the ethnicity. Model 1: without any adjustment for covariates. Model 2: adjusted for age (18–44 years, 45–60 years, ≥ 60 years), gender (man, woman), ethnicity (Han Chinese, minority), region (urban, rural). Model 3: model 2 added education level (below primary, primary, junior, high/technical, college/above), marital status (single, married/cohabitation, divorce/widowed/separation), smoking (current smoking, nonsmoking), alcohol consumption (yes, no), sleep duration (< 7/> 9 h, 7–9h), sedentary time (< 6 h, ≥ 6 h), having diabetes mellitus (yes, no), dyslipidemia (yes, no), family history of hypertension (yes, no), BMI grade (light weight, normal, overweight, obesity), salt intake (< 25 g/day, ≥ 25 g/day), oil intake (< 5 g/day, ≥ 5 g/day). A restrictive cubic-like spline plot was used to plot the dose–response relationship of the baseline METS-VF values with the risk of hypertension. The AFT model was applied to evaluate the effect of METS-VF on the onset time of hypertension, and the logistic distribution was selected for the AFT model according to the minimum AIC information criterion in different survival distributions (i.e., Weibull, index, logistic, Gauss).
Sensitivity analysis was conducted by excluding participants who were diagnosed with baseline diabetes, dyslipidemia, cardiovascular disease (including coronary heart disease and stroke), and individuals with a single blood pressure measurement. All tests were conducted two-sided, and a p-value less than or equal to 0.05 was considered statistically significant.
Results
3
Baseline characteristics of participants
3.1
The total person-years of follow-up was 36,188.52 years. At baseline, 5,127 participants were included in the analysis, of which 2,353 (45.89%) were men, 2,774 (54.11%) were women, 2,974 (58.01%) were Han Chinese, and 2,153 (41.99%) were minority. During a median follow-up of 6.64 years, the incident density of 1,127 newly diagnosed hypertension was 31.14/1,000 PYs. The cumulative incidence of hypertension was 22.90% in Han Chinese and 20.72% in minority nationalities. In the Han Chinese population, hypertensive patients as compared with nonhypertensive patients, different regions, gender, age group, education level, marital status, family history of hypertension, history of diabetes, BMI grade, current smoking, oil intake, static time, and METS-VF, which were statistically significant (p < 0.05). There were statistically significant (p < 0.05) in terms of age, marital status, history of dyslipidemia, oil intake, and METS-VF between ethnic minorities with hypertension and those without (Table 1).
Associations of METS-VF with risk of hypertension
3.2
Without adjusting for any confounding variables, compared with Q1, Q2 (HR = 1.282 [1.062, 1.549]), Q3 (HR = 1.693 [1.414, 2.027]), and Q4 (HR = 2.432 (2.049, 2.886]) were associated with an increased risk of hypertension. In the fully adjusted model, the risk of hypertension in Q3 and Q4 populations was 1.299 times (HR = 1.299 (1.061, 1.590]) and 1.615 times (HR = 1.615 [1.280, 2.036]) higher than that of the Q1 population, respectively. The risk of hypertension also increased with higher METS-VF values (ptrend < 0.001). Interaction analysis showed that there was an interaction between ethnicity and METS-VF, p = 0.003. Further analysis of ethnic stratification in Model 3 showed that both Q2 and Q3 increased the risk of hypertension in the Han Chinese population (HR = 1.459 [1.1111.917], 1.999 [1.4172.718]). However, the association between METS-VF and the risk of hypertension was not statistically significant in the ethnic minority population (p > 0.05) (Table 2).
Dose–response relationship between METS-VF and risk of incident hypertension
3.3
We employed a four-knot RCS regression model to fit the dose–response curves for METS-VF in relation to the risk of hypertension. The RCS analysis revealed that the association between METS-VF and hypertension risk was linear (p for nonlinearity = 0.308). Furthermore, as baseline METS-VF values increased, so did the risk of hypertension. However, this association has not been found among ethnic minorities (Figure 2).
Dose–response relationship between baseline METS-VF levels and the risk of hypertension. (A) For the total population; (B) For the Han Chinese; (C) For the Minority. Adjusted age, sex, ethnicity, region, education level, marital status, smoking, alcohol consumption, sleep duration, sedentary time, diabetes mellitus, dyslipidemia, family history of hypertension, BMI grade, salt intake, and oil intake.
Subgroup analysis
3.4
The participants were categorized into three subgroups according to gender, age group, and region. Compared with Q1, Q4 was associated with an increased risk of hypertension in different subgroups in the general population and the Han Chinese population (p < 0.05). However, the association between METS-VF subgroups and hypertension in ethnic minority populations was not statistically significant in any of the subgroups (p > 0.05) (Figure 3).
Association between baseline METS-VF and the incident risk of hypertension by region, sex, and age in different groups. (A–C) For the total population; (D–F) For the Han Chinese; (G–I) For the Minority. Adjusted age, sex, ethnicity, region, education level, marital status, smoking, alcohol consumption, sleep duration, sedentary time, diabetes mellitus, dyslipidemia, family history of hypertension, BMI grade, salt intake, and oil intake.
Associations of METS-VF with time to onset of hypertension
3.5
A significant positive association was observed between METS-VF at baseline and time to onset of hypertension during the follow-up survey (β = −0.425 [−0.630, −0.220]), that is, the onset of hypertension was advanced by 0.425 years per 1 unit increase in METS-VF. In the Han Chinese population, the onset time of hypertension reached 0.653 years earlier (β = −0.653 [−0.930, −0.375]). In ethnic minorities, we failed to detect a significant association (p > 0.05) (Table 3).
Sensitivity analysis
3.6
Four sensitivity analyses were conducted by excluding participants who were diagnosed with diabetes, dyslipidemia, and cardiovascular disease (including coronary heart disease and stroke) at baseline and individuals with a single blood pressure measurement. The results of which did not differ substantially from those of the primary analyses (Figure 4).
Sensitivity analysis of different METS-VF groups and risk of hypertension. (A) Excluding patients with diabetes mellitus at baseline. (B) Excluding patients with dyslipidemia at baseline. (C) Excluding patients with cardiovascular disease at baseline (including coronary heart disease and stroke). (D) Excluding participants with a single blood pressure measurement.
Discussion
4
Based on a prospective cohort study in Southwest China, METS-VF levels had a significant positive association with increased risk for hypertension. With every unit increase in METS-VF, the risk of hypertension increases by 32.3%. In addition, our study showed that the onset of hypertension was advanced with increasing METS-VF scores. Nevertheless, this association was not found in ethnic minorities. These findings indicated that it is crucial to pay attention to METS-VF for the prevention and control of hypertension, which provides a reference basis for future ethnic genetic research.
Currently, there is relatively limited research on the association between METS-VF levels and the risk of hypertension. Moreover, studies related to METS-VF and the risk of hypertension in different ethnic groups have not been reported. As far as we know, this was the first prospective cohort study aimed at exploring the risk of hypertension in different ethnic populations with METS-VF. Previous studies have demonstrated a positive association between METS-VF and hypertension. Feng et al. conducted a cohort study of 10,297 participants in rural China, which showed that the positive association between METS-VF and the risk of hypertension in Q2, Q3, and Q4 persisted (ORs [95% CI]: 1.66 [1.39–1.99], 2.50 [2.10–2.97], and 3.84 [3.23–4.56]) and progressively higher risk of hypertension with increasing quartiles of METS-VF (13). In another Mexican study, METS-VF was shown to predict cardiometabolic risk independently of BMI. Bello-Chavolla et al. reported that METS-VF levels were strongly associated with the risk of hypertension, with individuals in the highest quintile having a 3.7 times greater risk of hypertension than those in the lowest quintile (9). These are generally consistent with the findings of our study. There are several underlying association mechanisms between METS-VF and the risk of developing hypertension. Firstly, it may be that excess visceral fat deposition allows for a higher release of circulating free fatty acids, which can lead to atherosclerosis, hyperlipidemia, hypertension, and cardiovascular disease (21). Secondly, there is evidence that the accumulation of visceral adipose tissue is associated with impaired vascular health, adipocyte dysfunction, inflammation, and adipokine dysregulation. This promotes multiple vascular injuries, proinflammatory states, and glycolipid metabolism impairments, leading to a stress-induced response to IR (22). Thirdly, plasminogen activator inhibitor-1 may play a key role in visceral fat associated with the risk of hypertension. In the Framingham Offspring Study, plasminogen activator inhibitor-1 levels are associated with increased levels of systolic and diastolic blood pressure, which are the main circulating inhibitors of thrombolysis. More importantly, visceral fat produces more of this peptide than subcutaneous fat (23, 24).
Stratified analysis showed that METS-VF was able to significantly increase the risk of hypertension in the Han Chinese participants, but the association was not observed in ethnic minority participants. The possible reason is that given the differences in visceral fat levels among different races/ethnicities (25–27), it may lead to variations in the control of blood pressure by the renin–angiotensin–aldosterone system (28, 29). Some studies have shown that although visceral fat varies among different racial/ethnic groups, the effect of visceral fat on systolic and diastolic blood pressure is significant (30), which can increase the risk of hypertension (31). However, in this study, we did not find any association between METS-VF and the risk of hypertension in ethnic minority populations. There are two possible reasons to explain this. One reason may be that different ethnic populations have unique genetic characteristics for the same gene. The migration of ethnic groups is hindered by geographical barriers and influenced by culture, so there are different degrees of different food habits, cultural life, and genetic exchange between different peoples (32). Existing studies have shown that there are some genetic differences between Han and ethnic groups in Guizhou. For example, the allele and genotype frequencies of different single-nucleotide polymorphisms (SNP) of amyloid precursor protein (APP) are significantly different between Han and ethnic minorities in Guizhou (33). Another study investigated the relationship between single-nucleotide polymorphisms of the apolipoprotein E gene, rs725960, rs440446, rs769449, rs429358, rs7412, rs1065853, and rs439401, and essential hypertension (EH) in the Guizhou population and found that rs439401 was associated with the susceptibility to EH in the Guizhou Han population and may have ethnic specificity (34). Another is that differences in social support and lifestyle factors may also account for differences in the increased risk of hypertension between races/ethnicities (35, 36). In addition, relevant studies have shown that the characteristic diet of ethnic minorities can reduce blood lipid levels and improve lipid metabolism disorders and the oxidative stress caused by obesity (37–39). Even so, due to the lack of research on visceral fat and hypertension in ethnic minorities in China, the relationship between the METS-VF and the risk of incident hypertension needs to be further investigated to examine the mechanisms involved in ethnic differences.
Compared with previous studies, the strength of this research lies in its prospective design with clear characteristics and a longer follow-up period (up to 10 years). Our study was the first to investigate the association between METS-VF and hypertension risk among different ethnic groups in southwest China. However, there are also some limitations. First, despite the adjustment for multiple potential confounders, there may be other factors, such as regional environmental and socioeconomic characteristics, genetics, diet cultures, local customs, and psychological factors, affecting results. Second, we only conducted the baseline METS-VF study with the risk of incident hypertension. Finally, this study only investigated the permanent residents of Southwest China, and the extrapolation of the results was limited.
Conclusion
5
In conclusion, high METS-VF is significantly associated with an increased risk of hypertension, but this association was not found in ethnic minority populations. This result provides new evidence for the relationship between METS-VF and the risk of hypertension in southwest China and highlights the need to focus on visceral fat and hypertension prevention.
Data availability statement
The raw data supporting the conclusions of this article will be made available by the authors, without undue reservation.
Ethics statement
The studies involving humans were approved by Institutional Review Board of Guizhou Province Centre for Disease Control and Prevention. The studies were conducted in accordance with the local legislation and institutional requirements. The participants provided their written informed consent to participate in this study.
Author contributions
FZ: Writing – original draft. YW: Writing – original draft. JZ: Writing – review & editing. LY: Writing – review & editing. ZW: Writing – original draft. TL: Writing – review & editing. YY: Writing – review & editing.
The reference list from the paper itself. Each links out to its DOI / PubMed record.
- 1Zhou B Perel P Mensah GA Ezzati M. Global epidemiology, health burden and effective interventions for elevated blood pressure and hypertension. Nat Rev Cardiol. (2021) 18:785–802. doi: 10.1038/s 41569-021-00559-8 34050340 PMC 8162166 · doi ↗ · pubmed ↗
- 2Olsen MH Angell SY Asma S Boutouyrie P Burger D Chirinos JA. A call to action and a lifecourse strategy to address the global burden of raised blood pressure on current and future generations: the Lancet Commission on hypertension. Lancet (London England). (2016) 388:2665–712. doi: 10.1016/S 0140-6736(16)31134-5 27671667 · doi ↗ · pubmed ↗
- 3Carey RM Whelton PK. Prevention, detection, evaluation, and management of high blood pressure in adults: synopsis of the 2017 American College of Cardiology/American Heart Association Hypertension Guideline. Ann Intern Med. (2018) 168:351–8. doi: 10.7326/M 17-3203 29357392 · doi ↗ · pubmed ↗
- 4NCD Risk Factor Collaboration (NCD-Ris C). Worldwide trends in hypertension prevalence and progress in treatment and control from 1990 to 2019: a pooled analysis of 1201 population-representative studies with 104 million participants. Lancet (London England). (2021) 398:957–80. doi: 10.1016/S 0140-6736(21)01330-1 PMC 844693834450083 · doi ↗ · pubmed ↗
- 5Després J Lemieux I Bergeron J Pibarot P Mathieu P Larose E. Abdominal obesity and the metabolic syndrome: contribution to global cardiometabolic risk. Arteriosclerosis thrombosis Vasc Biol. (2008) 28:1039–49. doi: 10.1161/ATVBAHA.107.159228 18356555 · doi ↗ · pubmed ↗
- 6Antonio-Villa NE Bello-Chavolla OY Vargas-Vázquez A Mehta R Fermín-Martínez CA Martagón-Rosado AJ. Increased visceral fat accumulation modifies the effect of insulin resistance on arterial stiffness and hypertension risk. Nutrition metabolism Cardiovasc Dis NMCD. (2021) 31:506–17. doi: 10.1016/j.numecd.2020.09.031 33279372 · doi ↗ · pubmed ↗
- 7Oikonomou EK Antoniades C. The role of adipose tissue in cardiovascular health and disease. Nat Rev Cardiol. (2019) 16:83–99. doi: 10.1038/s 41569-018-0097-6 30287946 · doi ↗ · pubmed ↗
- 8Hayashi T Boyko EJ Leonetti DL Mc Neely MJ Newell-Morris L Kahn SE. Visceral adiposity and the prevalence of hypertension in Japanese Americans. CIRCULATION. (2003) 108:1718–23. doi: 10.1161/01.CIR.0000087597.59169.8D 12975250 · doi ↗ · pubmed ↗