Diabetic kidney disease as an independent predictor of long-term adverse outcomes in patients with coronary artery disease and diabetic mellitus
Zhiyu Liu, Rui Jiang, Ruochen Xu, Yunzhe Wang, Yan Lv, Chang Su, Fengyi Yu, Zhen Qin, JunNan Tang, JinYing Zhang

TL;DR
This study shows that diabetic kidney disease increases the risk of long-term heart problems in patients with diabetes and coronary artery disease after heart procedures.
Contribution
The study identifies diabetic kidney disease as an independent predictor of adverse outcomes in CAD patients with diabetes after PCI.
Findings
Patients with DKD had a 40.3% MACE rate compared to 52.2% in non-DKD patients.
DKD was an independent predictor of MACE, cardiovascular death, and all-cause death after adjusting for variables.
Abstract
Diabetic kidney disease (DKD) had been proposed as a contributor in the pathogenesis of coronary artery disease (CAD). However, the relationship of DKD and the long-term adverse outcomes in patients with CAD after percutaneous coronary intervention (PCI) was still undiscovered. Approximately 892 patients with CAD enrolled from January 2012 to December 2016. The patients were divided into two groups, the DKD group (n = 341) and the None DKD group (n = 551). The primary outcome was major adverse cardiac events (MACE) after PCI. The average follow-up time was 1,897 ± 1,276 days. Baseline data showed that some factors were significantly different between the two groups, including age, body mass index, gender (female), hypertension, smoking, stroke history, heart failure, duration of diabetic mellitus (DM), low-density lipoprotein cholesterol, urinary protein/creatinine ratio, serum…
Genes, proteins, chemicals, diseases, species, mutations and cell lines named across the full text — each resolved to its canonical identifier and authoritative record.
Click any figure to enlarge with its caption.
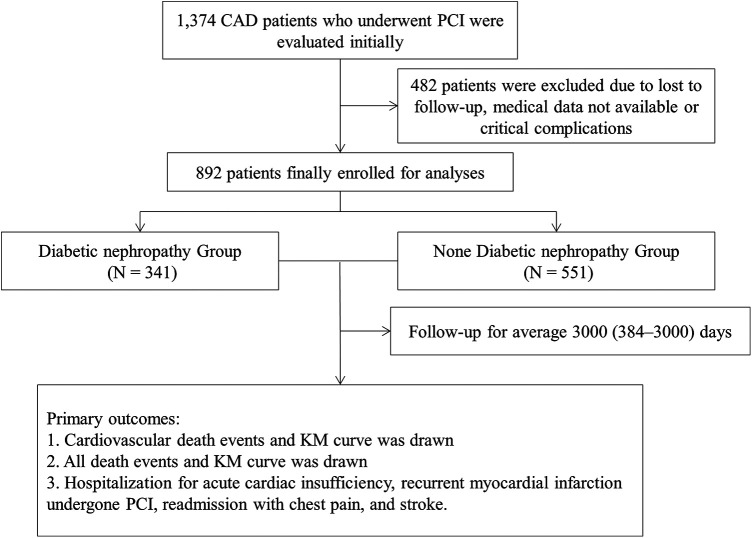 Figure 1
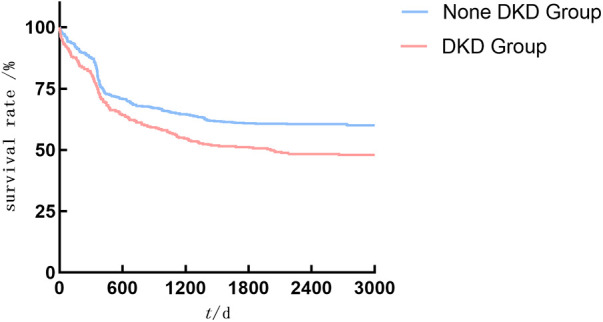 Figure 2
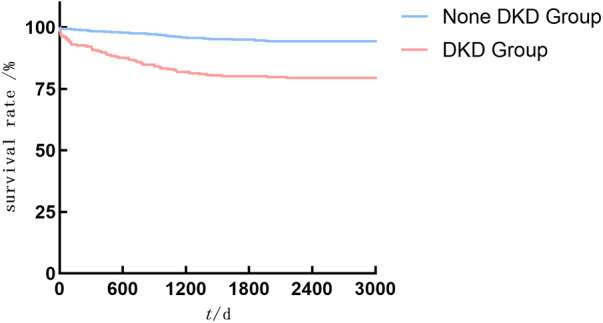 Figure 3
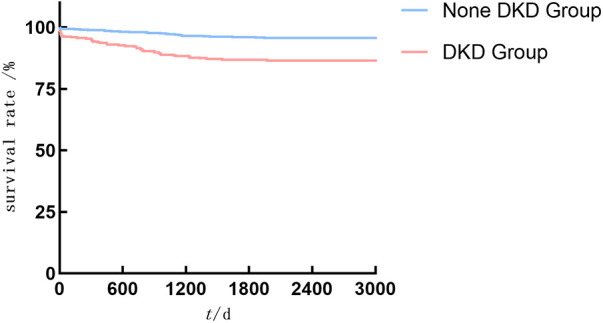 Figure 4
| Variables | DKD group (341) | None DKD group (551) | ||
|---|---|---|---|---|
| Age, years | 63.99 ± 10.89 | 54.91 ± 10.65 | 12.256 |
|
| BMI, kg m−2 | 24.27 ± 6.05 | 23.36 ± 6.21 | −2.025 | |
| Female, | 109 (32.0) | 122 (22.1) | 10.592 | |
| HTN, | 214 (62.8) | 300 (54.4) | 5.957 | |
| Smoking status, | 120 (35.2) | 258 (46.8) | 11.674 | |
| Stroke history, | 69 (20.2) | 58 (10.5) | 16.259 |
|
| Heart failure, | 228 (69.7) | 294 (55.4) | 17.510 |
|
| HbA1c, mg dl−1 | 7.53 ± 1.75 | 7.43 ± 1.76 | 0.756 | 0.45 |
| Duration of DM, years | 10.0 (8.0–18.0) | 8.5 (8.0–11.0) | −22.773 | |
| HDL, mmol L−1 | 1.01 ± 0.29 | 1.03 ± 2.78 | −0.791 | 0.429 |
| LDL, mmol L−1 | 2.38 ± 0.93 | 2.53 ± 0.89 | −2.333 | |
| UACR, mg g | 703.97 (419.68–1,074.46) | 550.78 (416.56–861.71) | 2.820 | |
| Creatinine, μmol L−1 | 88.00 (77.00–101.30) | 76.0 (56.00–72.00) | 17.947 |
|
| CRP, mmol L−1 | 4.55 (1.16–17.49) | 3.58 (1.02–12.45) | 1.632 | 0.103 |
| WBC, 109 L−1 | 9.14 ± 4.24 | 9.50 ± 3.53 | −1.299 | 0.194 |
| Hemoglobin, g L−1 | 129.30 ± 24.30 | 136.77 ± 20.07 | −4.745 |
|
| PLT, 109 L−1 | 207.16 ± 61.04 | 223.28 ± 65.01 | −3.493 | |
| Antiplatelet, | 237 (72.0) | 501 (91.6) | 59.187 |
|
| Beta blocker, | 183 (55.6) | 370 (67.9) | 13.284 |
|
| Statin, | 261 (79.3) | 509 (93.2) | 37.519 |
|
| Calcium channel blocker, | 28 (8.5) | 40 (7.3) | 0.429 | 0.513 |
| Antihypertensive drugs, | 163 (50.2) | 350 (64.2) | 17.358 |
|
| Hypoglycemic agent, | 137 (43.2) | 241 (47.2) | 1.227 | 0.268 |
| Insulin | 138 (44.1) | 152 (30.4) | 15.721 |
|
| Variables | B | SE | Wald | Hazard ratio | 95% confidence interval | |
|---|---|---|---|---|---|---|
| DKD groups | 0.350 | 0.101 | 11.965 | 1.419 | 1.164–1.730 | |
| Age | 0.006 | 0.004 | 1.715 | 1.006 | 0.997–1.014 | 0.190 |
| Female | −0.024 | 0.115 | 0.045 | 0.976 | 0.780–1.222 | 0.833 |
| HTN | −0.053 | 0.102 | 0.267 | 0.949 | 0.778–1.158 | 0.605 |
| Smoking status | 0.181 | 0.101 | 3.209 | 1.198 | 0.983–1.460 | |
| Stroke history | 0.123 | 0.138 | 0.787 | 1.131 | 0.862–1.482 | 0.375 |
| Heart failure | 0.105 | 0.104 | 1.020 | 1.110 | 0.906–1.361 | 0.313 |
| HbA1c | 0.076 | 0.028 | 7.539 | 1.079 | 1.022–1.139 | |
| Duration of DM | 0.017 | 0.008 | 5.111 | 1.017 | 1.002–1.032 | |
| HDL | −0.198 | 0.186 | 1.133 | 0.820 | 0.569–1.182 | 0.287 |
| LDL | −0.100 | 0.058 | 2.944 | 0.905 | 0.807–1.014 | |
| Creatinine | 0.000 | 0.001 | 0.465 | 1.000 | 0.999–1.002 | 0.495 |
| CRP | 0.000 | 0.000 | 0.274 | 1.000 | 1.000–1.000 | 0.600 |
| WBC | 0.002 | 0.014 | 0.020 | 1.002 | 0.974–1.031 | 0.889 |
| Hemoglobin | −0.005 | 0.002 | 4.508 | 0.995 | 0.991–1.000 | |
| PLT | −0.002 | 0.001 | 3.925 | 0.998 | 0.997–1.000 | |
| Antiplatelet | −0.271 | 0.132 | 4.196 | 0.763 | 0.588–0.988 | |
| Beta blocker | −0.174 | 0.105 | 2.738 | 0.840 | 0.684–1.033 | 0.098 |
| Statin | −0.407 | 0.143 | 8.122 | 0.666 | 0.503–0.881 | |
| Calcium channel blocker | −0.229 | 0.207 | 1.224 | 0.795 | 0.530–1.193 | 0.269 |
| Antihypertensive drugs | −0.121 | 0.104 | 1.350 | 0.886 | 0.723–1.087 | 0.245 |
| Hypoglycemic agent | −0.040 | 0.101 | 0.159 | 0.960 | 0.787–1.172 | 0.690 |
| Insulin | 0.138 | 0.104 | 1.750 | 1.148 | 0.936–1.408 | 0.186 |
| Variables | B | SE | Wald | Hazard ratio | 95% confidence interval | |
|---|---|---|---|---|---|---|
| DKD groups | 1.374 | 0.216 | 40.464 | 3.951 | 2.587–6.033 | |
| Age | 0.076 | 0.010 | 61.679 | 1.079 | 1.059–1.100 | |
| Female | 0.326 | 0.212 | 2.366 | 1.386 | 0.914–2.101 | 0.124 |
| HTN | −0.178 | 0.200 | 0.791 | 0.837 | 0.566–1.239 | 0.374 |
| Smoking status | −0.301 | 0.208 | 2.102 | 0.740 | 0.492–1.112 | 0.147 |
| Stroke history | 0.328 | 0.255 | 1.654 | 1.388 | 0.842–2.286 | 0.198 |
| Heart failure | 1.029 | 0.243 | 17.937 | 2.797 | 1.738–4.502 | |
| HbA1c | 0.084 | 0.054 | 2.365 | 1.087 | 0.977–1.210 | 0.124 |
| Duration of DM | 0.032 | 0.014 | 5.531 | 1.033 | 1.005–1.061 | |
| HDL | 0.509 | 0.340 | 2.242 | 1.663 | 0.855–3.238 | 0.134 |
| LDL | −0.128 | 0.118 | 1.168 | 0.880 | 0.699–1.109 | 0.280 |
| Creatinine | 0.002 | 0.001 | 12.253 | 1.002 | 1.001–1.003 | |
| CRP | 0.000 | 0.000 | 0.049 | 1.000 | 1.000–1.000 | 0.826 |
| WBC | 0.068 | 0.026 | 6.957 | 1.070 | 1.018–1.126 | |
| Hemoglobin | −0.007 | 0.004 | 2.596 | 0.993 | 0.985–1.001 | 0.107 |
| PLT | −0.004 | 0.002 | 5.537 | 0.996 | 0.992–0.999 | |
| Antiplatelet | −1.468 | 0.219 | 44.915 | 0.230 | 0.150–0.354 | |
| Beta blocker | −1.108 | 0.223 | 24.601 | 0.330 | 0.213–0.512 | |
| Statin | −1.887 | 0.219 | 74.220 | 0.152 | 0.099–0.233 | |
| Calcium channel blocker | −0.400 | 0.462 | 0.753 | 0.670 | 0.271–1.655 | 0.386 |
| Antihypertensive drugs | −1.190 | 0.235 | 25.571 | 0.304 | 0.192–0.482 | |
| Hypoglycemic agent | −1.182 | 0.246 | 23.133 | 0.307 | 0.190–0.497 | |
| Insulin | 0.058 | 0.211 | 0.075 | 1.059 | 0.701–1.601 | 0.785 |
| Variables | B | SE | Wald | Hazard ratio | 95% confidence interval | |
|---|---|---|---|---|---|---|
| DKD groups | 1.196 | 0.252 | 22.562 | 3.308 | 2.019–5.420 | |
| Age | 0.074 | 0.012 | 41.023 | 1.077 | 1.053–1.102 | |
| Female | 0.188 | 0.261 | 0.517 | 1.206 | 0.723–2.012 | 0.472 |
| HTN | −0.402 | 0.239 | 2.825 | 0.669 | 0.419–1.069 | |
| Smoking status | −0.478 | 0.257 | 3.450 | 0.620 | 0.374–1.027 | |
| Stroke history | 0.229 | 0.317 | 0.523 | 1.258 | 0.676–2.342 | 0.470 |
| Heart failure | 0.953 | 0.292 | 10.672 | 2.594 | 1.464–4.597 | |
| HbA1c | −0.093 | 0.084 | 1.239 | 0.911 | 0.773–1.074 | 0.266 |
| Duration of DM | −0.003 | 0.020 | 0.017 | 0.997 | 0.959–1.037 | 0.897 |
| HDL | 0.400 | 0.427 | 0.877 | 1.491 | 0.646–3.441 | 0.349 |
| LDL | −0.165 | 0.145 | 1.295 | 0.848 | 0.638–1.127 | 0.255 |
| Creatinine | 0.002 | 0.001 | 6.861 | 1.002 | 1.001–1.004 | |
| CRP | 0.000 | 0.000 | 0.021 | 1.000 | 1.000–1.000 | 0.884 |
| WBC | 0.103 | 0.026 | 15.761 | 1.109 | 1.054–1.167 | |
| Hemoglobin | −0.006 | 0.005 | 1.507 | 0.994 | 0.984–1.004 | 0.220 |
| PLT | −0.005 | 0.002 | 5.880 | 0.995 | 0.990–0.999 | |
| Antiplatelet | −0.519 | 0.318 | 2.658 | 0.595 | 0.319–1.111 | 0.103 |
| Beta blocker | −0.498 | 0.273 | 3.337 | 0.608 | 0.356–1.037 | |
| Statin | −0.872 | 0.318 | 7.491 | 0.418 | 0.224–0.781 | |
| Calcium channel blocker | −0.389 | 0.594 | 0.429 | 0.678 | 0.211–2.171 | 0.512 |
| Antihypertensive drugs | −0.652 | 0.274 | 5.661 | 0.521 | 0.304–0.891 | |
| Hypoglycemic agent | −1.214 | 0.299 | 16.431 | 0.297 | 0.165–0.534 | |
| Insulin | −0.771 | 0.300 | 6.624 | 0.462 | 0.257–0.832 |
| Outcomes | DKD group | None DKD group | ||
|---|---|---|---|---|
| MACE | 178 (52.2) | 222 (40.3) | 12.078 | |
| Cardiovascular death events | 70 (20.5) | 31 (5.6) | 46.585 | |
| All-cause death | 46 (13.5) | 24 (4.4) | 24.301 | |
| Hospitalization for acute cardiac insufficiency | 47 (13.8) | 52 (9.4) | 5.7 | 0.058 |
| re-AMI | 48 (14.1) | 70 (12.7) | 0.345 | 0.557 |
| Readmission with chest pain | 106 (31.1) | 163 (29.6) | 0.226 | 0.635 |
| Stroke | 4 (1.3) | 6 (1.2) | 0.007 | 0.933 |
| Variables | B | SE | Wald | Hazard ratio | 95% confidence interval | VIF | |
|---|---|---|---|---|---|---|---|
| DKD groups | 0.256 | 0.117 | 4.776 | 1.291 | 1.027–1.624 | 0.029 | 1.028 |
| Smoking status | 0.227 | 0.114 | 3.938 | 1.255 | 1.003–1.570 | 0.047 | 1.025 |
| HbA1c ≥ 9.0 mmol L−1 | 0.339 | 0.141 | 5.788 | 1.403 | 1.065–1.849 | 0.016 | 1.015 |
| LDL ≥ 1.8 mmol L−1 | −0.299 | 0.128 | 5.477 | 0.742 | 0.577–0.953 | 0.019 | 1.013 |
| Variables | B | SE | Wald | Hazard ratio | 95% confidence interval | VIF | |
|---|---|---|---|---|---|---|---|
| DKD groups | 0.764 | 0.259 | 8.678 | 2.148 | 1.292–3.572 | 0.003 | 1.168 |
| Age ≥60 years | 1.248 | 0.313 | 15.859 | 3.482 | 1.884–6.435 | <0.001 | 1.160 |
| Heart failure | 0.583 | 0.262 | 4.949 | 1.791 | 1.072–2.992 | 0.026 | 1.033 |
| Statin | −0.849 | 0.261 | 10.560 | 0.428 | 0.256–.0,714 | 0.001 | 1.167 |
| Hypoglycemic agent | −1.068 | 0.315 | 11.501 | 0.344 | 0.185–0.637 | 0.001 | 1.102 |
| Variables | B | SE | Wald | Hazard ratio | 95% confidence interval | VIF | |
|---|---|---|---|---|---|---|---|
| DKD groups | 0.801 | 0.265 | 9.122 | 2.229 | 1.325–3.749 | 0.003 | 1.125 |
| Age ≥60 years | 1.170 | 0.306 | 14.593 | 3.224 | 1.768–5.877 | <0.001 | 1.126 |
| Hypoglycemic agent | −1.270 | 0.300 | 17.958 | 0.281 | 0.156–0.505 | <0.001 | 1.005 |
- —National Natural Science Foundation of China 10.13039/501100001809
- —Excellent Youth Science Foundation of Henan Province
Peer Reviews
No public reviews on file for this paper yet. If you reviewed it on a platform where reviews are public (OpenReview, ICLR, NeurIPS, ICML), you can paste yours below so the community can read it here.
Videos
No videos yet. Explain this paper in a talk, walkthrough, or lecture? Add one.
Taxonomy
TopicsPotassium and Related Disorders · Diabetes Treatment and Management · Neurological and metabolic disorders
Introduction
1
Diabetic mellitus (DM) is the most common risk factor for coronary artery disease (CAD), which is the leading cause of death in the world (1). Percutaneous coronary intervention (PCI) is an effective treatment for CAD (2). However, there are still more than 30% of patients with DM after initial PCI who may experience major adverse cardiac and stroke events (MACE) during out-of-hospital treatment, including cardiovascular death, cardiac insufficiency, stroke, recurrent acute myocardial infarction, and other serious complications (3).
Relevant studies have shown that patients with diabetic kidney disease (DKD) have a higher risk of developing CAD. Among the hospitalized patients with CAD, the incidence of adverse events is higher in those with renal disease (4). In studies over the recent years, a large number of new test markers have been reported to predict the clinical prognosis of patients with CAD and type 2 DM. For example, the cystatin C or C-reactive protein (CRP) is a better indicator of the risk of CAD (5). However, there were few studies that focused on the prognosis of patients with CAD combined with DKD. Thus, we enrolled patients with DM and CAD after PCI and performed a long-term retrospective follow-up to excavate the relationship between the DKD and clinical outcomes. The Cox regressions were used as the main prediction model for data calculation.
Method
2
Study design and population
2.1
A total number of 892 patients with CAD complicated with DM were enrolled in this retrospective cohort study, and the data were collected from hospitalized inpatients at the First Affiliated Hospital of Zhengzhou University between January 2012 and December 2018. The inclusion criteria were patients with CAD including unstable angina pectoris, non-ST-elevated myocardial infarction, and ST-elevated myocardial infarction who had undergone coronary angiography (CAG) showing stenosis ≥80% and received stent implantation via PCI. According to the latest DM guidelines, a patient with DKD is defined as someone with chronic kidney disease caused by diabetes, with an estimated glomerular filtration rate (eGFR) <60 ml/(min/1.73 m^2^) and lasting for more than 3 months (6). Patients were excluded if they: (i) were lost to follow-up; or (ii) were with critical complications such as severe rheumatic heart disease, congenital heart disease, valvular heart disease, cardiomyopathy, acute infections, malignancies, hematological disease, and/or serious liver dysfunction. This study complied with the Declaration of Helsinki and the research protocol was approved by the Ethics Committee of the First Affiliated Hospital of Zhengzhou University (Approval number 2021-KY-0719). The details of the design and procedure are registered at http://www.chictr.org.cn (registration number: ChiCTR2200055450).
Demographic and clinical characteristics collection
2.2
We collected and documented the demographic data, contemporary comorbidities, and biochemical laboratory parameters for all patients, including: (i) age, body mass index (BMI), and gender (female); (ii) previously confirmed hypertension (HTN), smoking status, previous stroke, and heart failure history record; (iii) detections of high-density lipoprotein (HDL) cholesterol and low-density lipoprotein (LDL) cholesterol, urinary protein/creatinine ratio (UACR), blood serum creatinine (Scr), CRP, white blood cell (WBC), hemoglobin, and blood platelets (PLT); and (iv) management plan including antiplatelet, beta blocker, statin, hypoglycemic agent, antihypertensive drugs, and calcium channel blocker. Among these 24 baseline characteristics in Table 1 were regarded as the classic cardiovascular risk factors.
HTN was confirmed as an average systolic blood pressure of at least 140 mm Hg or an average diastolic blood pressure of at least 90 mm Hg or self-reported using of one or more varieties of antihypertensive medication in the past 14 days. Complying with the American Heart Association/American Diabetes Association (AHA/ADA) Scientific Statement (7), DM diagnostic criteria were positive in patients with glycated hemoglobin (A_1c_) ≥6.5% (48 mmol/mol) or fasting plasma glucose ≥126 mg/dl (7.0 mmol/L) or 2-h glucose ≥200 mg/dl (11.1 mmol/L) or in patients with random glucose ≥200 mg/dl (11.1 mmol/L) who showed classic symptoms of DM.
Endpoints
2.3
The primary endpoint was the MACE, including cardiovascular death events, all-cause death, hospitalization for acute cardiac insufficiency, recurrent myocardial infarction undergone PCI (re-AMI), readmission with chest pain, and stroke.
Recurrent myocardial infarction was diagnosed as a new electrocardiogram Q wave, and the plasma detection of creatine kinase MB and/or troponin I/T increased to more than threefold of the upper limit of the normal range within 48 h after the procedure (8). Stroke was defined as sudden onset of syncope, aphasia, and decreased level of consciousness, due to hemorrhage, embolism, or aneurysm rupture, that persisting for >24 h (9). All event incidences were verified by an event adjudication committee that was blinded to the group of participants.
Follow-up period
2.4
In this research, the median follow-up time was 3,000.0 days (384.0–3,000.0). The follow-up visits were performed by physicians in out-patient department offices or by telephone contacts, as necessary. The endpoint events were assessed at each follow-up visit. Flow chart of the study is shown in Figure 1.
The flowchart of the patients’ enrollment.
Statistical analyses
2.5
All analyses were performed using the SPSS 24.0 for Windows statistical software. The continuous variables were tested for normal distribution using the Mann–Whitney U test, and presented as mean ± standard deviation (SD). They were compared using two-tailed unpaired t tests; non-normal data were expressed as median (lower quartile, upper quartile). The categorical variables were demonstrated as numbers and percentages and compared using the two-tailed χ^2^ test, and presented as numbers (percentage). The Kaplan–Meier curves were framed for cumulative incidence rates of long-term outcomes and the log-rank test was used to compare variables between groups. Cox univariable regression analyses were used to collect the covariates with the DKD group, which were enrolled into the Cox multivariable regression when p < 0.1 (bold font in Tables 3–5); Cox multivariable regression analyses were performed to estimate the predictive value of the DKD group for outcomes, using backward stepwise regression. Hazard ratios (HRs) and 95% confidence intervals (CIs) were calculated, and p < 0.05 was considered statistically significant. Collinearity diagnostic test was used to certify whether there is a high correlation between independent variables in the Cox multivariable regression.
Results
3
Baseline demographic and clinical characteristics
3.1
As presented in Table 1, several variables showed significant differences between these two groups, including age (63.99 ± 10.89 vs. 54.91 ± 10.65, *p *< 0.001), BMI (24.27 ± 6.05 vs. 23.36 ± 6.21, *p *= 0.043), gender (female, 32.0% vs. 22.1%, *p *= 0.001), HTN (62.8% vs. 54.4%, *p *= 0.015), smoking status (35.2% vs. 46.8%, *p *= 0.001), stroke history (20.2% vs. 10.5%, *p *< 0.001), heart failure (69.7% vs. 55.4%, *p *< 0.001), duration of DM [10.0 (8.0–18.0) vs. 8.5 (8.0–11.0), *p *< 0.001], LDL (2.38 ± 0.93 vs. 2.53 ± 0.89, *p *= 0.020), UACR [703.97 (419.68–1,074.46) vs. 550.78 (416.56–861.71), *p *= 0.005], serum creatinine [88.00 (77.00–101.30) vs. 76.0 (56.00–72.00), p < 0.001], hemoglobin (129.30 ± 24.30 vs. 136.77 ± 20.07, *p *< 0.001), platelet (207.16 ± 61.04 vs. 223.28 ± 65.01, *p *< 0.001), antiplatelet (72.0% vs. 91.6%, *p *< 0.001), beta blocker (55.6% vs. 67.9%, *p *< 0.001), statin (79.3% vs. 93.2%, *p *< 0.001), antihypertensive drugs (50.2% vs. 64.2%, *p *< 0.001), and insulin 44.1% vs. 30.4%, *p *< 0.001. However, significant differences between the two groups were not found in HbA1c, HDL, CRP, WBC, hypoglycemic agent, and calcium channel blocker comparisons (all p > 0.05).
Clinical outcomes
3.2
As demonstrated in Table 2, the MACE incidents were less in the None DKD group vs. the DKD group (40.3% vs. 52.2%, p = 0.001). For the cardiovascular death events and all-cause death events, we found significant differences between the two groups (5.6% vs. 20.5%, *p *< 0.001; and 4.4% vs. 13.5%, *p *< 0.001). Significant differences between the two groups were not found in hospitalization for acute cardiac insufficiency, recurrent myocardial infarction undergone PCI, readmission with chest pain, and stroke.
As shown in Figures 2–4, the DKD group vs. the None DKD group's Kaplan–Meier curves were framed for cumulative incidence rates of long-term outcomes and the log-rank p < 0.001 between groups.
The DKD group vs. the None DKD group's Kaplan–Meier curves for MACE.
The DKD group vs. the None DKD group's Kaplan–Meier curves for cardiovascular death events.
The DKD group vs. the None DKD group's Kaplan–Meier curves for all-cause death events.
Univariable Cox regression
3.3
As presented in Table 3, all baseline characteristics were calculated in the MACE by univariable Cox regression analyses. We found that belonging to the DKD group, smoking status, HbA1c, duration of DM, hemoglobin, PLT, antiplatelet, and statin were predictors. Belonging to the DKD group is a risk factor and the HR of MACE was 1.419 (95% CI: 1.164–1.730, p = 0.001). Smoking status, HbA1c, duration of DM were also risk factors (HR = 1.198, 1.079, and 1.017; *p = *0.073, 0.006, and 0.024), and higher hemoglobin, higher PLT, antiplatelet medication group, and statin medication group were protective factors (HR = 0.995, 0.998, 0.763, and 0.666; *p = *0.034, 0.048, 0.041, and 0.004).
As presented in Table 4, all baseline characteristics were calculated in cardiovascular death events by univariable Cox regression analyses, and as a result, belonging to the DKD group, age, heart failure, duration of DM, creatinine, WBC, PLT, antiplatelet, beta blocker, statin, antihypertensive drugs and hypoglycemic agent were predictors. The DKD group is a risk factor and the HR of MACE was 3.951 (95% CI: 2.587–6.033, p < 0.001). Age, heart failure, duration of DM, creatinine, WBC were also risk factors (HR, all >1.0; p < 0.05), and PLT, antiplatelet, beta blocker, statin, antihypertensive drugs, and hypoglycemic agent were protective factors (all HR <1.0; p < 0.05).
As presented in Table 5, all baseline characteristics were calculated in all-cause death events by univariable Cox regression analyses, and as a result, belonging to the DKD group, age, HTN, smoking status, heart failure, creatinine, WBC, PLT, beta blocker, statin, antihypertensive drugs, hypoglycemic agent, insulin were predictors. The DKD group is a risk factor and the HR of MACE was 3.308 (95% CI: 2.019–5.420, p < 0.001). HTN, smoking status, heart failure, creatinine, WBC were also risk factors (HR all >1.0; p < 0.05), and PLT, beta blocker, statin, antihypertensive drugs, hypoglycemic agent, and insulin were protective factors (HR all <1.0; p < 0.05).
Multivariable Cox regression
3.4
In Table 6, after adjusting for univariable factors from Table 3 (Smoking status, HbA1c ≥ 9.0 mmol L^−1^, LDL ≥ 1.8 mmol L^−1^), compared with the patients in the None DKD group, in the DKD group the risk for MACE was elevated to 129.1% (HR = 1.291, 95% CI: 1.027–1.624, p = 0.029) in the multivariable model, and the DKD group was an independent predictor to the MACE in patients with CAD accompanied with DM after PCI. These four factors were not collinear [Variance Inflation Factor (VIF) < 5.0].
In Table 7, after adjusting for univariable factors from Table 4 (age ≥60 years, heart failure, statin, hypoglycemic agent), compared with the patients in the None DKD group, in the DKD group the risk for cardiovascular death events were elevated to 214.8% (HR = 2.148, 95% CI: 1.292–3.572, p = 0.003) in the multivariable model, and the DKD group was an independent predictor to the MACE in patients with CAD accompanied with DM after PCI. These five factors were not collinear (VIF < 5.0).
In Table 8, after adjusting for univariable factors from Table 5 (age ≥60 years, hypoglycemic agent), compared with the patients in the None DKD group, in the DKD group the risk for MACE was elevated to 222.9% (HR = 2.229, 95% CI: 1.325–3.749, p = 0.003) in the multivariable model, and the DKD group was an independent predictor to the all-cause death event in the patients with CAD accompanied with DM after PCI. These four factors were not collinear (VIF < 5.0).
Discussion
4
The prevalence of type 2 DM is increasing worldwide because of the increasing number of obese patients (10), DKD affects about 25% of patients with type 2 diabetes and is one of the leading cause of death in the world in high-income countries (11). In addition, patients with DKD have a very high cardiovascular risk, comparable with patients without DKD (12). In these patients, treatment with statins, angiotension-converting enzyme (ACE) inhibitors, or angiotensin-receptor blockers can delay the progression of kidney disease and reduce cardiovascular morbidity, whereas glucose-lowering therapy can prevent and delay the progression of DKD (13).
The main cause of death in patients with CKD and DM is cardiovascular death, which is caused by events such as stroke, sudden cardiac arrest, myocardial infarction, and other fatal complications. Numerous studies have shown that accelerated aging of blood vessels, valves, and the heart, characterized by soft tissue calcification, vascular wall degeneration, and myocardial fibrosis, is associated with mortality in patients with DM and CKD (14–16). Therefore, identification and management of risk factors for DKD, as well as timely diagnosis and treatment of the disease, are essential.
Extensive endothelial dysfunction, characterized by increased vascular permeability and inflammation (17), is a pathogenic mechanism underlying multiple microvascular and macrovascular complications of diabetes and is associated with cardiovascular mortality (17). In this study, we had found the DKD group HR indicates a 41.9% increase in the risk of MACE (HR = 1.419, 95% CI: 1.164–1.730, p = 0.001) in univariable Cox regression. After adjusting the co-variables, including smoking status, HbA1c ≥ 9.0 mmol L^−1^, LDL ≥ 1.8 mmol L^−1^, and the DKD group, the risk for MACE was elevated to 129.1% (HR = 1.376, 95% CI: 1.027–1.624, p = 0.029), thus the DKD group was an independent predictor to the risk of MACE event.
Consistent with these findings, for broadly defined renal failure [RF, refers to eGFR < 60 ml/(min/1.73 m^2^)] in patients with DM, Liosis et al. used a post hoc study to examine in-hospital term mortality in patients with acute coronary syndrome, and found that patients with both diabetes and RF had the highest mortality compared with other subgroups of patients (18). Compared with the no-DM and the no-RF subgroup, the odds ratios of DM without RF, DM with RF, RF without DM subgroups were: 1.62, 3.0, and 2.13, respectively. Watanabe et al. evaluated the RF in patients with left main distal bifurcation, and found that adverse outcomes were significantly higher in the severe RF group than that in the other groups (adjusted HR, 3.6) (19). They suggested that vigilance for the complications of DKD should be maintained when developing treatment strategies for patients after PCI, or other surgical procedures for coronary artery treatment, such as coronary artery bypass grafting (CABG) (20). Moreover, the increased risk is not only for CAD, but also for peripheral vascular diseases such as diabetic retinopathy or stroke (21).
In DKD, significant inflammation can be observed both in the beginning and ongoing stages of renal injury (22). Both systemic and local renal inflammatory responses were upregulated in DKD. Sapa et al. found that an inflammatory marker of renal filtration, asymmetric dimethylarginine (ADMA), had demonstrated a direct connection between low renal uremic solute clearance and the deterioration of cardiovascular death (23). In the diabetic state, high glucose and oxidative stress simultaneously induce the activation of the known inflammatory signaling molecule NF-κB (24), which triggers activation of the downstream effector iNOS, a promoter of oxidative stress and inflammation, leading to extensive nitrotyrosine in proteins (25). Sun et al. found that pharmacological inhibition of NF-κB signaling can prevent DKD (26).
There were limitations in this study, it was a single-center study with the limitation of regional selection, and the retrospective study caused limited data collection bias, which needs to be improved by future prospective studies. Therefore, further a prospective multi-center cohort study with a continuous estimation would improve the evidence level of evidence-based medicine. In conclusion, in this study we had found that DKD is an independent and novel predictor of long-term adverse outcomes in patients with CAD accompanied with DM who underwent PCI.
The reference list from the paper itself. Each links out to its DOI / PubMed record.
- 1Yahagi K Kolodgie FD Lutter C Mori H Romero ME Finn AV Pathology of human coronary and carotid artery atherosclerosis and vascular calcification in diabetes mellitus. Arterioscler Thromb Vasc Biol. (2017) 37(2):191–204. 10.1161/atvbaha.116.30625627908890 PMC 5269516 · doi ↗ · pubmed ↗
- 2Denktas AE Paniagua D Jneid H. Coronary physiology assessment for the diagnosis and treatment of stable ischemic heart disease. Curr Atheroscler Rep. (2016) 18(10):62. 10.1007/s 11883-016-0613-227686574 · doi ↗ · pubmed ↗
- 3Huang Z Chan TM Dong W. MACE prediction of acute coronary syndrome via boosted resampling classification using electronic medical records. J Biomed Inform. (2017) 66:161–70. 10.1016/j.jbi.2017.01.00128065840 · doi ↗ · pubmed ↗
- 4Ferrannini G Manca ML Magnoni M Andreotti F Andreini D Latini R Coronary artery disease and type 2 diabetes: a proteomic study. Diabetes Care. (2020) 43(4):843–51. 10.2337/dc 19-190231988066 · doi ↗ · pubmed ↗
- 5Rifai N Ridker PM. High-sensitivity C-reactive protein: a novel and promising marker of coronary heart disease. Clin Chem. (2001) 47(3):403–11. 10.1093/clinchem/47.3.40311238289 · doi ↗ · pubmed ↗
- 6American Diabetes Association. 2. Classification and diagnosis of diabetes: standards of medical care in diabetes—2020. Diabetes Care. (2020) 43(Suppl 1):S 14–31. 10.2337/dc 20-S 00231862745 · doi ↗ · pubmed ↗
- 7American Diabetes Association. Classification and diagnosis of diabetes: standards of medical care in diabetes—2018. Diabetes Care. (2018) 41(Suppl 1):S 13–27. 10.2337/dc 18-S 00229222373 · doi ↗ · pubmed ↗
- 8Li SJ Ge Z Kan J Zhang JJ Ye F Kwan TW Cutoff value and long-term prediction of clinical events by FFR measured immediately after implantation of a drug-eluting stent in patients with coronary artery disease: 1- to 3-year results from the DKCRUSH VII registry study. JACC Cardiovasc Interv. (2017) 10(10):986–95. 10.1016/j.jcin.2017.02.01228456699 · doi ↗ · pubmed ↗