SPINK1 Overexpression Correlates with Hepatocellular Carcinoma Treatment Resistance Revealed by Single Cell RNA-Sequencing and Spatial Transcriptomics
Chunyuan Yang, Limei Guo, Juan Du, Qiulu Zhang, Lingfu Zhang

TL;DR
This study shows that high SPINK1 levels in liver cancer cells are linked to poor treatment outcomes and resistance to therapies.
Contribution
The study reveals SPINK1's role in promoting treatment resistance through increased drug metabolism gene activity.
Findings
High SPINK1 expression correlates with poor prognosis and reduced therapy sensitivity in hepatocellular carcinoma.
SPINK1-high cells show increased activity in drug metabolic pathways, including CES2 and CYP3A5.
SPINK1 overexpression promotes resistance to sorafenib and oxaliplatin by inducing drug metabolism regulators.
Abstract
Low efficacy of treatments and chemoresistance are challenges in addressing refractory hepatocellular carcinoma (HCC). SPINK1, an oncogenic protein, is frequently overexpressed in many HCC cases. However, the impact of SPINK1 on HCC treatment resistance remains poorly understood. Here, we elucidate the functions of SPINK1 on HCC therapy resistance. Analysis of SPINK1 protein level reveals a correlation between elevated SPINK1 expression and unfavorable prognosis. Furthermore, intercellular variations in SPINK1 expression levels are observed. Subsequent examination of single cell RNA-sequencing data from two HCC cohorts further suggest that SPINK1-high cells exhibit heightened activity in drug metabolic pathways compared to SPINK1-low HCC cells. High SPINK1 expression is associated with reduced sensitivities to both chemotherapy drugs and targeted therapies. Moreover, spatial…
Genes, proteins, chemicals, diseases, species, mutations and cell lines named across the full text — each resolved to its canonical identifier and authoritative record.
Click any figure to enlarge with its caption.
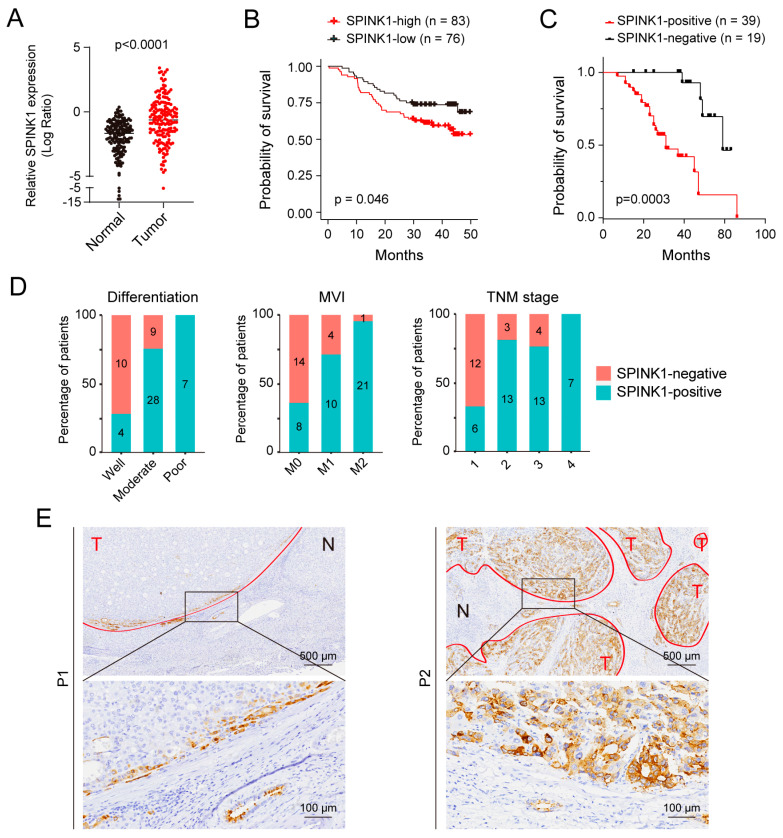 Figure 1
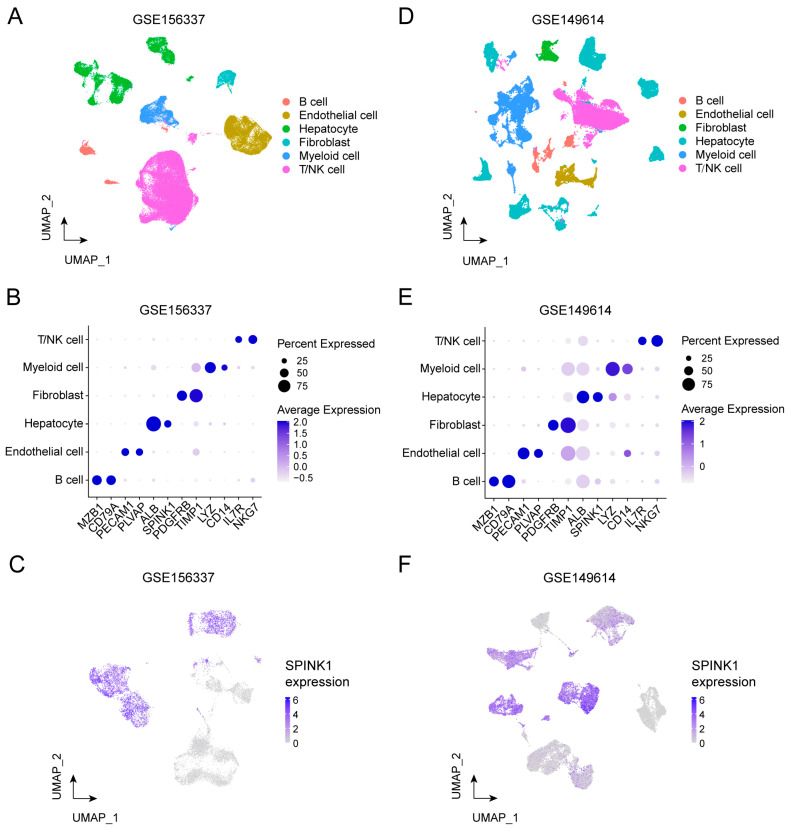 Figure 2
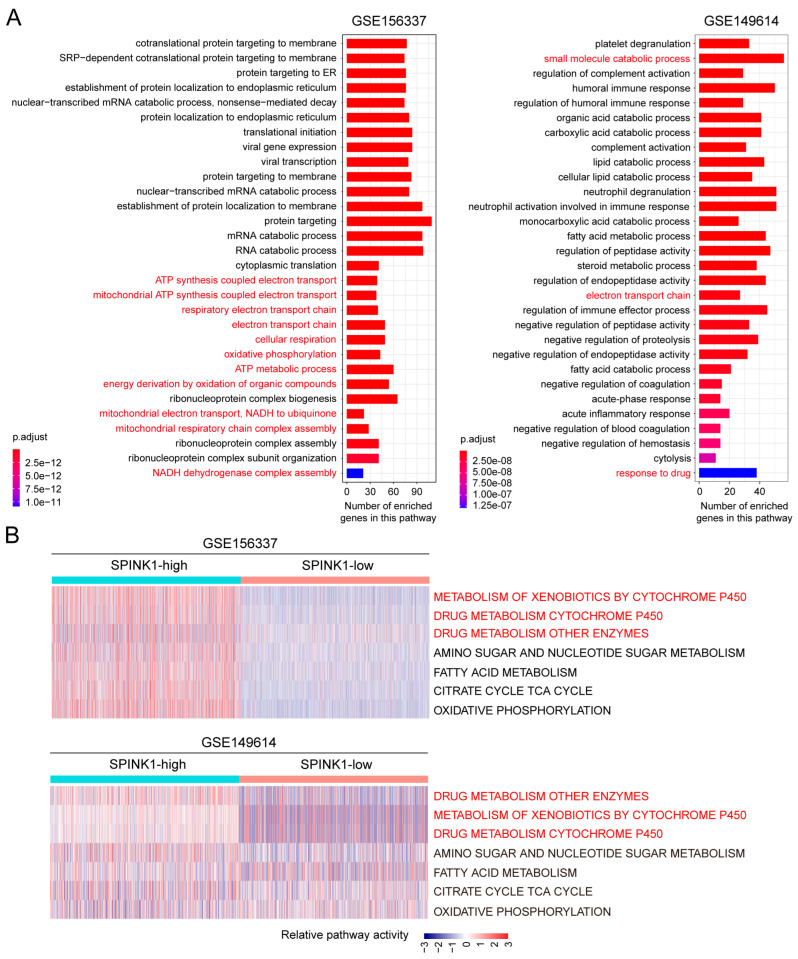 Figure 3
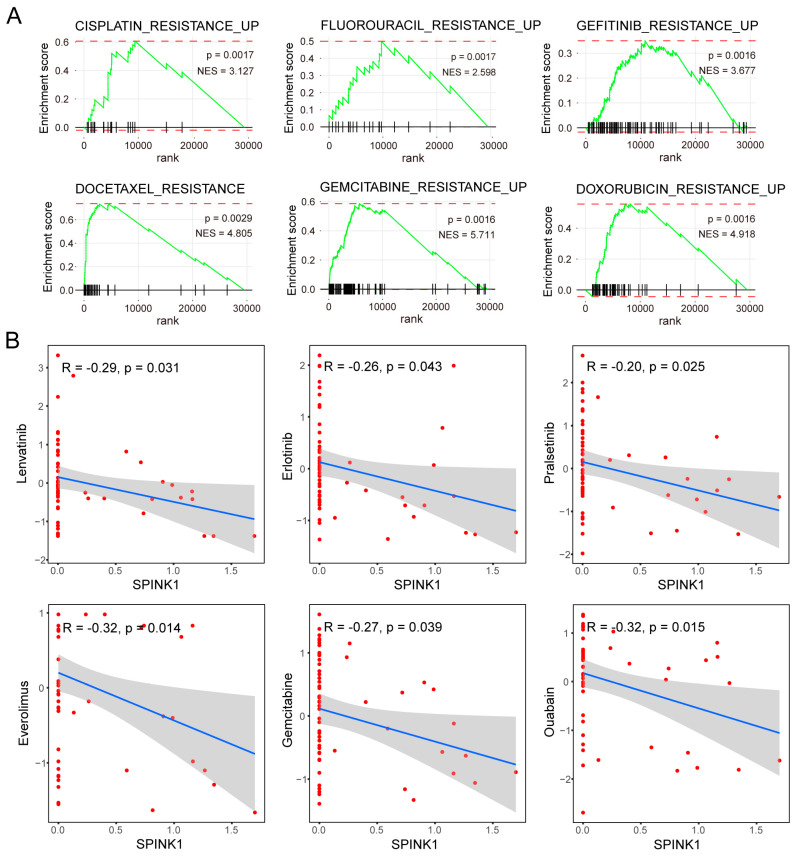 Figure 4
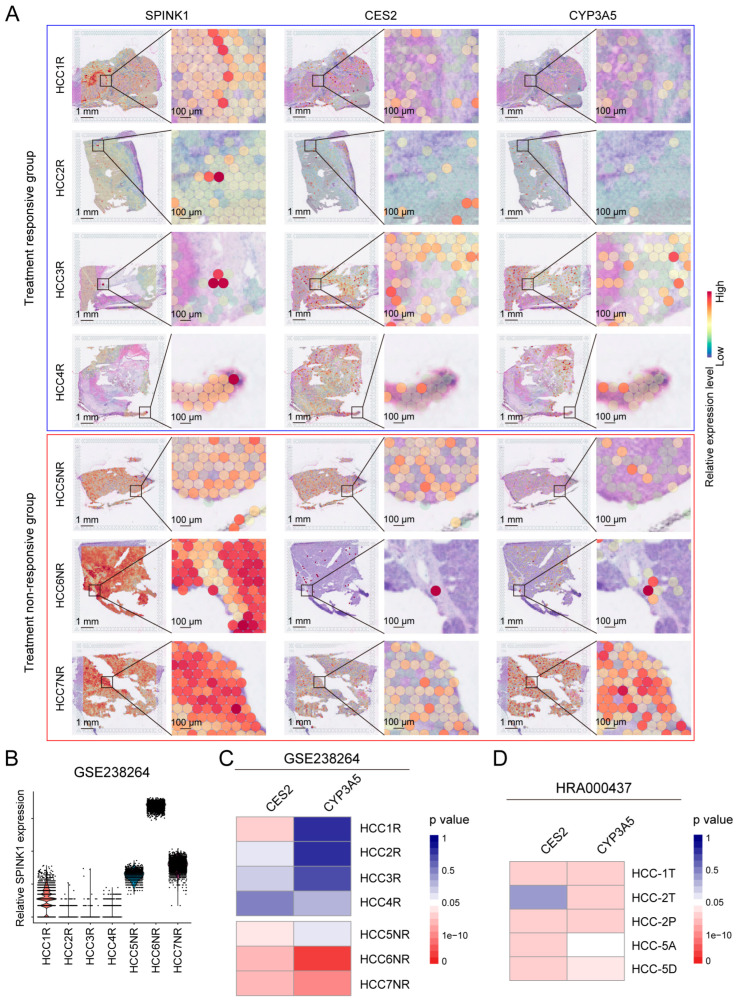 Figure 5
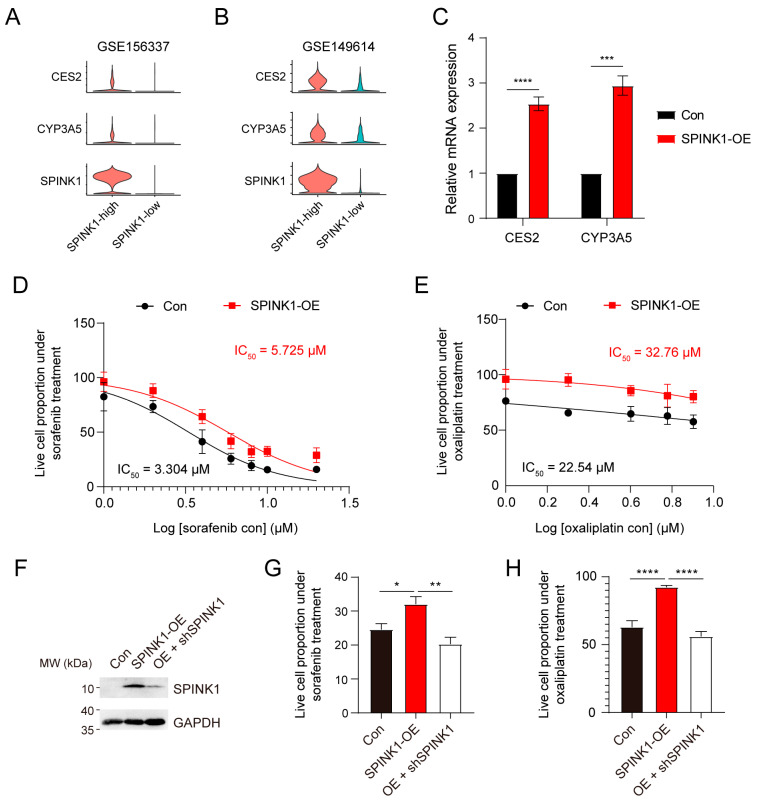 Figure 6
- —National Natural Science Foundation of China
- —Beijing Municipal Science and Technology Commission
- —Shu Fan Education and Research Foundation
Peer Reviews
No public reviews on file for this paper yet. If you reviewed it on a platform where reviews are public (OpenReview, ICLR, NeurIPS, ICML), you can paste yours below so the community can read it here.
Videos
No videos yet. Explain this paper in a talk, walkthrough, or lecture? Add one.
Taxonomy
TopicsHistorical Art and Architecture Studies · Architecture and Art History Studies · Historical Studies of Medieval Iberia
1. Introduction
Liver cancer ranks as the third cause of mortality of all malignancies, and 90% of liver cancers are hepatocellular carcinoma (HCC) [1,2]. The overall prognosis of HCC is heavily reliant on the tumor stage. Following the Barcelona Clinic Liver Cancer (BCLC) staging system, HCC patients are categorized into very early stage, early stage, intermediate stage, late stage, and terminal stage. Patients in the very early stage benefit from resection and local ablation, while those in the intermediate stage are suitable candidates for trans-arterial chemoembolization. Patients in the advanced stage are considered for systemic therapies [3,4]. Despite advances in targeted therapies and immune checkpoint blockade, the major obstacle to HCC treatment remains the low response rate [5]. Therefore, it is imperative to explore the mechanisms of chemoresistance to enhance treatment effectiveness and extend the prognosis for HCC patients.
Serine peptidase inhibitor Kazal type 1 (SPINK1) is a secretory protein that plays important roles in various physiological processes, including pancreatic functions, sperm maturation, and skin barrier homeostasis [6]. Notably, SPINK1 also assumes critical functions in cancer pathogenesis, and has been identified as dysregulated in many tumor types, including HCC [7]. In the context of HCC, the expression level of SPINK1 has been observed to escalate with the progression of HCC [8]. Elevated levels of serum SPINK1 show promise as a diagnostic indicator for HCC [9].
Mechanistically, SPINK1 has been implicated in tumor cell proliferation and metastasis through the MEK/ERK signaling pathway [10,11]. Moreover, a high expression of SPINK1 is associated with the presence of portal vein tumor thrombus and is indicative of a poorer prognosis for patients [12,13]. However, the precise impact of SPINK1 on HCC therapy remains unclear.
Here, employing a combination of bioinformatics and experimental validations, we elucidate the pivotal roles of SPINK1 in conferring therapy resistance in HCC. We initially assembled an HCC cohort and performed immunohistochemistry (IHC) to detect the histological heterogeneity of SPINK1 expression. The application of single cell RNA-sequencing (scRNA-seq) not only mitigated the confounding effects of tumor heterogeneities, but also facilitated the delineation of SPINK1 functions at the single cell level. This approach enabled the identification of active drug detoxification pathways in cells with elevated SPINK1 expression.
Furthermore, the incorporation of spatial transcriptomics (ST) allowed for in situ validations for SPINK1 functional mechanisms by revealing the co-localization of SPINK1 with key regulators of drug metabolism. Collectively, our findings shed light on the crucial regulatory functions of SPINK1 in fostering treatment resistance in HCC. These insights not only enhance our understanding of the underlying mechanisms but also present SPINK1 as a promising therapeutic target for overcoming HCC treatment challenges.
2. Materials and Methods
2.1. SPINK1 Protein Expression Level Detection in HCC
The expression data of SPINK1 were obtained from the Clinical Proteomic Tumor Analysis Consortium (CPTAC) database “https://proteomic.datacommons.cancer.gov/pdc/browse (accessed on 8 February 2024)” [14]. The original liver cancer data, including experimental protocols and analysis methods, were sourced from a previously published HCC cohort [15] (cohort 1, Supplementary Table S1).
2.2. HCC Cohort Collection
Our study was approved by the Ethics Committee of Peking University Third Hospital. All research was conducted in accordance with both the Declarations of Helsinki and Istanbul. Liver cancer patients who underwent surgery at the Department of General Surgery of the Peking University Third Hospital were enrolled based on the following criteria: (1) pathologically confirmed HCC; (2) no history of other malignancies; and (3) no anti-cancer therapy before surgery. All patients were provided with comprehensive information and their identities were kept confidential.
A total of 58 surgical specimens from primary HCC cases, resected at the Peking University Third Hospital, constituted cohort 2. For each tumor, the gross and microscopic findings were meticulously reviewed by two pathologists in a blinded fashion. Tumors were categorized based on histological type, differentiation grade, and stage following the WHO Classification of Tumors (2019).
2.3. IHC Staining
Formalin-fixed and paraffin-embedded 4-µm tissue sections were used for IHC staining. In a stepwise process, sections underwent dehydration with graded concentrations of ethanol and were immersed in 3% hydrogen peroxide for 15 min to block endogenous peroxidase activity. Antigen retrieval was performed by heating the sections for 2 min in a pressure cooker using 0.01 M citrate buffer (pH 6.0). Subsequently, the sections were incubated overnight at 4 °C with primary antibodies against SPINK1 (Abcam, Cambridge, UK). For the secondary antibody, either the histidine Envision Chem Detection Kit (Agilent Dako, Santa Clara, CA, USA) or GTVision^TM^ Double Staining Detection System (Agilent Dako, Santa Clara, CA, USA) was used. The chromogen used was 3,3-diaminobenzidine/hydrogen peroxide. As a negative control, PBS was substituted for the primary antibody.
2.4. Analysis of scRNA-Seq Data
Our scRNA-seq data from HCC samples were sourced from the Gene Expression Omnibus (GEO) database (GSE156337 and GSE149614). We used a two-step method to analyze the functions of SPINK1 in tumor cells of HCC.
In the first step, analysis of cells in these two cohorts involved normalization, reduction, unsupervised clustering, and annotation. LogNormalize was used for normalization, and PCA served as the reduction method. Standard procedures as described in https://satijalab.org/seurat/ (accessed on 8 February 2024) were followed for cell clustering. Cell types were annotated using SingleR (V1.4.1) with the reference “Human Primary Cell Atlas Data Labels”. The resulting cell identities were classified as B cell, endothelial cell, hepatocyte, fibroblast, myeloid cell, and T/NK cell.
In the second step, the hepatocyte cluster was isolated, and cells from normal tissues were filtered out. Only cells from tumor tissues were retained, assuming these malignant hepatocytes represented tumor cells. Subsequently, using unsupervised clustering, these tumor cells were re-clustered into 39 sub-clusters in cohort 3 and 38 sub-clusters in cohort 4. In cohort 3, tumor sub-clusters numbered 5, 7, 8, 11, 12, 14, 17, 18, 19, 20, 21, 22, 23, 24, 27, 28, 29, 30, 31, 32, and 33 exhibited elevated SPINK1 expression, leading us to integrate these sub-clusters as SPINK1-high HCC cells. The remaining sub-clusters were consolidated as SPINK1-low HCC cells. In cohort 4, tumor sub-clusters numbered 2, 5, 6, 7, 8, 12, 14, 15, 17, 18, 19, 21, 22, 24, 27, 30, 32, 34, and 35 demonstrated high SPINK1 expression, promoting the integration of these sub-clusters as SPINK1-high HCC cells. The remaining sub-clusters were integrated as SPINK1-low HCC cells.
2.5. Gene Set Enrichment Analysis and Gene Set Variation Analysis
We compiled multiple drug resistance pathways, such as the cisplatin resistance pathway, fluorouracil resistance pathway, gefitinib resistance pathway, doxorubicin resistance pathway, gemcitabine resistance pathway, docetaxel resistance pathway, trabectedin resistance pathway, and tamoxifen resistance pathway, from MSigDB (http://www.gsea-msigdb.org/gsea/msigdb (accessed on 8 February 2024)). To assess the enrichment of DEGs for SPINK1-high cells within these gene sets, we employed Gene Set Enrichment Analysis (GSEA).
Furthermore, Gene Set Variation Analysis (GSVA) was utilized to assess distinct metabolic states in SPINK1-high and SPINK1-low cells through the R package GSVA. Significantly perturbed pathways were identified through the R package Limma, with a Benjamini–Hochberg-corrected p-value threshold set at ≤0.01.
2.6. Drug Sensitivity Analysis
The gene expression level of SPINK1 in various cell lines and their respective drug sensitivities were obtained from CellMiner (NCI-60) (https://discover.nci.nih.gov/cellminer (accessed on 8 February 2024)). The correlation between SPINK1 expression levels and drug sensitivities were assessed using R package ggplot2. The statistical significance of these correlation was determined through Pearson’s correlation analysis, with a significance threshold set at p ≤ 0.05.
2.7. Analysis of ST Data
ST data were utilized to identify the co-expression pattern of SPINK1 with CES2 and CYP3A5. The significant of gene co-expression was determined through Spearman correlation analysis, and p values ≤ 0.05 were considered to be significantly co-expressed.
2.8. Quantitative Real-Time PCR
After isolation using TRIzol reagent (Invitrogen, Cat# 15596026), mRNA was reverse transcribed into cDNA using all-in-one 5 MasterMix (abm, Cat# G592), followed by quantitative real-time PCR analysis (TransGene, Cat# AQ132-21). Quantitative real-time PCR primers include CES2 (F, CATGGCTTCCTTGTATGATGGT; R, CTCCAAAGTGGGCGATATTCTG), CYP3A5 (F, GGTGGTGATTCCAACTTATGCT; R, GCGTGTCTAATTTCAAGGGGA), and ACTB (F, TGACCCAGATCATGTTTGAG; R, TTAATGTCACGCACGATTTCC). The Ct value of each detected cDNA was normalized to that of ACTB.
2.9. SPINK1 Overexpression and Western Blot Analysis
To stability overexpress SPINK1 in PLC/PRF/5 cells, pCDH CMV puro (control) or pCDH SPINK1 (overexpression) plasmids, coupled with pMD.2G and pAX.2 plasmids, were co-transfected into HEK293 cells. 48 h later, the supernatant combined with polybrene (10 μg/mL) was transferred to the PLC/PRF/5 cell culture system and, 24 h later, the successfully transfected cells were screened using puromycin (5 μg/mL).
In Western blot analysis, PLC/PRF/5 cells were lysed in RIPA lysis buffer (50 mM Tris-HCl (pH = 7.4), 150 mM NaCl, 1 mM EDTA, 5 mM EGTA, 1% NP40, and 0.1% sodium deoxycholate) supplemented with a ‘cocktail’ of protease inhibitors. Cell lysates were subjected to SDS–PAGE and immunoblot analysis was performed using antibodies against GAPDH (Ray Antibody, Cat# RM2002) and SPINK1 (Abcam, Cat# ab206294).
2.10. Stable Short Hairpin RNA Knockdown of SPINK1
The shSPINK1 sequence was 5′-CCCTGTTGAGTCTATCTGGTA-3′. To generate shSPINK1 lentivirus, pMD.2G, pAX.2, and pLKO.1 were co-transfected into the HEK293 cells. Then, 48 h later, the supernatant combined with polybrene (10 μg/mL) was transferred to the SPINK1 overexpressed PLC/PRF/5 cell culture system. After 24 h, the supernatant combined with polybrene (10 μg/mL) was once again transferred to the SPINK1 overexpressed PLC/PRF/5 cell culture system to enhance the knockdown effectiveness.
2.11. Chemoresistance Analysis
PLC/PRF/5 cells, including control cells and SPINK1 overexpression cells, were seeded into 96-well plates. Subsequently, these cells were exposed to sorafenib (at concentrations of 0, 1, 2, 4, 6, 8, 10, and 20 μM) or oxaliplatin (at concentrations of 0, 1, 2, 4, 6, and 8 μM) for 24 h, independently. Drug sensitivity was analyzed by measuring the survival cell proportions under each condition using CCK-8 assay (BeijingWJLZ biotechnology, Cat# WJ30025) in accordance with the manufacturer’s instructions. Survival cell proportions in both control group and SPINK1 overexpression group are normalized to that in cells treated with 0 μM sorafenib or oxaliplatin, respectively.
To detect the effectiveness of SPINK1 knockdown on chemoresistance, control PLC/PRF/5 cells (con), SPINK1 overexpressed PLC/PRF/5 cells (SPINK1-OE), and SPINK1 overexpression followed by gene expression knockdown PLC/PRF/5 cells (OE + shSPINK1) were exposed to 8 μM sorafenib or oxaliplatin for 24 h. Survival cell proportion assessments were conducted as previously described.
2.12. Statistics
The comparisons of SPINK1 protein expression levels between tumor and non-tumoral normal tissue as well as the CCK-8 assay results were performed using unpaired Student’s t-test, and data are represented as means ± standard error of mean. Patient survival analysis was performed using the log-rank (Mantel-Cox) test. GSVA was conducted through a Kolmogorov–Smirnov-like random walk test. The GSEA was performed using the Wilcoxon–Mann–Whitney test. Drug sensitivity was analyzed using the Chi-square test. Gene co-expression of SPINK1 with CES2 and CYP3A5 was performed using Spearman’s correlation analysis. All statistical analyses were performed by R 4.3.2 or GraphPad Prism 10, and differences were considered significant when p < 0.05.
3. Results
3.1. The Protein Level of SPINK1 Correlates with HCC Malignancy
While numerous reports have highlighted the association between elevated SPINK1 mRNA levels and worse HCC prognosis [16], investigations on SPINK1 protein levels are relatively scarce. To detect the protein expression level of SPINK1 in HCC patients, we searched SPINK1 protein expression levels in HCC cohort 1 (Supplementary Table S1) and found higher SPINK1 protein levels in tumor samples than peritumoral normal tissues (Figure 1A). Higher SPINK1 levels in HCC patients correlated with worse prognosis (Figure 1B), suggesting the critical functions of SPINK1 on HCC progression. To delve into the clinic-pathological relevance of SPINK1, we collected an HCC cohort consisting of 58 treatment-naïve patients (cohort 2, Supplementary Table S1) and performed IHC staining of SPINK1 on these samples. We found that patients with high protein levels of SPINK1 showed worse prognosis than those with low protein levels of SPINK1 (Figure 1C).
Through an assessment of the correlation between SPINK1 expression status and various pathological features, including tumor size, differentiation status, microvascular invasion (MVI), capsular invasion, virus infection background, TNM stage, and TP53 status (Table 1), we found that a higher SPINK1 protein level correlates with a poorer tumor differentiation status, MVI status, and higher TNM stage (Figure 1D). Intriguingly, the expression of SPINK1 in tumor nodules is not homogeneous (Figure 1E), suggesting cellular heterogeneity of SPINK1 expression levels.
3.2. Transcriptomic Profiles of SPINK1-High Tumor Cells Revealed by scRNA-Seq Data
To assess cellular transcriptomic heterogeneity and explore SPINK1 functions at the single cell level, we utilized two HCC scRNA-seq datasets, namely, cohort 3 and cohort 4 (Supplementary Table S1) [17,18]. Analyzing all cells in cohort 3 identified six cell clusters: B cell, endothelial cell, hepatocyte, fibroblast, myeloid cell, and T/NK cell (Figure 2A). Specifically expressed marker genes of each cell clusters further verified the accuracy of our cell type annotation (Figure 2B). Upon re-analysis of the tumor cell cluster in cohort 3, 39 sub-clusters were identified (Supplementary Figure S1A,B), among which SPINK1 showed variable expression levels (Figure 2C). Given the elevated expression levels of SPINK1 in sub-clusters numbered 5, 7, 8, 11, 12, 14, 17, 18, 19, 20, 21, 22, 23, 24, 27, 28, 29, 30, 31, 32, and 33 (Supplementary Figure S1C), we integrated these sub-clusters as SPINK1-high HCC cells and integrated the remaining sub-clusters as SPINK1-low HCC cells.
Additionally, using identical procedures, we conducted scRNA-seq data analysis in cohort 4. The cell clustering approach identified six clusters, designated as B cell, endothelial cell, fibroblast, hepatocyte, myeloid cell, and T/NK cell (Figure 2D). The expression levels of marker genes aligned with the cell annotation results (Figure 2E), affirming the accuracy of our cell type identification. Subsequently, we focused on the malignant hepatocyte component among all cell types, revealing variable SPINK1 expression levels in hepatocytes (Figure 2F). Further re-clustering of hepatocytes yielded 38 sub-clusters (Supplementary Figure S2A,B), with sub-clusters 2, 5, 6, 7, 8, 12, 14, 15, 17, 18, 19, 21, 22, 24, 27, 30, 32, 34, and 35 showing high SPINK1 expression levels (Supplementary Figure S2C). Consequently, we consolidated these sub-clusters into SPINK1-high cells, while the remaining sub-clusters were grouped as SPINK1-low cells.
3.3. Active Drug Metabolism of SPINK1-High Cells
To investigate the functions of SPINK1, we examined the differentially expressed genes (DEGs) between SPINK1-high and SPINK1-low cells in cohort 3 and cohort 4, independently. Signaling pathway enrichment analysis of DEGs in SPINK1-high cells from cohort 3 revealed multiple metabolism pathways in the top 30 enriched signaling pathways, including cellular oxidative pathways (Figure 3A, left, highlighted in red). Signaling pathway enrichment analysis of DEGs in SPINK1-high cells from cohort 4 identified many drug-related responsive pathways in the top 30 enriched signaling pathways (Figure 3A, right, highlighted in red). These findings suggest that SPINK1 may be involved in drug metabolism in HCC.
To systematically assess the metabolic characteristics of SPINK1-high cells, we introduced a 70-pathway metabolic panel [19]. In cohort 3, SPINK1-high cells showed higher activation at oxidative phosphorylation pathway, glutathione metabolism pathway, metabolism of xenobiotics by cytochrome P450 pathway, drug metabolism cytochrome P450 pathway, and drug metabolism other enzymes pathway, compared with SPINK1-low cells (Figure 3B, upper, and Supplementary Figure S3, highlighted in red). Similarly, SPINK1-high cells in cohort 4 also showed stronger activities in drug metabolic pathways, including drug metabolism cytochrome P450 pathway, metabolism of xenobiotics by cytochrome P450 pathway, and drug metabolism for other enzymes, compared with SPINK1-low cells (Figure 3B, lower, and Supplementary Figure S4, highlighted in red). Analysis of the metabolic status using another 93-pathway metabolic panel [20] yielded similar results (Supplementary Figures S5 and S6, highlighted in red). Collectively, these findings strongly suggested a drug detoxification function of SPINK1.
Subsequently, we conducted GSEA on the DEGs of SPINK1-high cells and found significant enrichment of these DEGs on multiple drug resistance pathways. In cohort 3, the DEGs of SPINK1-high cells versus SPINK1-low cells demonstrated enrichment in pathways associated with cisplatin resistance, fluorouracil resistance, gefitinib resistance, docetaxel resistance, gemcitabine resistance, doxorubicin resistance, trabectedin resistance, and tamoxifen resistance (Figure 4A, and Supplementary Figure S7A). In cohort 4, the DEGs of SPINK1-high cells versus SPINK1-low cells were enriched in cisplatin resistance and tamoxifen resistance pathways (Supplementary Figure S7B). Furthermore, a high level of SPINK1 expression negatively correlates with the sensitivity of various targeted drugs and chemotherapy drugs, including lenvatinib, erlotinib, pralsetinib, everolimus, gemcitabine, and ouabain (Figure 4B). Collectively, these data indicate resistance to multiple chemotherapy drugs and targeted drugs in SPINK1-high HCC cells.
3.4. Treatment Resistance of SPINK1-High Cells Revealed by ST
To probe into the roles of SPINK1 in systematic HCC treatments, we introduced a ST dataset (cohort 5, Supplementary Table S1) collected from HCC patients treated with neoadjuvant cabozantinib and nivolumab [21]. Based on the effectiveness of tumor treatments, patients in cohort 5 were categorized into the responsive group (HCC1R, HCC2R, HCC3R, and HCC4R) and the non-responsive group (HCC5NR, HCC6NR, and HCC7NR). Notably, the expression levels of SPINK1 were higher in the non-responsive group than in the responsive group (Figure 5A,B), supporting the correlation between high SPINK1 expression and HCC therapy resistance.
In order to explore the underlying mechanisms of treatment resistance in SPINK1-high cells, we first detected oncogenic pathways, and found higher activities of oncogenic signaling, including PI3K/AKT signaling, IL6 signaling, and β-catenin signaling, in SPINK1-high cells than SPINK1-low cells (Supplementary Figure S8). Given the indicating roles of these signaling pathways on immune checkpoint inhibitor treatment resistance [22,23,24], the activation of these pathways in SPINK1-high cells helps to explain the therapy resistance phenotypes. Moreover, we screened all genes in three drug detoxification pathways (drug metabolism cytochrome P450 pathway, metabolism of xenobiotics by cytochrome P450 pathway, and drug metabolism other enzymes) for highly expressed genes in SPINK1-high cells compared with SPINK1-low cells in cohort 3 and cohort 4. This yielded seven potential regulators, AKR1C1, AKR1C3, CES2, CYP3A5, GSTK1, MGST3, and UGT2B4 (Supplementary Figure S9). Subsequent co-expression analysis between SPINK1 and these seven regulators was performed (Supplementary Table S2). To facilitate detoxification functions, potential regulators were expected to be correlated with SPINK1 expression level at the same cell. Therefore, we sought genes that co-expressed with SPINK1 in the same spot of ST data. The result indicated that SPINK1 expression levels correlated with the expression of CES2 and CYP3A5, which are critical drug metabolic genes that have been proved to elicit treatment resistance in many types of cancers [25], in most cases in the treatment non-responsive group (HCC5NR, HCC6NR, and HCC7NR) (Figure 5C). This result suggested that SPINK1-high cells may facilitate drug detoxification through CES2 and CYP3A5. Additionally, another ST dataset (cohort 6, Supplementary Table S1) [26] was introduced to confirm the co-expression between SPINK1 and CES2, as well as CYP3A5 (Figure 5D). Collectively, through ST data analysis, CES2 and CYP3A5 were identified as potential regulators of therapy resistance in SPINK1-high cells.
3.5. SPINK1 Overexpression Induces Chemoresistance in HCC
Considering the elevated expression levels of CES2 and CYP3A5 in SPINK1-high cells compared to SPINK1-low cells (Figure 6A,B), we proceeded to investigate the relationship between SPINK1 expression and CES2, as well as CYP3A5 expression, using quantitative real-time PCR. Compared with control cells, HCC cell line PLC/PRF/5 overexpressed with SPINK1 (Supplementary Figure S10) exhibited higher levels of CES2 and CYP3A5 (Figure 6C). This suggests that SPINK1 overexpression induces the expression of CES2 and CYP3A5. Furthermore, to validate the chemotherapy resistance of SPINK1-high cells, we used sorafenib and oxaliplatin, two representative first-line drugs for HCC. In comparison to control cells, PLC/PRF/5 cells overexpressed with SPINK1 exhibited a higher survival proportion under sorafenib (Figure 6D) or oxaliplatin (Figure 6E) treatment, indicating a stronger treatment resistance in SPINK1-high cells. Moreover, to further confirm the treatment resistance of SPINK1, we used shRNA to knockdown the expression level of SPINK1 in SPINK1-overexpressed cells (Figure 6F) and detected the treatment sensitivities of these cells. The result showed that knockdown of SPINK1 attenuated the resistance of SPINK1-overexpressed cells under sorafenib (Figure 6G) or oxaliplatin (Figure 6H) treatments. These results collectively indicate the chemoresistance roles of SPINK1.
4. Discussion
HCC is the third leading cause of mortality among malignancies, presenting a formidable challenge in therapeutic intervention [1]. Current first-line treatment strategies for HCC involve a combination of molecular targeted therapies such as sorafenib and lenvatinib, alongside traditional cytotoxic chemotherapy [27,28,29]. However, the emergence of chemoresistance significantly impedes the efficacy of these treatments. Although immunotherapies, particularly immune checkpoint inhibitors, like anti-programmed death receptor-1 (PD-1) and anti-cytotoxic T-lymphocyte antigen-4 (CTLA-4) antibodies, have shown promise in pre-clinical studies [30], their effectiveness in HCC remains limited, with less than 30% of tumors exhibiting prolonged survival upon PD-1 antibody treatment [31]. The combinational use of PD-1 and CTLA-4 inhibitors in advanced HCC patients has not yet been confirmed in phase III clinical trials [32,33]. Although previous articles have attributed the immune checkpoint blockade resistance to high activities of oncogenic signaling pathways, including PI3K/AKT signaling pathway, IL6 signaling pathway, and β-catenin signaling pathway [22,23,24], our study provides a more accessible effectiveness evaluation method by detecting the expression level of SPINK1 in tumors.
SPINK1 is an oncogenic protein that is overexpressed in various tumors, including HCC [6,7]. Previous investigations into SPINK1 have primarily focused on bulk tumors [16,34]. However, due to the significant inter-tumoral and intra-tumoral heterogeneity of HCC, a detailed exploration of SPINK1 at single cell level is urgently needed. Our study innovatively combines scRNA-seq and ST to investigate SPINK1 functions. The application of scRNA-seq reduces intra-tumoral transcriptomic heterogeneity, thereby classifying cells based on SPINK1 expression levels. High throughput sequencing enables the profiling of metabolic characteristics in SPINK1-high cells, leading to the discovery of drug resistance features. To be noted, the scRNA-seq data in our study comprise two HCC cohorts with different sample origins. Specifically, samples in cohort 3 were exclusively derived from primary HCC tumors, whereas samples in cohort 4 encompass primary sites, portal vein tumor thrombus, and metastatic lymph nodes. The considerable diversity in sample origins and characteristics imply substantial transcriptomic differences between these two cohorts. In cohort 3, we observed significantly higher activities of glucose metabolism, lipid metabolism, and amino acid metabolism in SPINK1-high cells compared with SPINK1-low cells, whereas such differences were less evident in cohort 4. Importantly, regardless of the intra-cohort transcriptomic differences, treatment resistance in SPINK1-high cells is consistent in these cohorts, suggesting the reliability of our observation in a wide range of clinical cohorts. Additionally, the use of ST on HCC tissues not only validates scRNA-seq results, but also introduces histological information. Given the dynamic nature of metabolites, sharing chemotherapy drugs and metabolic enzymes within the tumor niche is plausible. Therefore, the 55-μm diameter spots on ST chips serves as ideal units for studying the metabolic microenvironment. In our study, cells in SPINK1-high spots share metabolites with surrounding cells, suggesting that seeking drug-resistant regulators in the SPINK-high niche using ST data may yield more reliable results than scRNA-seq.
Through a combination of bioinformatics and experimental validations, we have identified SPINK1 as a promising indicator of HCC treatment effectiveness. A high expression level of SPINK1 in HCC cells may predict poor responsiveness to treatments, including cytotoxic chemotherapy drugs, molecular targeted therapeutic agents, and immune checkpoint inhibitors. Conversely, the treatment insensitivity of SPINK1-high cells strongly suggests that targeting SPINK1 could enhance treatment effectiveness.
Comprehensive bioinformatic and experimental analyses have unveiled the co-expression patterns of SPINK1 with CES2 and CYP3A5 in HCC. Mechanistically, SPINK1 overexpression has been found to induce ERK phosphorylation [11]. The activation of ERK signaling pathway subsequently enhances the function of HNF4α [35], a confirmed transcription factor for CES2 [36] and CYP3A5 [37]. In brief, the SPINK1-ERK-HNF4α-CES2/CYP3A5 signaling pathway indicates the co-expression of SPINK1 with CES2 and CYP3A5. Notably, CES2 and CYP3A5 serve as pivotal regulators in drug metabolic pathways across various cancer types [25,38]. Upregulation of CES2 has been found in oxaliplatin resistance cells. Additionally, oxaliplatin resistance could be reversed by CES2 knockdown [39]. These findings suggest that the activation of the SPINK1-CES2 signaling may contribute to oxaliplatin resistance. Furthermore, a transcription variant of CYP3A5 has been found to induce the production of the N-oxide sorafenib and diminishing its treatment efficacy [40], which implies that the activation of the SPINK1-CYP3A5 signaling may lead to sorafenib resistance. Taken together, high level of SPINK1 expression indicates multi-drug resistance mediated through CES2 and CYP3A5.
Collectively, through comprehensive use of scRNA-seq and ST, we have identified the treatment-resistant characteristics in SPINK1-high HCC cells, which attributes to the co-expression pattern of SPINK1 with CES2 and CYP3A5. This study unveils a novel HCC chemosensitivity stratification tool and provides a promising druggable target for HCC treatments.
5. Conclusions
In summary, our study integrates scRNA-seq and ST data to elucidate the roles of SPINK1 in HCC treatment resistance. The overexpression of SPINK1 is indicative of a poorer prognosis for HCC patients. At single-cell level, HCC cells exhibiting high SPINK1 expression demonstrate resistance to therapy through an active drug metabolic signaling pathway, a process facilitated by the histological co-expression of SPINK1 with CES2 and CYP3A5. The identification of SPINK1 function on HCC therapy resistance provides a potential indicator for treatment effectiveness prediction.
The reference list from the paper itself. Each links out to its DOI / PubMed record.
- 1Sung H. Ferlay J. Siegel R.L. Laversanne M. Soerjomataram I. Jemal A. Bray F. Global Cancer Statistics 2020: GLOBOCAN Estimates of Incidence and Mortality Worldwide for 36 Cancers in 185 Countries CA Cancer J. Clin.20217120924910.3322/caac.2166033538338 · doi ↗ · pubmed ↗
- 2Akinyemiju T. Abera S. Ahmed M. Alam N. Alemayohu M.A. Allen C. Al-Raddadi R. Alvis-Guzman N. Amoako Y. Artaman A. The Burden of Primary Liver Cancer and Underlying Etiologies From 1990 to 2015 at the Global, Regional, and National Level JAMA Oncol.20173168316912898356510.1001/jamaoncol.2017.3055 PMC 5824275 · doi ↗ · pubmed ↗
- 3Galle P.R. Forner A. Llovet J.M. Mazzaferro V. Piscaglia F. Raoul J.-L. Schirmacher P. Vilgrain V. EASL Clinical Practice Guidelines: Management of hepatocellular carcinoma J. Hepatol.20186918223610.1016/j.jhep.2018.03.01929628281 · doi ↗ · pubmed ↗
- 4Llovet J.M. Villanueva A. Marrero J.A. Schwartz M. Meyer T. Galle P.R. Lencioni R. Greten T.F. Kudo M. Mandrekar S.J. Trial Design and Endpoints in Hepatocellular Carcinoma: AASLD Consensus Conference Hepatology 20207315819110.1002/hep.3132732430997 · doi ↗ · pubmed ↗
- 5Yang C. Zhang H. Zhang L. Zhu A.X. Bernards R. Qin W. Wang C. Evolving therapeutic landscape of advanced hepatocellular carcinoma Nat. Rev. Gastroenterol. Hepatol.20222020322210.1038/s 41575-022-00704-936369487 · doi ↗ · pubmed ↗
- 6Liao C. Wang Q. An J. Zhang M. Chen J. Li X. Xiao L. Wang J. Long Q. Liu J. SPIN Ks in Tumors: Potential Therapeutic Targets Front. Oncol.20221283374110.3389/fonc.2022.83374135223512 PMC 8873584 · doi ↗ · pubmed ↗
- 7Lin T.-C. Functional Roles of SPINK 1 in Cancers Int. J. Mol. Sci.202122381410.3390/ijms 2208381433916984 PMC 8067593 · doi ↗ · pubmed ↗
- 8Holah N.S. El-Azab D.S. Aiad H.A.E.S. Sweed D.M.M. The Diagnostic Role of SPINK 1 in Differentiating Hepatocellular Carcinoma From Nonmalignant Lesions Appl. Immunohistochem.20172570371110.1097/PAI.000000000000036327028242 · doi ↗ · pubmed ↗